. 2024 Oct 8;8(10):e70016.
doi: 10.1002/hem3.70016. eCollection 2024 Oct.

Combined inhibition of CTPS1 and ATR is a metabolic vulnerability in p53-deficient myeloma cells

Affiliations

Combined inhibition of CTPS1 and ATR is a metabolic vulnerability in p53-deficient myeloma cells

Romane Durand et al. Hemasphere. .

Abstract

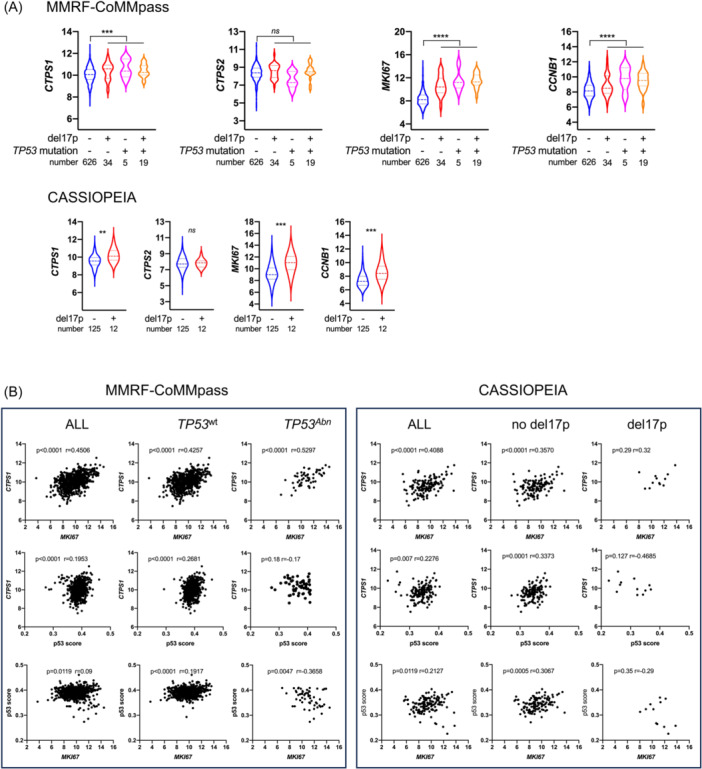
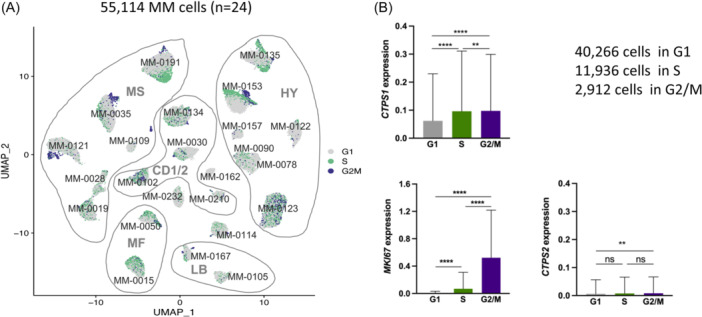
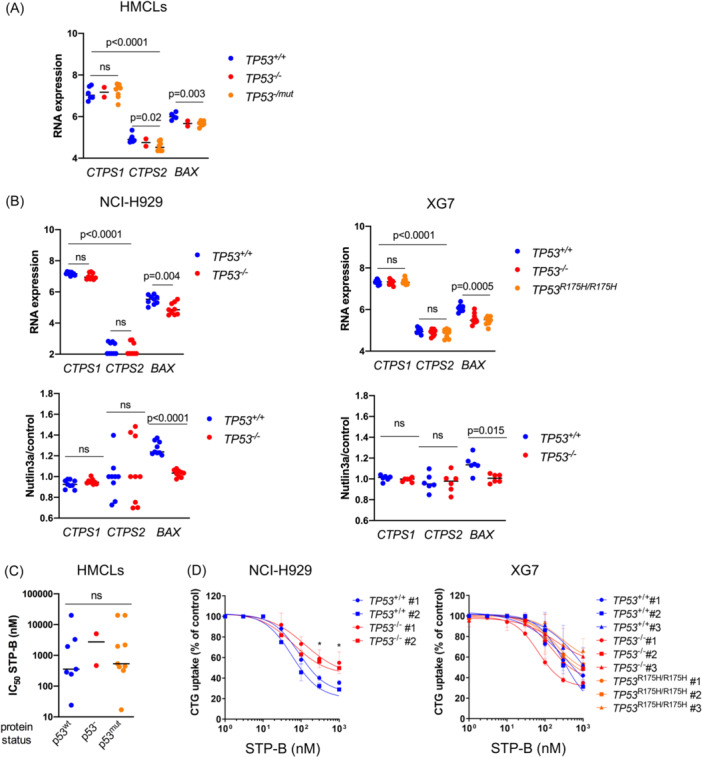
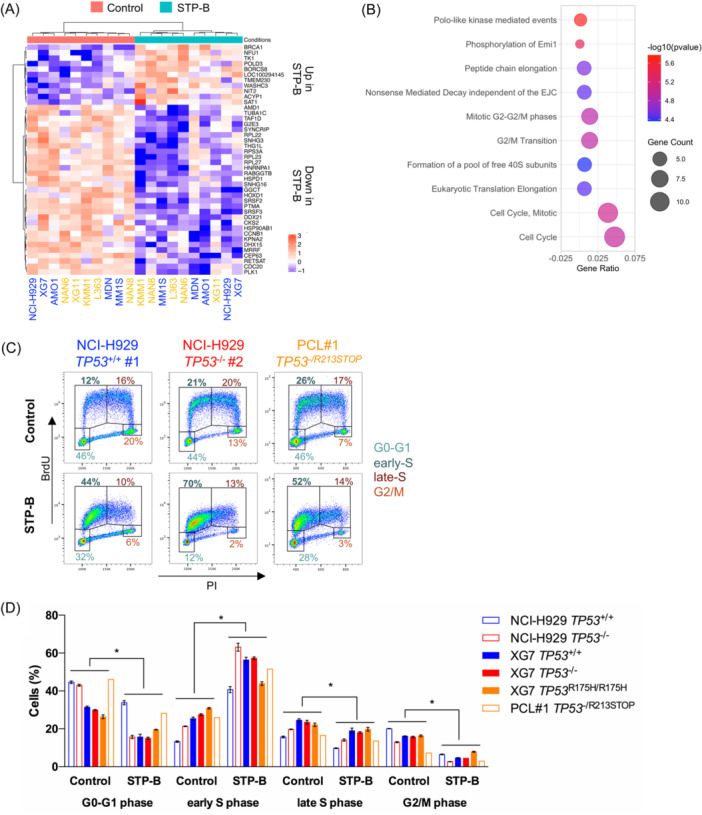
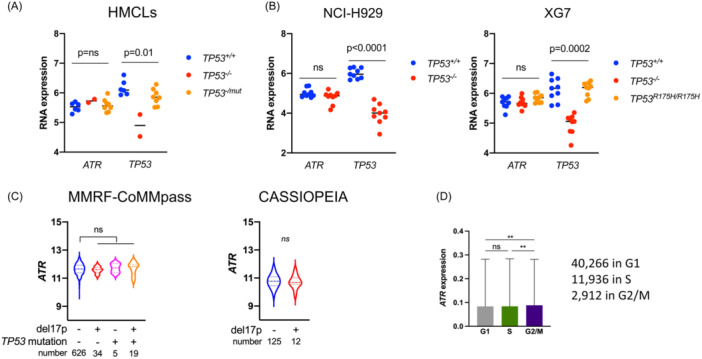
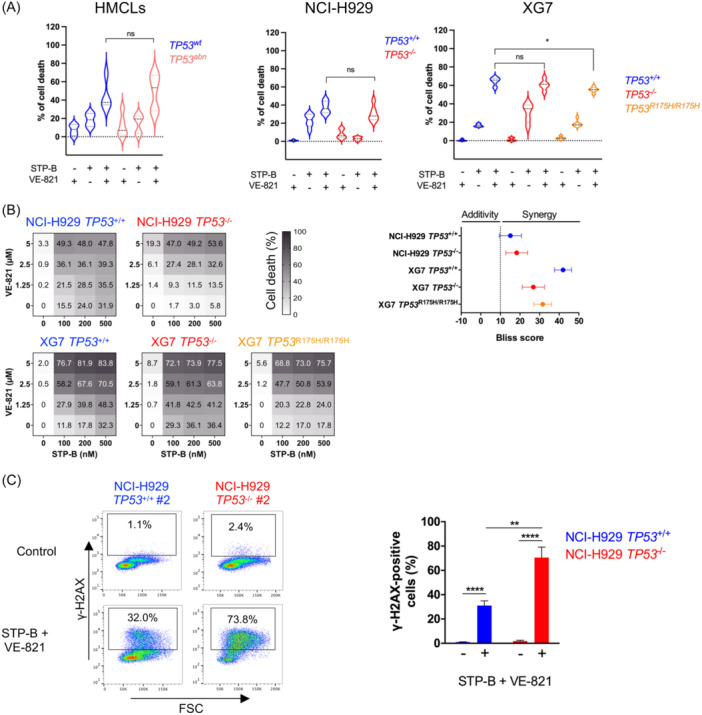
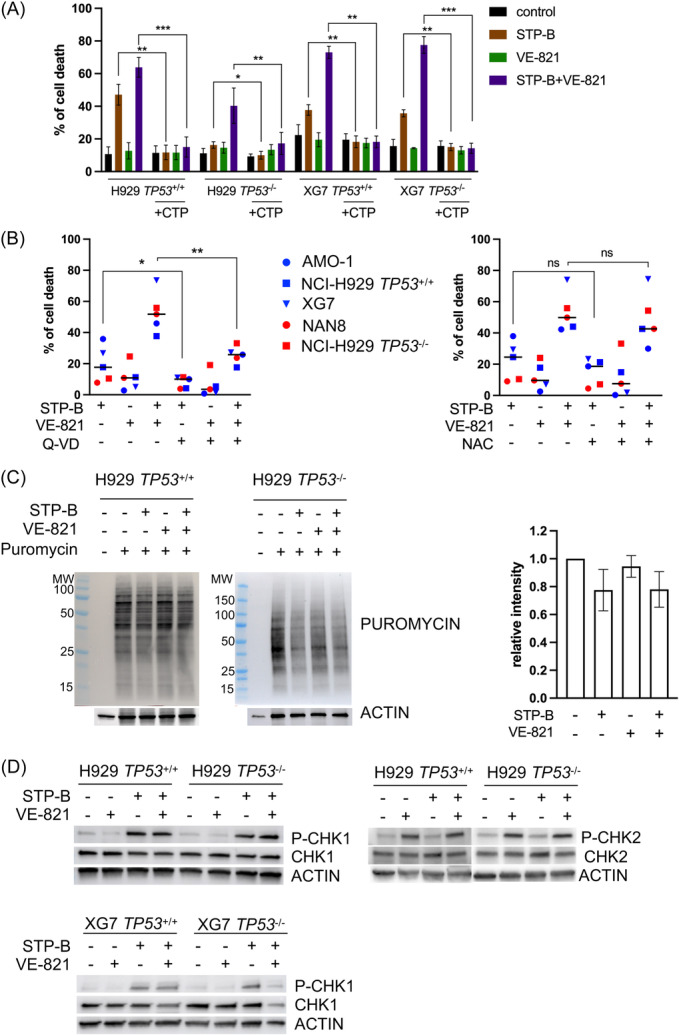
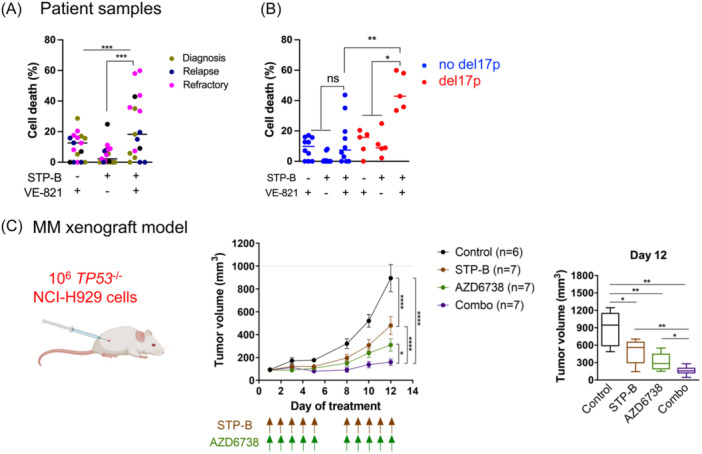
In multiple myeloma, as in B-cell malignancies, mono- and especially bi-allelic TP53 gene inactivation is a high-risk factor for treatment resistance, and there are currently no therapies specifically targeting p53 deficiency. In this study, we evaluated if the loss of cell cycle control in p53-deficient myeloma cells would confer a metabolically actionable vulnerability. We show that CTP synthase 1 (CTPS1), which encodes a CTP synthesis rate-limiting enzyme essential for DNA and RNA synthesis in lymphoid cells, is overexpressed in samples from myeloma patients displaying a high proliferation rate (high MKI67 expression) or a low p53 score (synonymous with TP53 deletion and/or mutation). This overexpression of CTPS1 was associated with reduced survival in two cohorts. Using scRNA-seq analysis in 24 patient samples, we further demonstrate that myeloma cells in the S or G2/M phase display high CTPS1 expression. Pharmacological inhibition of CTPS1 by STP-B induced cell cycle arrest in early S phase in isogenic NCI-H929 or XG7 TP53 +/+, TP53 -/-, and TP53 R175H/R175H cells and in a TP53 -/R123STOP patient sample. The functional annotation of transcriptional changes in 10 STP-B-treated myeloma cell lines revealed a decrease in protein translation and confirmed the blockade of cells into the S phase. The pharmacological inhibition of ATR, which governs the intrinsic S/G2 checkpoint, in STP-B-induced S-phase arrested cells synergistically induced cell death in TP53 +/+, TP53 -/-, and TP53 R175H/R175H isogenic cell lines (Bliss score >15). This combination induced replicative stress and caspase-mediated cell death and was highly effective in resistant/refractory patient samples with TP53 deletion and/or mutation and in TP53 -/- NCI-H929 xenografted NOD-scid IL2Rgamma mice. Our in vitro, ex vivo, and in vivo data provide the rationale for combined CTPS1 and ATR inhibition for the treatment of p53-deficient patients.


Conflict of interest statement

Hélène Asnagli, Andrew Parker, and Philip Beer are employees of Step Pharma. The remaining authors declare no conflict of interest.

Figures

Figure 1
Figure 1
CTP synthase 1 (CTPS1) expression is associated with proliferation and is increased in TP53 abnormal myeloma cells. (A) TP53 abnormal myeloma cells overexpress CTPS1, MKI67, and CCNB1. Upper panel: Expression of CTPS1, CTPS2, MKI67, and CCNB1 was assessed by RNA‐seq in myeloma cells from 684 patients (MMRF‐CoMMpass) annotated for TP53 status (TP53 deletion and/or TP53 mutation). TP53 status was considered abnormal when a VAF was inferior to −0.5 (deletion) or superior to 0.3 (mutation). Lower panel: Expression of CTPS1, CTPS2, MKI67, and CCNB1 was assessed by RNA‐seq in 137 myeloma samples (CASSIOPEIA) annotated for del17p. Del17p was considered positive when 50% of myeloma cells displayed 17p deletion. Statistical significance was determined using the Mann–Whitney test. (B) CTPS1 expression correlates with MKI67 expression or p53 score in patient samples. The expression of CTPS1 in the MMRF‐coMMpass or CASSIOPEIA cohort was analyzed according to MKI67 expression (upper panels), p53 score (middle panels) in all, TP53 wt , TP53 abn MMRF‐coMMpass samples or in all, del17p, and no del17p samples in CASSIOPEIA, respectively. Correlation between p53 score and MKI67 expression was assessed in all TP53 wt , TP53 abn MMRF‐CoMMpass samples or in all del17p, no del17p samples in CASSIOPEIA, respectively (lower panels). Statistical significance was determined using Spearman's test. Statistical significance is indicated in the figures with symbols **p < 0.01, ***p < 0.001 and ****p < 0.0001. ns, Not significant.
Figure 2
Figure 2
Myeloma cells in S and G2M phases overexpress CTP synthase 1 (CTPS1). (A) Myeloma cells in S and G2/M phases overexpress CTPS1 and not CTPS2. UMAP (uniform manifold approximation and projection) representation of myeloma cells from 24 samples (23 bone marrow and one pleural effusion). The myeloma classification of samples is indicated (MS, CD‐1/2, MF, LB, and HY). Mononuclear cells from the bone marrow or pleural effusion (MM‐0191) of 24 multiple myeloma patients were cultured overnight in RPMI‐1640 with 10% fetal calf serum and 3 ng/mL interleukin‐6 before undergoing cell processing and single‐cell RNA‐sequencing analysis. Myeloma cells were identified as described previously. Cell cycle signature was calculated using the AddModuleScore function of the Seurat package in R (gray: G1 phase; green: S phase; purple: G2/M phase). (B) The graphs represent the mean ± SD of CTPS1, MKI67, and CTPS2 expression in 55,114 myeloma cells according to the cell cycle phase. Statistical significance was determined using the Kruskal–Wallis test with Dunn's multiple comparison test. Statistical significance is indicated in the figures with symbols **p < 0.01 and ****p < 0.0001. ns, Not significant.
Figure 3
Figure 3
CTP synthase 1 (CTPS1) expression and response to CTPS1 inhibitor are not regulated by p53. (A) CTPS1, and not CTPS2, is highly expressed in TP53 abnormal myeloma cells. CTPS1, CTPS2, and BAX expression was assessed by SRP in 16 human myeloma cell lines (HMCLs). Statistical significance was determined using the Kruskal–Wallis and Mann–Whitney tests. (B) The expression of CTPS1 and CTPS2 is not regulated by p53. Upper panel: CTPS1, CTPS2, and BAX expression was assessed using SRP in the six isogenic NCI‐H929 clones (three TP53 +/+ and three TP53 −/− clones), as well as in the nine XG7 clones (three TP53 +/+, three TP53 −/−, and three TP53 R175H/R175H). Statistical significance was determined using the Kruskal–Wallis test. Lower panel: CTPS1, CTPS2, and BAX expression was assessed using SRP in the NCI‐H929 and XG7 clones treated, or not, with Nutlin3a (10 μM in NCI‐H929 and 2 μM in XG7) for 18 h. Results are expressed as the fold expression in Nutlin3a‐treated cells over untreated cells. Statistical significance was determined using the Kruskal–Wallis and Mann–Whitney tests. (C, D) TP53 abnormal myeloma cells are sensitive to CTPS1 inhibitor STP‐B. Response to STP‐B was assessed by CellTiter‐Glo assay after 72 h of culture in (C) 18 HMCLs and in (D) TP53 isogenic clones from NCI‐H929 or XG7, as indicated. STP‐B half‐maximal inhibitory concentration (IC50) values were compared in HMCLs according to their p53 protein status. STP‐B IC50 values of HMCLs and clones are detailed in Table 1. Results represent the mean of two to three independent experiments performed in triplicate. Statistical significance was determined using the Kruskal–Wallis and Mann–Whitney tests. ns, Not significant.
Figure 4
Figure 4
STP‐B induces early S‐phase cell cycle arrest in myeloma cells regardless of their TP53 status. (A) STP‐B modulates the expression of 42 genes in myeloma cell lines Transcriptomic profiling was performed using SRP in 10 human myeloma cell lines (HMCLs) (five TP53 wt HMCLs annotated in blue and five TP53 abnormal HMCLs in yellow; see Table 1). HMCLs were treated for 24 h with STP‐B IC50 before RNA extraction and sequencing. Genes with significant differential expression (log 2 fold change <−0.5 or >0.5 and adjusted p < 0.05) were selected and shown in the supervised hierarchical clustering (control vs. STP‐B). (B) CTPS1 inhibition affects transcriptional programs related to cell cycle and translation. Pathway enrichment analysis was conducted using Reactome. The graph represents the 10 pathways most significantly affected by STP‐B treatment. (C, D) STP‐B induces early S‐phase cell cycle arrest in TP53 abnormal clones and in a patient sample. Cells were treated for 24 h with 200 nM STP‐B before incubation with bromodeoxyuridine (BrdU) from 30 (clones) to 90 min (patient sample). Cells were then fixed, permeabilized, stained with anti‐BrdU antibody and propidium iodide (PI), and analyzed using flow cytometry. (C) Representative BrdU/PI profiles of two NCI‐H929 clones (TP53 +/+ #1 and TP53 −/− #2) and of myeloma cells derived from a patient with plasma cell leukemia (PCL) with an abnormal TP53 status (PCL#1 TP53 −/R213STOP). (D) The bar graph summarizes the percentage of cells in G1, early S, late S, and G2/M phases in TP53 isogenic clones from NCI‐H929 and XG7 and in the PCL#1 patient sample treated or not with STP‐B. Statistical significance was determined using the Wilcoxon test. Statistical significance is indicated in the figures with symbol *p < 0.05.
Figure 5
Figure 5
ATR is expressed in multiple myeloma (MM) cells irrespective of TP53 status and cell cycle. (A) ATR expression was analyzed in TP53 +/+, TP53 −/−, or TP53 −/mut human myeloma cell lines using SRP. (B) ATR expression was analyzed in TP53 +/+, TP53 −/−, or TP53 R175H/R175H XG7 and/or NCI‐H929 clones using SRP 8B. (C) ATR expression was analyzed according to the presence of del17p and/or TP53 mutation in the MMRF‐CoMMpass cohort and according to the presence of del17p in the CASSIOPEIA cohort. (D) ATR expression in the 55,114 MM cells (see Figure 2) according to the cell cycle phase (mean ± SD). Statistical significance was determined using the Kruskal–Wallis test with Dunn's multiple comparison test. Statistical significance is indicated in the figures with symbol **p < 0.01. ns, Not significant.
Figure 6
Figure 6
The inhibition of CTPS1 and ATR is highly synergistic in p53‐deficient myeloma cells in vitro. (A) The STP‐B and VE‐821 combination is efficient in TP53 abnormal human myeloma cell lines (HMCLs) and in isogenic clones. Left panel: Four TP53 wt HMCLs (AMO1, BCN, XG6, and XG7) and five TP53 abnormal HMCLs (Karpas620, KMS12PE, NAN8, U266, and XG11) were treated for 72 h with 200 nM STP‐B, 2.5 μM VE‐821 or both (except XG11, which was treated with 10 nM STP‐B and 1 μM VE‐821). Cell death was assessed by Annexin‐V staining using flow cytometry. Statistical analysis was performed using the Mann–Whitney test. Middle and right panels: TP53 +/+ (n = 2) and TP53 −/− (n = 2) clones from NCI‐H929, as well as TP53 +/+ (n = 2), TP53 −/− (n = 2) and TP53 R175H/R175H (n = 3) clones from XG7, were treated for 72 h with or without 200 nM STP‐B and/or 2.5 μM VE‐821, and cell death was assessed with Annexin‐V staining using flow cytometry. The data represents the results of two independent experiments. Statistical analyses were performed using the Mann–Whitney test. (B) STP‐B and VE‐821 combination highly synergizes in TP53 abnormal isogenic clones. Left panel: TP53 +/+ (n = 2) and TP53 −/− (n = 2) clones from NCI‐H929, as well as TP53 +/+ (n = 2), TP53 −/− (n = 2), and TP53 R175H/R175H (n = 3) clones from XG7, were treated for 72 h with increasing concentrations of STP‐B (100, 200, and 500 nM) and/or VE‐821 (1.25, 2.5, or 5 μM). Cell death was assessed using Annexin‐V staining (left panels). Right panel: Bliss synergy scores were calculated using SynergyFinder. Data represent the mean ± SD of two to three experiments. (C) STP‐B and VE‐821 combination induces DNA damage. Cells were treated for 48 h with 200 nM STP‐B and 2.5 µM VE‐821, permeabilized and stained with AF647‐conjugated anti‐γ‐H2AX antibody. Fluorescence was assessed by FACs analysis. Left panel: Data are representative of one experiment. Right panel. The percentage of γ‐H2AX‐positive cells was determined in two TP53 +/+ (#1, #2) and two TP53 −/− (#1, #2) NCI‐H929 clones. The graph represents the mean ± SD of three independent experiments. Statistical significance is indicated in the figures with symbols *p < 0.05, **p < 0.01 and ****p < 0.0001. ns, Not significant.
Figure 7
Figure 7
Cell death induced by STP‐B and VE‐821 is strictly dependent on CTP and involves caspase activation. (A) The addition of CTP inhibits cell death induced by STP‐B alone or in combination with VE‐821. Cells were treated for 72 h with 200 nM STP‐B, 2.5 μM VE‐821, or both, and CTP (200 μM) was added daily to the culture medium. Cell death was assessed by Annexin‐V staining using flow cytometry. The graph represents the mean ± SD of three to four independent experiments. Statistical analyses were performed using the paired t‐test. (B) Cell death induced by STP‐B alone or in combination with VE‐821 is partly inhibited by the pan‐caspase inhibitor Q‐VD and not impaired by N‐acetyl cysteine (NAC). Cells were treated for 72 h with 200 nM STP‐B and 2.5 µM VE‐821 alone or in combination with or without 50 µM Q‐VD (left panel) or 5 mM NAC (right panel). The graph represents the mean of cell death induced in AMO1, NAN8, NCI‐H929 TP53 −/−, and NCI‐H929 TP53 +/+ and XG7 (n = 2 experiments for each cell line and clone). Cell death was assessed by Annexin‐V staining using flow cytometry. Statistical analysis was performed using the paired t‐test. (C) STP‐B alone or in combination with VE‐821 inhibits protein synthesis. Cells were treated overnight with 200 nM STP‐B and 2.5 µM VE‐821 alone or in combination, and 1 μM puromycin was added 30 min prior to lysis, protein extraction, and western blotting, as previously described. (D) STP‐B and VE‐821 induce CHK1 and CHK2 phosphorylation. Cells were treated for 24 h with 200 nM STP‐B and 2.5 µM VE‐821 alone or in combination, prior to lysis, protein extraction, and western blotting. Statistical significance is indicated in the figures with symbols *p < 0.05, **p < 0.01 and ***p < 0.001. ns, Not significant.
Figure 8
Figure 8
The inhibition of CTP synthase 1 (CTPS1) and ATR is synergistic in p53‐deficient myeloma cells ex vivo and in vivo. (A) The STP‐B and VE‐821 combination is efficient in del17p patient samples. Bone marrow (n = 15) or peripheral blood (n = 2) samples from patients with multiple myeloma at different stages (n = 5 diagnosis, n = 6 relapse, or n = 6 resistant/refractory) were treated for 72 h with 200 nM STP‐B, 2.5 μM VE‐821, or both. Cell death was assessed by the loss of CD138 staining using flow cytometry. Left panel: The graph represents the results in the 17 samples. (B) The graph represents the results in 15 samples according to their del17p status. Statistical analyses were performed using the Friedman test with Dunn's multiple comparisons test (left panel) or the Mann–Whitney test and paired t‐test (right panel). (C) STP‐B and ATR inhibitor AZD6738 prevent NCI‐H929 TP53 −/− cell growth in NSG mice. NSG mice were subcutaneously injected with 106 NCI‐H929 TP53 −/− cells (left panel). After 1 week, mice with detectable tumors were randomly distributed into four groups of seven mice and treated with STP‐B (30 mg/kg), AZD6738 (25 mg/kg), or both, as indicated by the arrows (middle panel). The graphs represent the tumor volume kinetics (mean ± SD, middle panel) and the tumor volume on Day 12 (right panel). Statistical analyses were performed using the two‐way analysis of variance with Tukey's multiple comparisons (middle graph) or the Mann–Whitney test (right graph). Statistical significance is indicated in the figures with symbols *p < 0.05, **p < 0.01 and ***p < 0.001. ns, Not significant; NSG, NOD‐scid IL2Rgamma.

References

    1. Moreau P, Attal M, Hulin C, et al. Bortezomib, thalidomide, and dexamethasone with or without daratumumab before and after autologous stem‐cell transplantation for newly diagnosed multiple myeloma (CASSIOPEIA): a randomised, open‐label, phase 3 study. Lancet. 2019;394(10192):29‐38. - PubMed
    1. Moreau P, Garfall AL, van de Donk NWCJ, et al. Teclistamab in relapsed or refractory multiple myeloma. N Engl J Med. 2022;387(6):495‐505. - PMC - PubMed
    1. Berdeja JG, Madduri D, Usmani SZ, et al. Ciltacabtagene autoleucel, a B‐cell maturation antigen‐directed chimeric antigen receptor T‐cell therapy in patients with relapsed or refractory multiple myeloma (CARTITUDE‐1): a phase 1b/2 open‐label study. Lancet. 2021;398(10297):314‐324. - PubMed
    1. Munshi NC, Anderson LD, Shah N, et al. Idecabtagene vicleucel in relapsed and refractory multiple myeloma. N Engl J Med. 2021;384(8):705‐716. - PubMed
    1. Manier S, Ingegnere T, Escure G, et al. Current state and next‐generation CAR‐T cells in multiple myeloma. Blood Rev. 2022;54:100929. - PubMed

LinkOut - more resources