Clinical Trial
. 2024 Sep 24:15:1441944.
doi: 10.3389/fimmu.2024.1441944. eCollection 2024.

Co-regulation of innate and adaptive immune responses induced by ID93+GLA-SE vaccination in humans

Affiliations
Clinical Trial

Co-regulation of innate and adaptive immune responses induced by ID93+GLA-SE vaccination in humans

Andrew Fiore-Gartland et al. Front Immunol. .

Abstract

Introduction: Development of an effective vaccine against tuberculosis is a critical step towards reducing the global burden of disease. A therapeutic vaccine might also reduce the high rate of TB recurrence and help address the challenges of drug-resistant strains. ID93+GLA-SE is a candidate subunit vaccine that will soon be evaluated in a phase 2b efficacy trial for prevention of recurrent TB among patients undergoing TB treatment. ID93+GLA-SE vaccination was shown to elicit robust CD4+ T cell and IgG antibody responses among recently treated TB patients in the TBVPX-203 Phase 2a study (NCT02465216), but the mechanisms underlying these responses are not well understood.

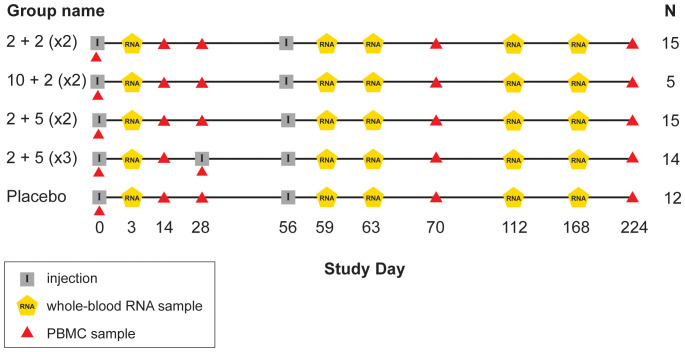
Methods: In this study we used specimens from TBVPX-203 participants to describe the changes in peripheral blood gene expression that occur after ID93+GLA-SE vaccination.

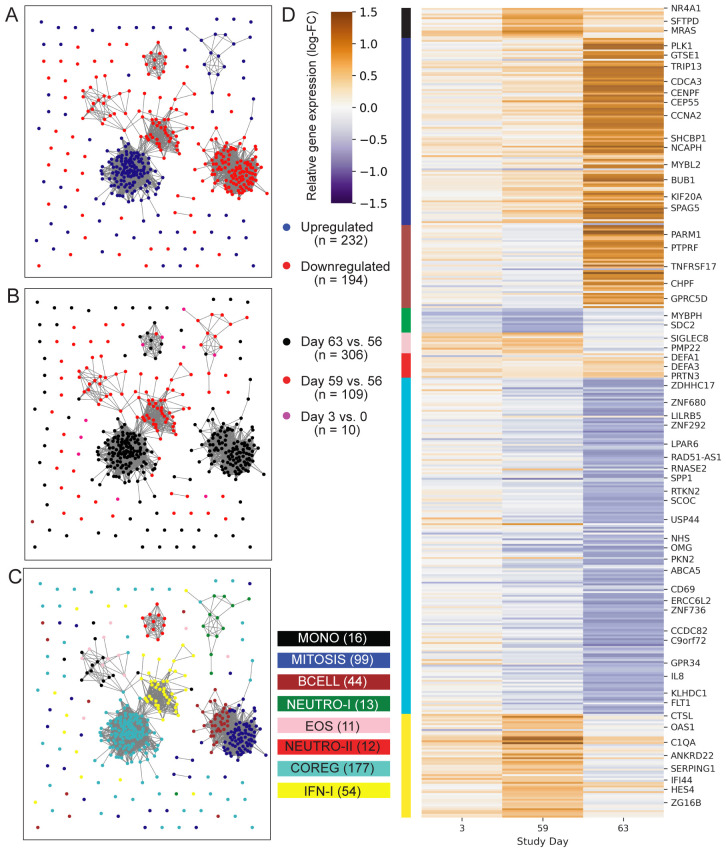
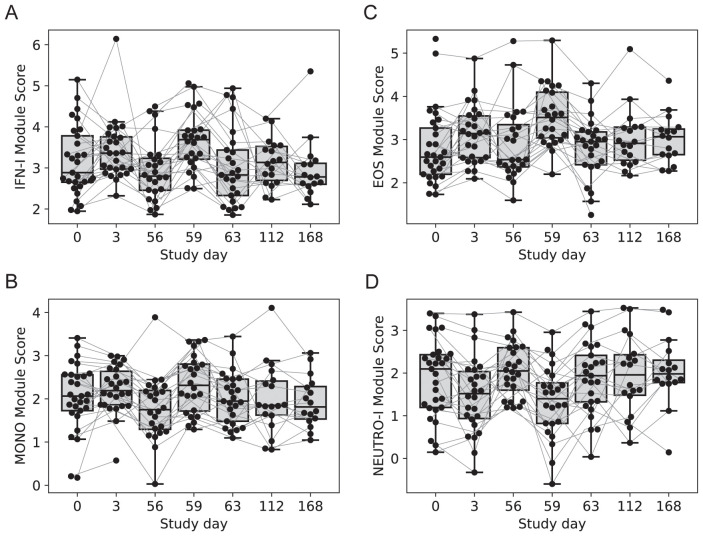
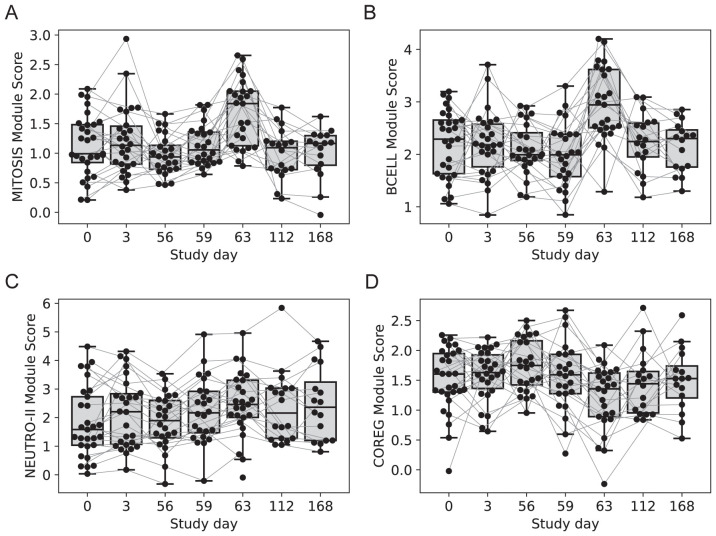
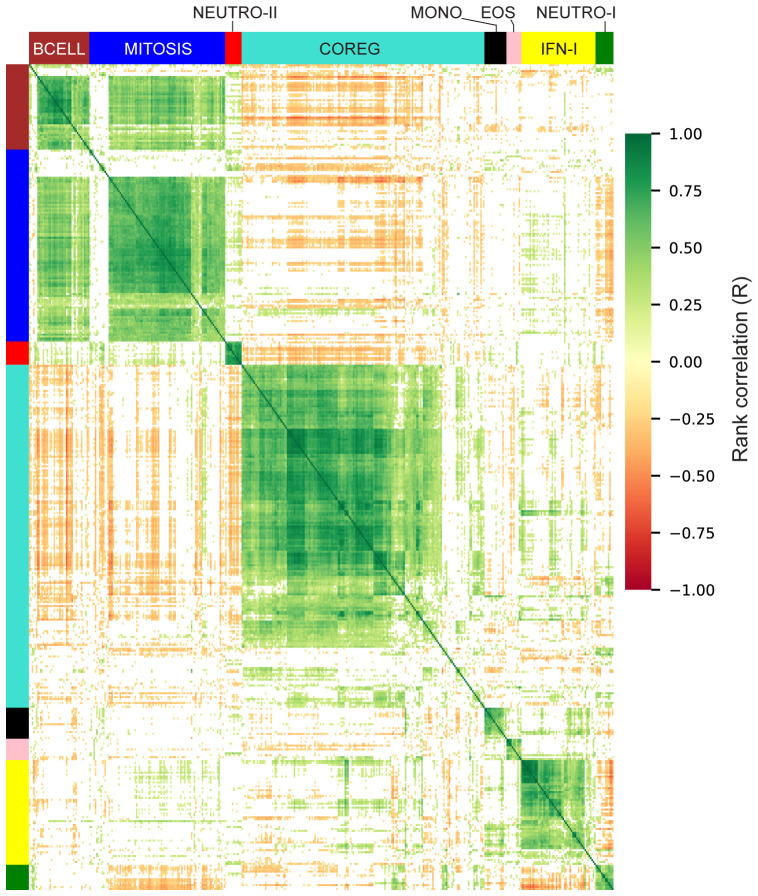
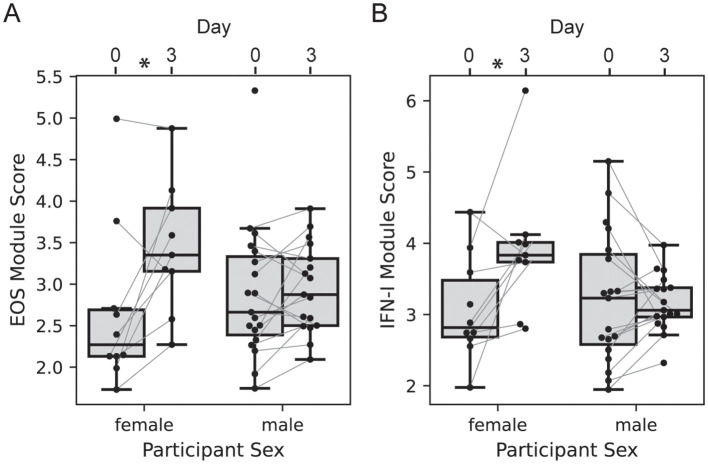
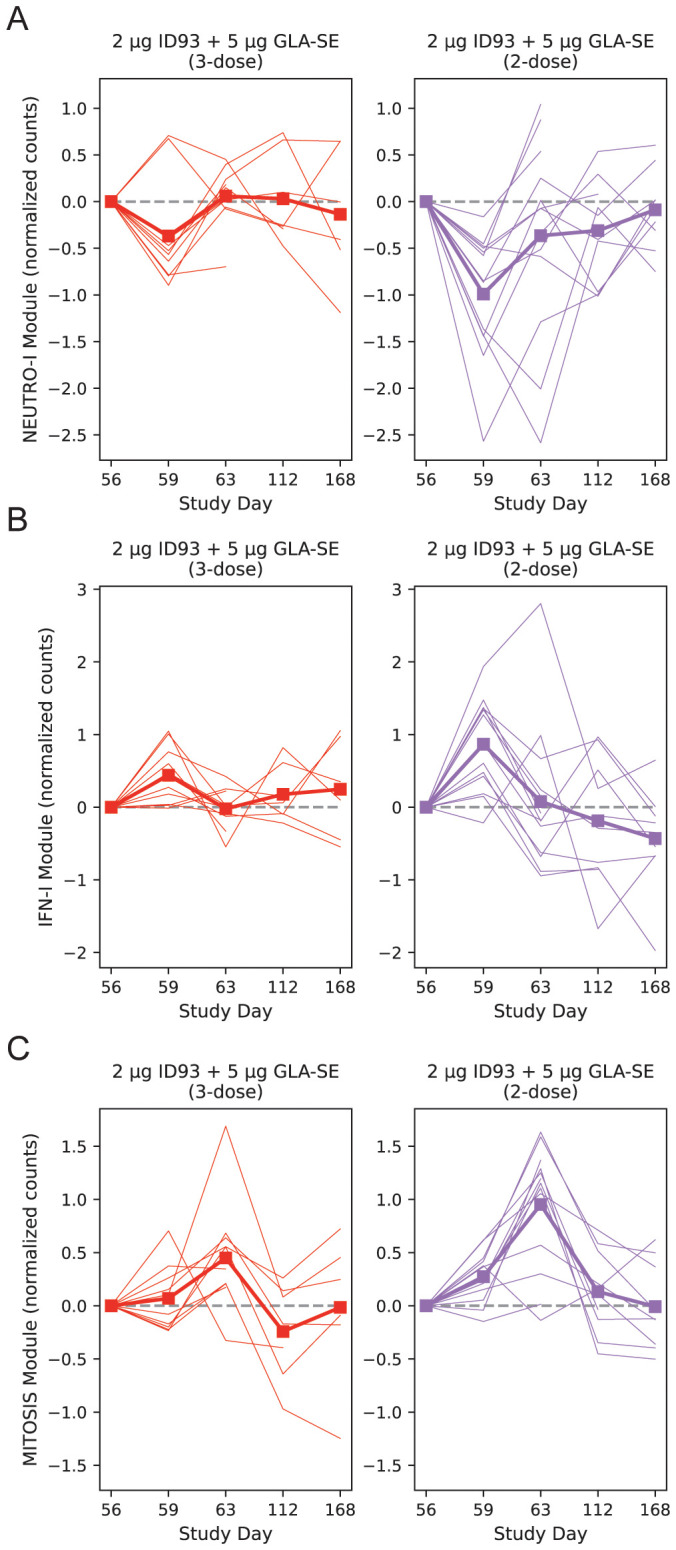
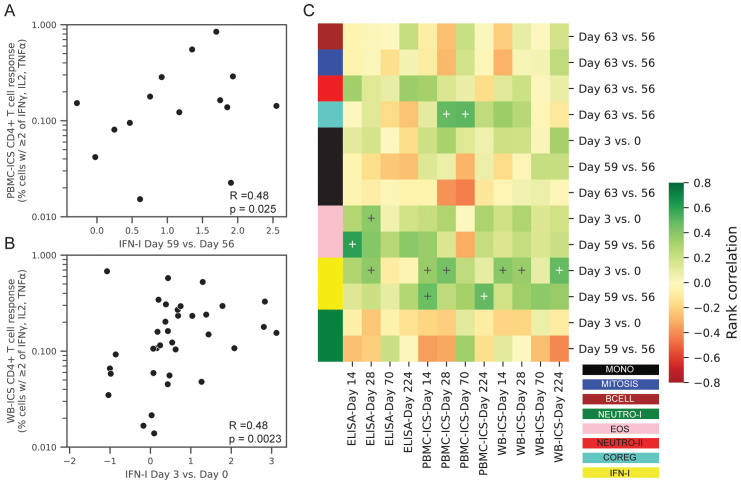
Results: Analyses revealed several distinct modules of co-varying genes that were either up- or down-regulated after vaccination, including genes associated with innate immune pathways at 3 days post-vaccination and genes associated with lymphocyte expansion and B cell activation at 7 days post-vaccination. Notably, the regulation of these gene modules was affected by the dose schedule and by participant sex, and early innate gene signatures were correlated with the ID93-specific CD4+ T cell response.

Discussion: The results provide insight into the complex interplay of the innate and adaptive arms of the immune system in developing responses to vaccination with ID93+GLA-SE and demonstrate how dosing and schedule can affect vaccine responses.

Keywords: RNA sequencing; innate; systems immunology; tuberculosis; vaccines.


Conflict of interest statement

Author SR was employed by the company HDT Bio Corporation. The remaining authors declare that the research was conducted in the absence of any commercial or financial relationships that could be construed as a potential conflict of interest. The author(s) declared that they were an editorial board member of Frontiers, at the time of submission. This had no impact on the peer review process and the final decision.

Figures

Figure 1
Figure 1
Schedule of events in TBVPX-203 study. Schematic showing the timeline of study product injections and sample collection for participants in the five study groups of TBVPX-203. The group names are defined in Table 1 based on the dose of the ID93 antigen, the dose of the GLA-SE adjuvant and the number of injections. Schematic indicates the day of each visit relative to enrollment, and whether the visit included a product injection, a blood collection for RNA extraction or a blood collection for adaptive immune response assays.
Figure 2
Figure 2
Profile of ID93+GLA-SE differentially expressed genes. Network plots represent 426 genes (nodes) that were differentially expressed after ID93+GLA-SE vaccination. Significant differential expression was based on an unadjusted-p < 0.05, FDR-adjusted q-value < 0.2 and absolute-log2 fold-change > 0.5. Edges connecting nodes represent a positive rank correlation with R > 0.6 (edge length does not convey additional information). Node color indicates (A) up- (red) vs. down- (blue) regulation relative to pre-vaccination, (B) differential regulation at one of three time points: days 3 vs. 0 (pink), 59 vs. 56 (red) or 63 vs. 56 (black), or (C) membership in one of eight gene modules created using WGCNA. Genes that were differentially expressed at more than one time point are colored for the time point with the largest fold-change, therefore there are fewer genes plotted than total DEGs stated in results. Each gene is in exactly one module. (D) Heatmap indicates log-transformed fold-change for each differentially expressed gene, relative to the most recent vaccine dose (either day 0 or day 56). Module membership is indicated by the color bar. A subset of genes are labeled by gene symbol including some of those cited in the text or found in gene sets that were significantly enriched with DEGs in the GSEA analysis.
Figure 3
Figure 3
Longitudinal expression of modules with changes 3-days post-vaccination. Boxplots of the eigengene expression score for each participant in either the 2-dose or 3-dose “2 + 5” ID93+GLA-SE vaccine group (n=29). (A) IFN-I module, (B) MONOS module, (C) EOS module, (D) NEUTRO-I module. A line for each participant is overlaid, connecting longitudinal observations. Box extents indicate the interquartile range (IQR) with whiskers indicating the extent of the most extreme observation within1.5-times the IQR.
Figure 4
Figure 4
Longitudinal expression of modules with changes 7-days post-vaccination. Boxplots of the eigengene expression score for each participant in either the 2-dose or 3-dose “2 + 5” ID93+GLA-SE vaccine group (n=29). (A) MITOSIS module, (B) BCELL module, (C) NEUTRO-II module, (D) COREG module. A line for each participant is overlaid, connecting longitudinal observations. Box extents indicate the interquartile range (IQR) with whiskers indicating the extent of the most extreme observation within1.5-times the IQR.
Figure 5
Figure 5
Correlation heatmap of differentially expressed genes. Rank correlations were estimated for all pairs of differentially expressed genes. Genes are organized by module and hierarchically clustered within each module. Color bars indicate module membership. Correlations with abs-R < 0.2 are censored for clarity (white).
Figure 6
Figure 6
Participant sex modifies day 3 transcriptional response. Boxplots of the EOS (A) and IFN-I (B) module expression scores for each participant in either the 2-dose or 3-dose “2 + 5” ID93+GLA-SE vaccine group (n=29). Module expression score is the log-normalized transcript counts with a mean taken across all genes contained in the module. Scores are organized by visit with lines connecting the scores of an individual participant at day 0 and day 3, and by sex (n=10 of 29 female). Linear mixed modeling showed a significant modification of the vaccine-induced change by sex (EOS p = 0.022; IFN-I p=0.012).
Figure 7
Figure 7
Post-boost transcriptional changes by treatment group. Baseline-subtracted normalized expression level plotted for the NEUTRO-I (A), IFN-I (B) and MITOSIS (C) modules, organized by participant and day. A module’s expression is the log-normalized transcript counts with a mean taken across all genes contained in the module; each participant’s module expression at day 0 is subtracted from the time series for that individual. Module expression values are plotted longitudinally with each participant represented by a single line and the group mean represented by a thick line and square symbols (treatment group indicated at the top of each panel). Linear mixed modeling showed that the 2-dose group had a greater change at day 59 vs. 56 for the NEUTRO-I module (p=0.049) with a trend for the IFN-I module (p=0.094). At day 63 vs. day 56 the MITOSIS module had a larger response in the 2-dose group (p=0.0013). Dashed line on each plot indicates zero change from day 0 (i.e., pre-vaccine) expression. Broken lines represent missing data that result from missing samples.
Figure 8
Figure 8
Correlations between transcriptional responses and ID93-specific adaptive responses. Rank correlations between pairs of gene module expression changes and absolute levels of ID93-specific CD4+ T-cell responses and IgG antibody levels in the blood. Transcriptional changes were expressed as changes in the eigengene score between two days (e.g., day 3 vs. 0). CD4+ T-cell responses were measured by PBMC-ICS or WB-ICS while IgG was measured by ID93 ELISA. Significant correlations (FDRq < 0.2 and p<0.05) included (A) PBMC-ICS at day 224 with IFN-I at day 59 vs. 56 and (B) WB-ICS at day 224 and IFN-I at day 3 vs. 0 (rank correlation coefficient R and unadjusted p-valued indicated in lower left corner of panel). (C) Heatmap of all tested correlations organized by module color (see Figure 1 for key). Modules were only tested for correlation at the day that they showed a significant change post-vaccination (13 comparisons). Crosses on heatmap indicate an unadjusted p < 0.05 (black and white for visual clarity).
Figure 9
Figure 9
Classification of high versus low CD4+ T-cell responders. Participants in all vaccine groups were categorized as high or low based on the median of the CD4+ T-cell response; (A) PBMC-ICS and (B) WB-ICS responses were analyzed separately. Regularized logistic regression (L1 penalty) was used to train a classifier based on feature sets: (1) Prime: modules that responded after the 1st dose (4 features), (2) Boost: modules that responded after boost dose (i.e., day 56, 9 features), (3) IFN-I modules after the prime and boost (2 features), (4) Combination of all prime and boost modules (13 features). Classifier performance was evaluated in 5-fold cross-validation (CV). Receiver operator curves (ROC) are plotted for each feature set, with cross-validated area under the ROC curve (CV-AUC) and 95% confidence interval (CI) indicated above the plot. Gray dashed line indicates performance equivalent to uninformed guessing.

References

    1. World Health Organization . Global Tuberculosis Report 2023 . Available online at: https://www.who.int/teams/global-tuberculosis-programme/tb-reports/globa... (Accessed May 4, 2024).
    1. Evans TG, Churchyard GJ, Penn-Nicholson A, Chen C, Gao X, Tait DR, et al. . Epidemiologic studies and novel clinical research approaches that impact TB vaccine development. Tuberculosis (Edinb). (2016) 99 Suppl 1:S21–5. doi: 10.1016/J.TUBE.2016.05.008 - DOI - PubMed
    1. Verver S, Warren RM, Beyers N, Richardson M, van der Spuy GD, Borgdorff MW, et al. . Rate of reinfection tuberculosis after successful treatment is higher than rate of new tuberculosis. Am J Respir Crit Care Med. (2005) 171:1430–5. doi: 10.1164/RCCM.200409-1200OC - DOI - PubMed
    1. Knight GM, Griffiths UK, Sumner T, Laurence YV, Gheorghe A, Vassall A, et al. . Impact and cost-effectiveness of new tuberculosis vaccines in low- and middle-income countries. Proc Natl Acad Sci USA. (2014) 111:15520–5. doi: 10.1073/PNAS.1404386111 - DOI - PMC - PubMed
    1. Tait DR, Hatherill M, van der Meeren O, Ginsberg AM, Van Brakel E, Salaun B, et al. . Final analysis of a trial of M72/AS01E vaccine to prevent tuberculosis. N Engl J Med. (2019) 381:2429–39. doi: 10.1056/NEJMOA1909953 - DOI - PubMed

Publication types