. 2024 Sep 20;10(19):e38182.
doi: 10.1016/j.heliyon.2024.e38182. eCollection 2024 Oct 15.

Mass spectrometry-based multi-omics analysis reveals distinct molecular features in early and advanced stages of hepatocellular carcinoma

Affiliations

Mass spectrometry-based multi-omics analysis reveals distinct molecular features in early and advanced stages of hepatocellular carcinoma

Mingzhu Fan et al. Heliyon. .

Abstract

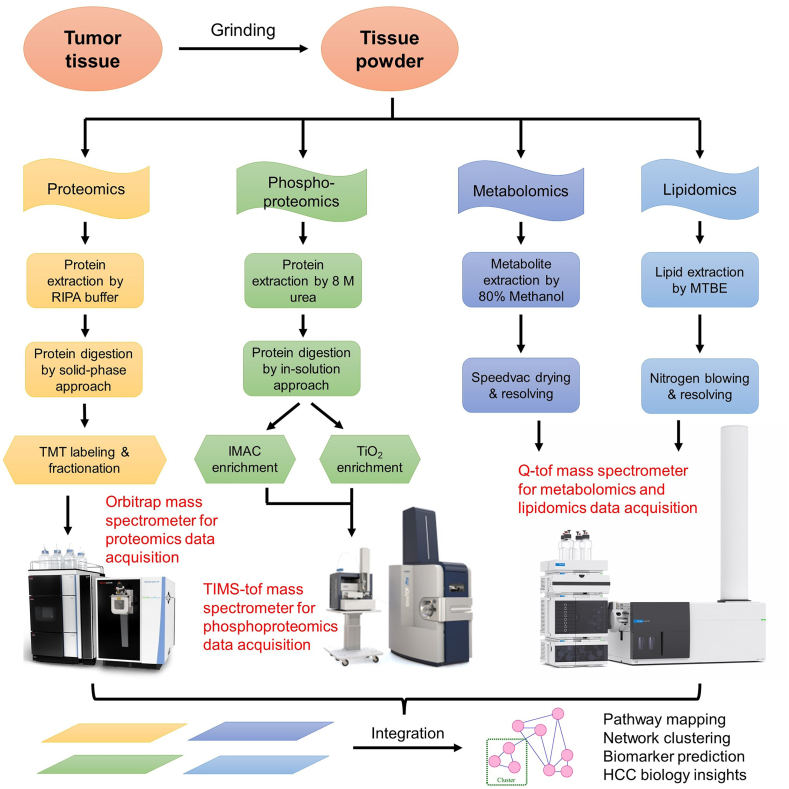
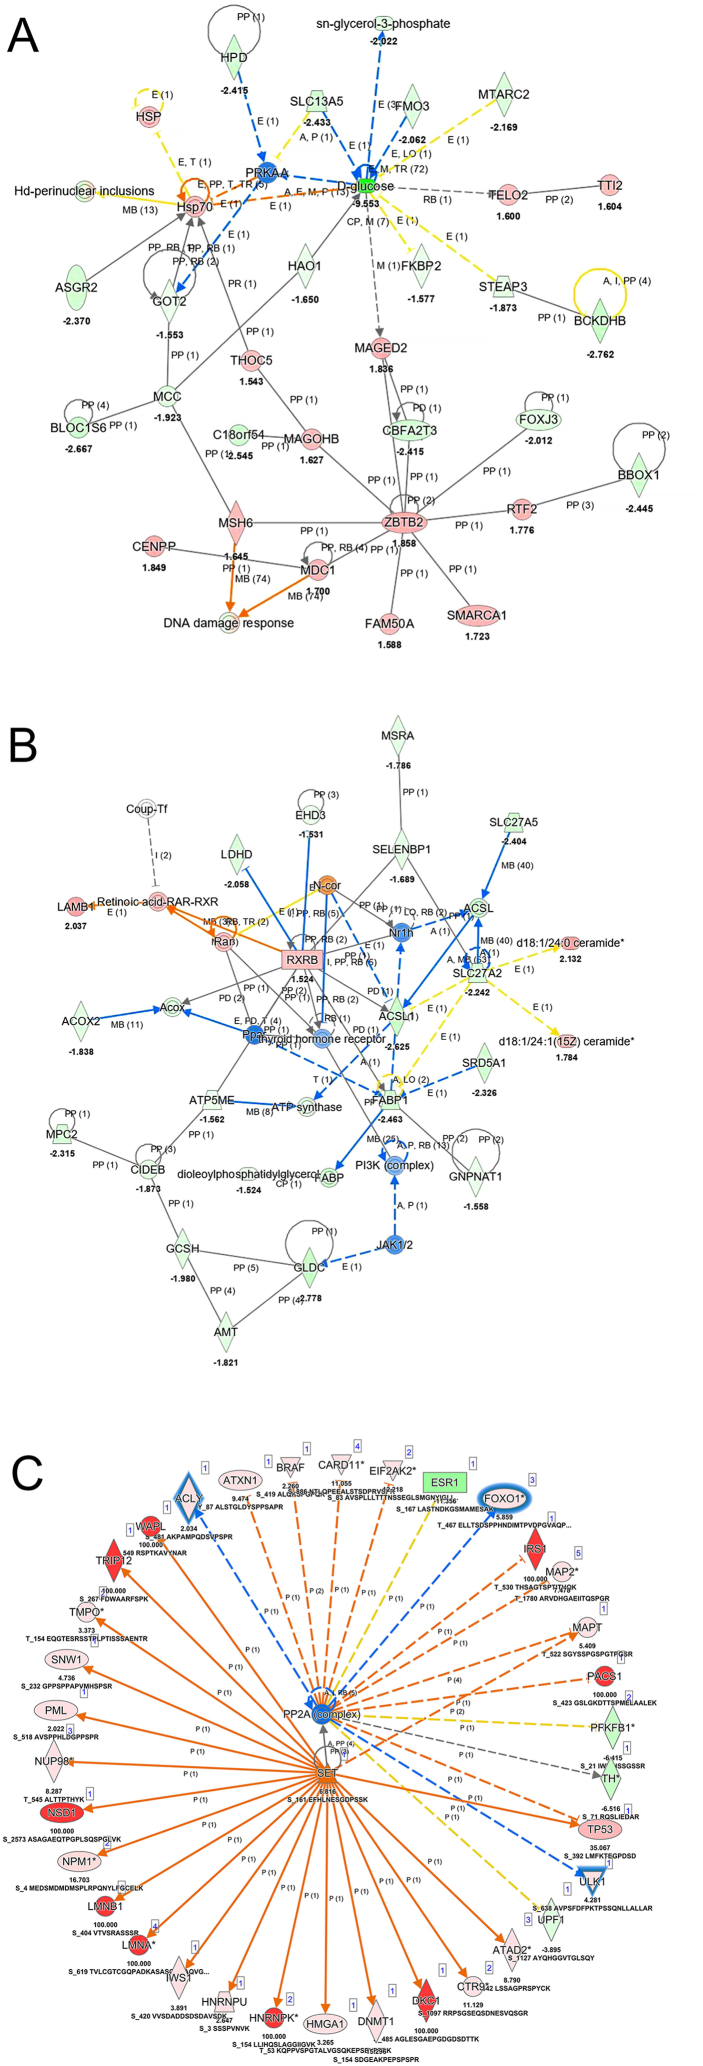
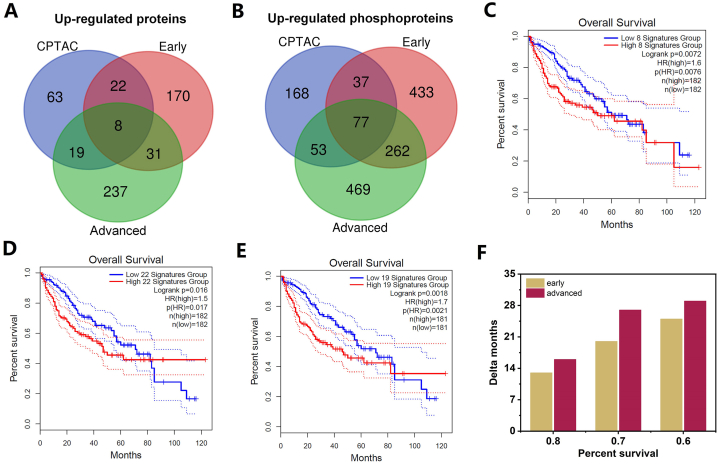
Hepatocellular Carcinoma (HCC) is a serious primary solid tumor that is prevalent worldwide. Due to its high mortality rate, it is crucial to explore both early diagnosis and advanced treatment for HCC. In recent years, multi-omics approaches have emerged as promising tools to identify biomarkers and investigate molecular mechanisms of biological processes and diseases. In this study, we performed proteomics, phosphoproteomics, metabolomics, and lipidomics to reveal the molecular features of early- and advanced-stage HCC. The data obtained from these omics were analyzed separately and then integrated to provide a comprehensive understanding of the disease. The multi-omics results unveiled intricate biological pathways and interaction networks underlying the initiation and progression of HCC. Moreover, we proposed specific potential biomarker panels for both early- and advanced-stage HCC by overlapping our data with CPTAC database for HCC diagnosis, and deduced novel insights and mechanisms related to HCC origination and development, such as glucose depletion during tumor progression, ROCK1 deactivation and GSK3A activation.

Keywords: Hepatocellular carcinoma; Metabolomics and lipidomics; Multi-omics analysis and integration; Proteomics and phosphoproteomics.


Conflict of interest statement

The authors declare that they have no known competing financial interests or personal relationships that could have appeared to influence the work reported in this paper.

Figures

Fig. 1
Fig. 1
Schematic representation of multi-omic experiments including proteomics, phosphoproteomics, metabolomics and lipidomics.
Fig. 2
Fig. 2
Proteomics, metabolomics and lipidomics of early and advanced-stage HCC. (A) and (B) Volcano plot analysis of TMT-labeled proteomics on early (A) and advanced (B) stage HCC. (C) The numbers of differentially accumulated metabolites and lipids quantified between early or advanced stage tumor and the normal tissue adjacent to the tumor. (D) and (E) Volcano plot analysis of metabolites quantified in early (D) or advanced (E) stage HCC. (F) and (G) Volcano plot analysis of lipids quantified in early (F) or advanced (G) stage HCC. The Statistically significantly (p-value<0.05, Student's t-test) up- (Fold change>1.5) and down-regulated (Fold change<0.67) molecules were showed in purple and red dots, respectively.
Fig. 3
Fig. 3
Phosphopeptide enrichment of early and advanced-stage HCC using the IMAC Fe-NTA and TiO2 strategies. (A) Overlap between all phosphopeptides quantified by IMAC Fe-NTA or TiO2 phosphopeptides enrichment method. (B) The composition of the mono- (1P), double- (2P), and multi- (3P) phosphorylated peptides quantified. (C) The percentage of phosphorylated serine (p-ser), threonine (p-thr), and tyrosine (p-tyr) in the quantified phosphopeptides. (D) Volcano plot analysis of quantified mono-phosphorylated peptides between early-stage tumor and the normal tissue adjacent to the tumor. (E) Volcano plot analysis of quantified mono-phosphorylated peptides between advanced-stage tumor and the normal tissue adjacent to the tumor. Statistically significantly (p-value<0.05, Student's t-test) up- (Fold change>2) and down-regulated (Fold change<0.5) phosphopeptides with unique mono-phosphorylation sites were showed in purple and red dots, respectively.
Fig. 4
Fig. 4
Kinase-substrate enrichment analysis of phosphoproteomic data of early- or advanced-stage HCC. (A) and (B) The enriched kinase identified in early (A) or advanced (B) stage tumor tissues when compared with the normal tissue adjacent to the tumor. Significantly hyperactivated and deactivated kinase are illustrated by red or blue, respectively. Significance thresholds were set to a z-score cutoff of 2, p value cutoff of 0.05, and substrate count cutoff of 5.
Fig. 5
Fig. 5
Interaction networks based on PML analysis (A&B) and phosphorylation analysis (C) using IPA. (A) A network of glucose depletion triggering DNA damage response. (B) Interaction networks of retinoid X and lipid metabolism. (C) Upstream analysis of SET and PP2A. Orange and blue solid lines indicate direct activation and inhibition, respectively. Yellow lines present findings were not consistent with state of downstream molecules. Dashed lines indicate indirect relationship while gray lines signify effect was not predicted. Shapes filled with red and green presents increased and decreased measurement, respectively.
Fig. 6
Fig. 6
Potential biomarker panels with clinical prognostic significance. Venn diagram showing the overlap among the up-regulated proteins (A) and phosphoproteins (B) analyzed from CPTAC database, early- and advanced stage HCC data in current study. Kaplan–Meier analysis for the overall survival of the 8- (C), 22- (D) and 19- (E) gene signatures. The comparisons of the reduced month time of the high expression between early- and advanced-stage specific gene signatures (F).
Fig. 7
Fig. 7
The summarized enriched pathways and an illustrated mechanism of HCC progression. (A) The comparison analysis of enriched pathways for PML assay in early-stage HCC (Group I), PML assay in advanced-stage HCC (Group II), proteome assay of CPTAC database (Group III), phosphorylation assay in early-stage HCC (Group IV), phosphorylation assay in advanced-stage HCC (Group V) and phosphorylation assay of CPTAC database (Group VI). The orange color and blue color in the heatmap represent pathway activation and inhibition, respectively. The darker color is related to larger z-score, which means the higher degree of activation or inhibition. (B) The summarized characterization of early- and advanced-stage HCC from the current omics study.

References

    1. Forner A., Llovet J.M., Bruix J. Hepatocellular carcinoma. Lancet. 2012;379:1245–1255. - PubMed
    1. Hartke J., Johnson M., Ghabril M. The diagnosis and treatment of hepatocellular carcinoma. Semin. Diagn. Pathol. 2017;34:153–159. - PubMed
    1. Llovet J.M., Kelley R.K., Villanueva A., Singal A.G., Pikarsky E., Roayaie S., Lencioni R., Koike K., Zucman-Rossi J., Finn R.S. Hepatocellular carcinoma. Nat. Rev. Dis. Prim. 2021;7:6. - PubMed
    1. Ganesan P., Kulik L.M. Hepatocellular carcinoma: new developments. Clin. Liver Dis. 2023;27:85–102. - PubMed
    1. Sung H., Ferlay J., Siegel R.L., Laversanne M., Soerjomataram I., Jemal A., Bray F. Global cancer statistics 2020: GLOBOCAN estimates of incidence and mortality worldwide for 36 cancers in 185 countries. Ca - Cancer J. Clin. 2021;71:209–249. - PubMed

LinkOut - more resources