

Deep Proteome Analysis of Cerebrospinal Fluid from Pediatric Patients with Central Nervous System Cancer
- PMID: 39382389
- PMCID: PMC11536435
- DOI: 10.1021/acs.jproteome.4c00471
Deep Proteome Analysis of Cerebrospinal Fluid from Pediatric Patients with Central Nervous System Cancer
Abstract
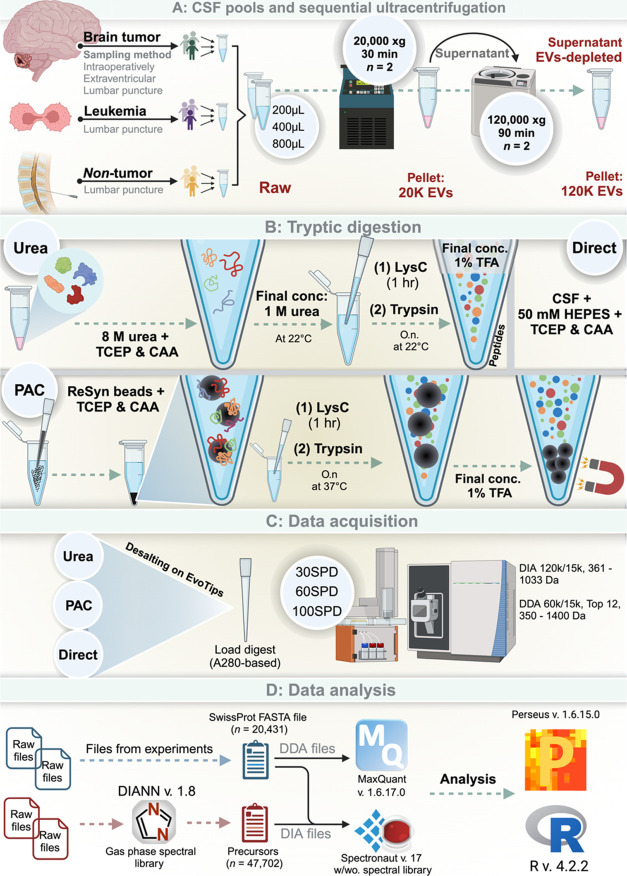
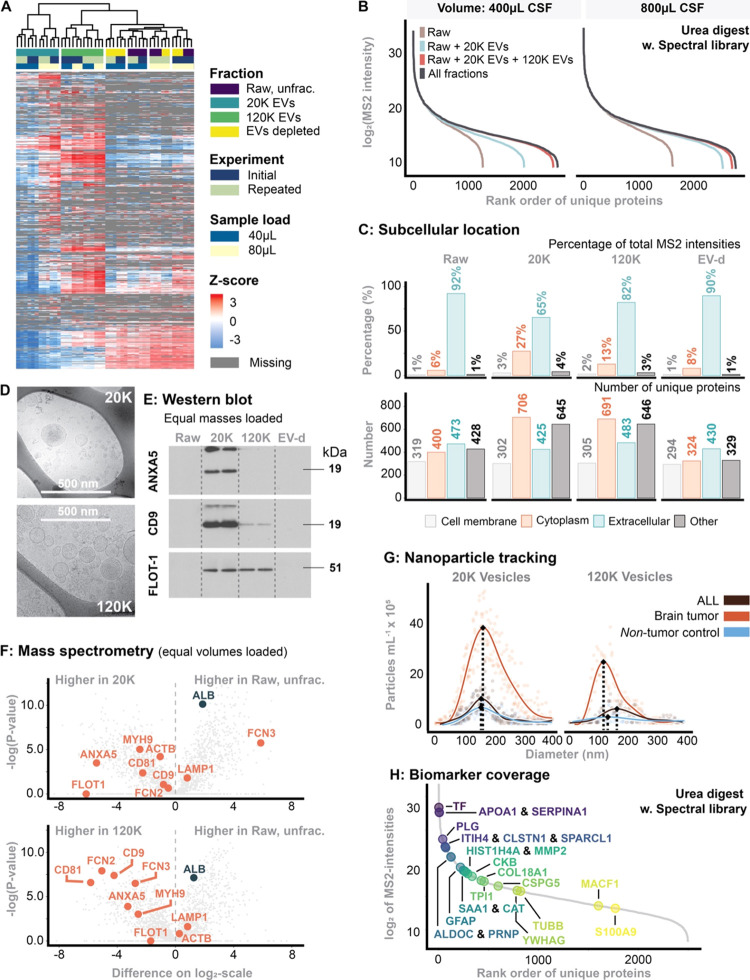
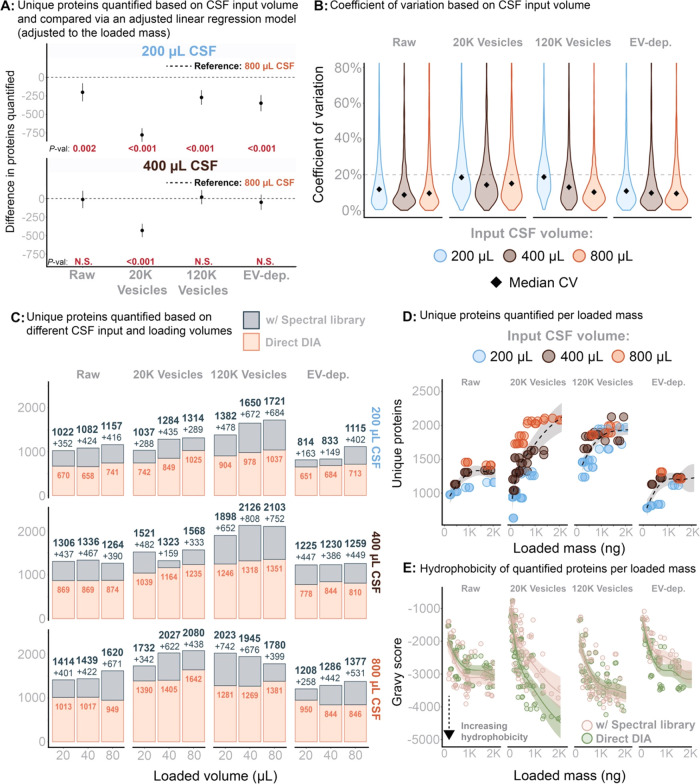
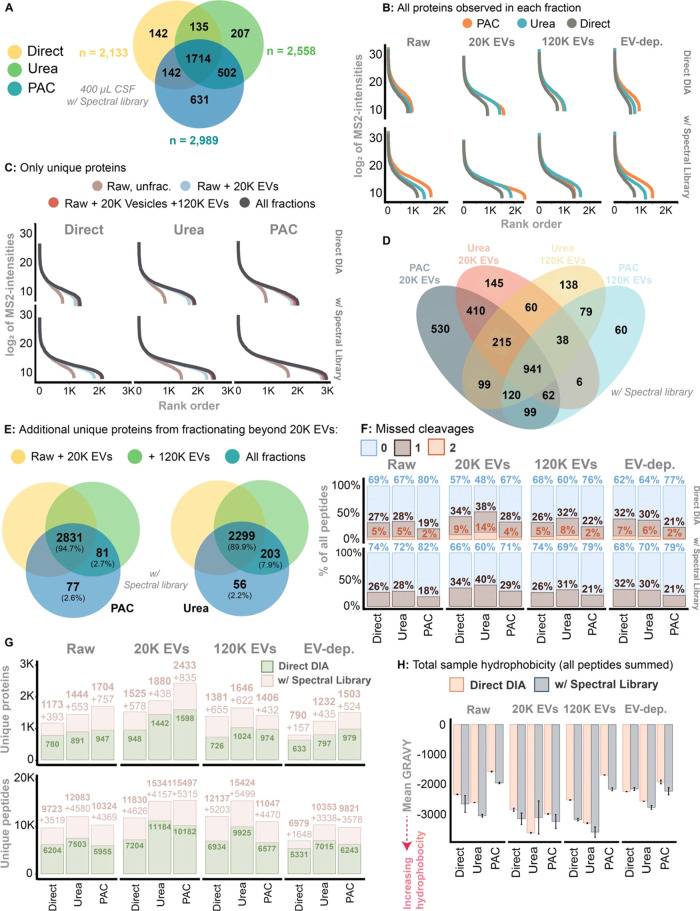
The cerebrospinal fluid (CSF) is a key matrix for discovery of biomarkers relevant for prognosis and the development of therapeutic targets in pediatric central nervous system malignancies. However, the wide range of protein concentrations and age-related differences in children makes such discoveries challenging. In addition, pediatric CSF samples are often sparse and first prioritized for clinical purposes. The present work focused on optimizing each step of the proteome analysis workflow to extract the most detailed proteome information possible from the limited CSF resources available for research purposes. The strategy included applying sequential ultracentrifugation to enrich for extracellular vesicles (EV) in addition to analysis of a small volume of raw CSF, which allowed quantification of 1351 proteins (+55% relative to raw CSF) from 400 μL CSF. When including a spectral library, a total of 2103 proteins (+240%) could be quantified. The workflow was optimized for CSF input volume, tryptic digestion method, gradient length, mass spectrometry data acquisition method and database search strategy to quantify as many proteins a possible. The fully optimized workflow included protein aggregation capture (PAC) digestion, paired with data-independent acquisition (DIA, 21 min gradient) and allowed 2989 unique proteins to be quantified from only 400 μL CSF, which is a 340% increase in proteins compared to analysis of a tryptic digest of raw CSF.
Keywords: CSF input volume; biomarker; cerebrospinal fluid; extracellular vesicle; protein aggregation capture.
Conflict of interest statement
The authors declare no competing financial interest.
Figures
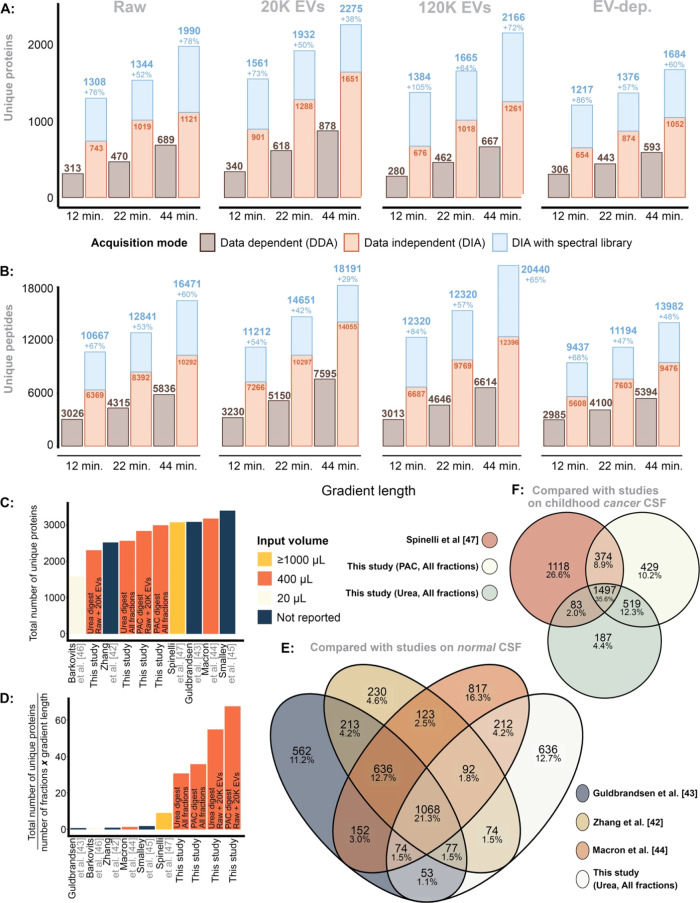
 . (E) The overlap
between unique proteins
identified in this study and compared to previous studies on CSF from
healthy donors. (G) The same, but the CSF study was performed on EV-enriched
samples from pediatric patients with a brain tumor.
. (E) The overlap
between unique proteins
identified in this study and compared to previous studies on CSF from
healthy donors. (G) The same, but the CSF study was performed on EV-enriched
samples from pediatric patients with a brain tumor.
References
MeSH terms
Substances
LinkOut - more resources
Full Text Sources
Molecular Biology Databases
