. 2024 Oct 9;148(1):50.
doi: 10.1007/s00401-024-02811-0.

Epigenetic landscape reorganisation and reactivation of embryonic development genes are associated with malignancy in IDH-mutant astrocytoma

Affiliations

Epigenetic landscape reorganisation and reactivation of embryonic development genes are associated with malignancy in IDH-mutant astrocytoma

Santoesha A Ghisai et al. Acta Neuropathol. .

Abstract

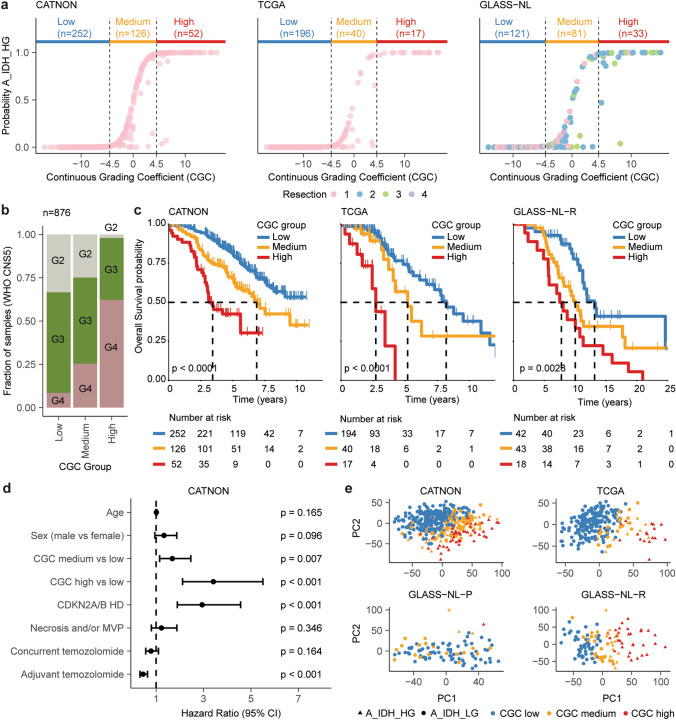
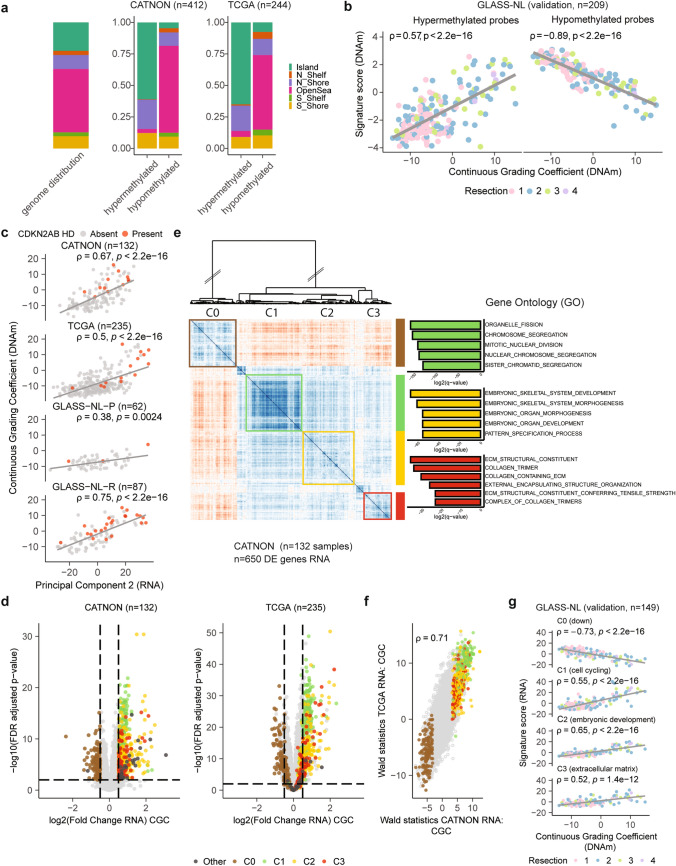
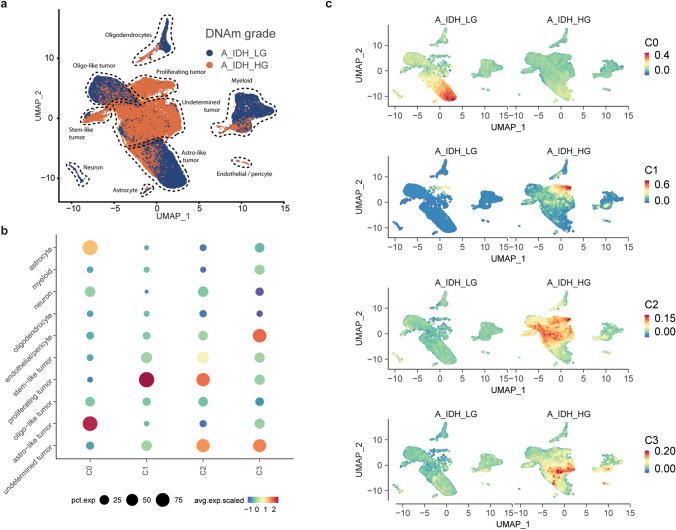
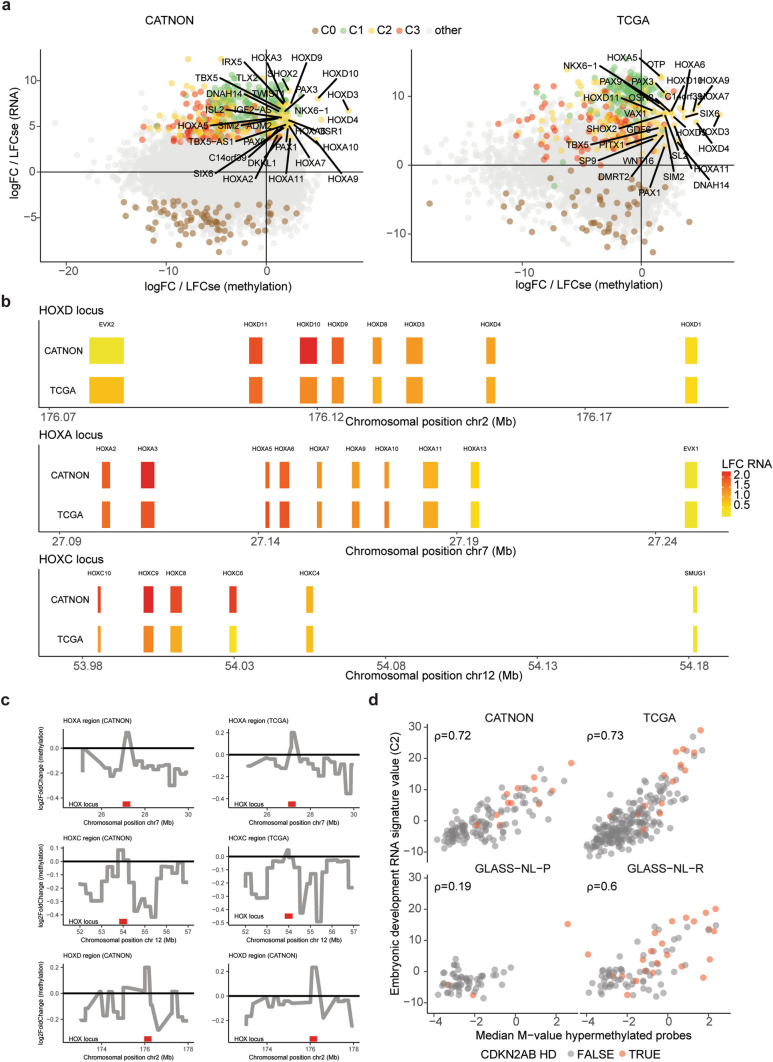
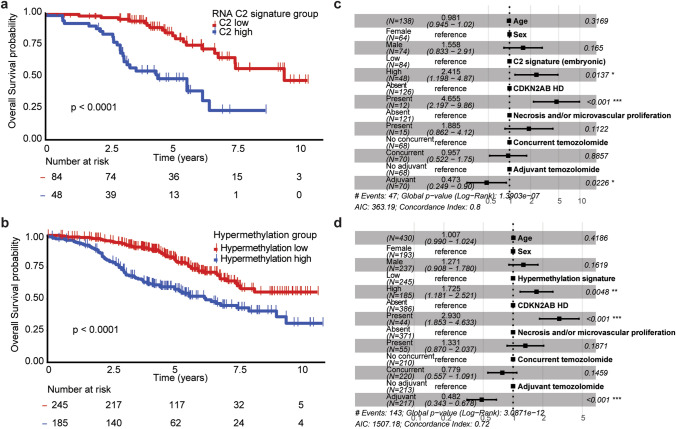
Accurate grading of IDH-mutant gliomas defines patient prognosis and guides the treatment path. Histological grading is challenging, and aside from CDKN2A/B homozygous deletions in IDH-mutant astrocytomas, there are no other objective molecular markers used for grading. RNA-sequencing was conducted on primary IDH-mutant astrocytomas (n = 138) included in the prospective CATNON trial, which was performed to assess the prognostic effect of adjuvant and concurrent temozolomide. We integrated the RNA-sequencing data with matched DNA-methylation and NGS data. We also used multi-omics data from IDH-mutant astrocytomas included in the TCGA dataset and validated results on matched primary and recurrent samples from the GLASS-NL study. Since discrete classes do not adequately capture grading of these tumours, we utilised DNA-methylation profiles to generate a Continuous Grading Coefficient (CGC) based on classification scores from a CNS-tumour classifier. CGC was an independent predictor of survival outperforming current WHO-CNS5 and methylation-based classification. Our RNA-sequencing analysis revealed four distinct transcription clusters that were associated with (i) upregulation of cell cycling genes; (ii) downregulation of glial differentiation genes; (iii) upregulation of embryonic development genes (e.g. HOX, PAX, and TBX) and (iv) upregulation of extracellular matrix genes. The upregulation of embryonic development genes was associated with a specific increase of CpG island methylation near these genes. Higher grade IDH-mutant astrocytomas have DNA-methylation signatures that, on the RNA level, are associated with increased cell cycling, tumour cell de-differentiation and extracellular matrix remodelling. These combined molecular signatures can serve as an objective marker for grading of IDH-mutant astrocytomas.

Keywords: Astrocytoma; DNA methylation; HOX; IDH; Molecular grading; RNA sequencing.


Conflict of interest statement

P.M. Clement reports other support from EORTC during the conduct of the study; fees (to institution) from Bayer, Merck, Leo Pharma, Rakuten Medical, Takeda, and Bristol Myers Squibb (BMS); fees and nonfinancial support from MSD; and grants from AstraZeneca outside the submitted work; also fees for occasional advice to government agencies such as FAGG/EMA, as well as being a member of CTG (substitute) in Belgium. M.J. van den Bent reports consulting for Boehringer Ingelheim, F. Hoffman-La Roche, Fore Biotherapeutics, Genenta, Incyte Corporation, AnHeart therapeutics, Mundipharma, SymBio Pharma and Servier Affaires Medicales.

Figures

Fig. 1
Fig. 1
Evaluation of the three DNAm-based CGC-based subgroups (low, medium, high) across CATNON, TCGA and GLASS-NL. a Cut-off values for the three CGC groups (low: CGC < − 4.5, medium: CGC [− 4.5, 4.5], high: CGC > 4.5) which were determined based on the association between the CNS-tumour classifier probability score (A_IDH_HG) and the CGC. b Bar plot depicting the fraction of samples within each CGC subgroup according to WHO CNS5. c Kaplan–Meier overall survival curves stratified by CGC subgroup. p values were determined by log-rank test. d Survival forest plots showing the results of Cox proportional hazard models for CGC subgroups corrected for age, sex, WHO CNS5 criteria (CDKN2A/B HD and histological features) and treatment arms according to the CATNON trial. e Unsupervised principal component 1 and 2 of DNAm data demonstrates spatial segregation of IDH-mutant astrocytomas. CNS-tumour classifier subtype assignment (A_IDH_LG/A_IDH_HG) and CGC subgroups are indicated
Fig. 2
Fig. 2
Continuous Grading Coefficient (CGC) as a tool to study malignancy in IDH-mutant astrocytoma. a Samples of individual cohorts (CATNON, TCGA, GLASS-NL) ranked according to their CGC. As can be seen, specific copy number of events (RB1 HD, PDGFRA amplification, CDK4 amplification and CDKN2A/B HD) and overall survival were correlated with the CGC. Samples are coloured based on astrocytoma subtype assignment (blue: A_IDH_LG, red: A_IDH_HG). b Unsupervised PC1 and PC2 on the DNAm data showing spatial segregation of samples classified as IDH-mutant astrocytoma. c Distribution of the CGC based on CDKN2A/B HD status across the different datasets. Samples with CDKN2A/B HD showed a significantly higher CGC. p values determined by Wilcoxon signed-rank test
Fig. 3
Fig. 3
Supervised DNAm and RNA analysis on CATNON and TCGA with validation on the GLASS-NL dataset identifies gene clusters associated with malignancy. a Distribution of probes belonging to CpG islands, shelfs (N_Shelf, S_Shelf), shores (N_Shore, N_Shelf) and the open sea across all hypomethylated and hypermethylated probes. Distributions are displayed separately for the DMPs resulting from independent analyses conducted on CATNON (850k chip) and TCGA (450k chip). Genome-wide distribution of all probes is shown on the left as a reference. p values were determined by Fisher’s Exact Test. b Correlation between the DNAm-based signature scores of the hypermethylated and hypomethylated probes with the CGC in GLASS-NL (850k chip). c Spearman correlation between CGC and unsupervised PC2 of the transcriptomic data in all datasets. d Volcano plots showing the per-gene RNA log2FoldChange on the CGC and the corresponding FDR adjusted p value for both the CATNON and TCGA datasets. C0, C1, C2, and C3 genes are indicated. e Recursive-based correlation plot on VST expression of the differentially expressed genes in CATNON. Three upregulated (C1: green, C2: yellow, C3: red) and one downregulated (C0: brown) cluster were distinguished. Gene Ontology enrichment analysis resulted in significant hits for three clusters (C1: cell cycling, C2: embryonic development, C3: ECM). f Correlation between the DGE tests on the CATNON and TCGA datasets. For each gene the log2FoldChange divided by its standard error (Wald statistics) is indicated. g Spearman correlation between the RNA-based signature scores for C0, C1, C2, and C3 and the CGC in GLASS-NL.
Fig. 4
Fig. 4
Single-nucleus RNA-sequencing (A_IDH_LG: n = 3, A_IDH_HG: n = 3) validates bulk DGE results and shows enrichment of gene clusters in select cell subpopulations. a UMAP projection illustrating cell-type annotations for all tumours combined. b Dotplot displaying the enrichment score of each of the bulk RNA-sequencing clusters (C0, C1, C2, and C3) identified in our DGR analysis. c UMAP projection showing enrichment scores of the downregulated (C0), cell cycling (C1), embryonic development (C2), and ECM (C3) clusters for A_IDH_LG and A_IDH_HG separately
Fig. 5
Fig. 5
Supervised analysis reveals co-existence of upregulated and hypermethylated embryonic development genes. a Correlation between the DMP (x-axis) and DGR (y-axis) analyses across CATNON (850k chip) and TCGA (450k chip). b Log2FoldChange of the CGC on RNA VST expression across the HOXD (chr2), HOXA (chr7) and HOXC (chr12) loci. Chromosomal positions are indicated in megabases (Mb). c Log2FoldChange of the CGC on the DNAm M-values for the HOX loci (HOXA, HOXC, and HOXD) and the surrounding regions in CATNON (850k chip) and TCGA (450k chip). d Correlation between the embryonic development RNA signature scores (C2) and the median M-value of the hypermethylated probes. CDKN2A/B HD status is indicated in red
Fig. 6
Fig. 6
Survival analysis of CATNON based on RNA and methylation signatures. a/c Kaplan–Meier overall survival curves stratified by RNA C2 signature (a) and hypermethylation phenotype (c) risk groups. b/d Survival forest plots of predictive Cox proportional hazard models on the C2 signature (b) and hypermethylation phenotype (d) corrected for age, sex, CDKN2A/B HD, treatment and histology

Update of

References

    1. Aldape K, Amin SB, Ashley DM, Barnholtz-Sloan JS, Bates AJ, Beroukhim R et al (2018) Glioma through the looking GLASS: molecular evolution of diffuse gliomas and the Glioma Longitudinal Analysis Consortium. Neuro Oncol 20:873–884. 10.1093/NEUONC/NOY020 - PMC - PubMed
    1. Aoki K, Nakamura H, Suzuki H, Matsuo K, Kataoka K, Shimamura T et al (2018) Prognostic relevance of genetic alterations in diffuse lower-grade gliomas. Neuro Oncol 20:66–77. 10.1093/NEUONC/NOX132 - PMC - PubMed
    1. Aryee MJ, Jaffe AE, Corrada-Bravo H, Ladd-Acosta C, Feinberg AP, Hansen KD et al (2014) Minfi: a flexible and comprehensive Bioconductor package for the analysis of Infinium DNA methylation microarrays. Bioinformatics 30:1363–1369. 10.1093/BIOINFORMATICS/BTU049 - PMC - PubMed
    1. Bai H, Harmanci AS, Erson-Omay EZ, Li J, Coşkun S, Simon M et al (2015) Integrated genomic characterization of IDH1-mutant glioma malignant progression. Nat Genet 481(48):59–66. 10.1038/ng.3457 - PMC - PubMed
    1. Brat DJ, Aldape K, Colman H, Figrarella-Branger D, Fuller GN, Giannini C et al (2020) cIMPACT-NOW update 5: recommended grading criteria and terminologies for IDH-mutant astrocytomas. Acta Neuropathol 139:603–608. 10.1007/s00401-020-02127-9 - PMC - PubMed

Publication types

Substances

LinkOut - more resources