. 2024 Oct 15;121(42):e2320187121.
doi: 10.1073/pnas.2320187121. Epub 2024 Oct 9.

Shade-induced ROS/NO reinforce COP1-mediated diffuse cell growth

Affiliations

Shade-induced ROS/NO reinforce COP1-mediated diffuse cell growth

María José Iglesias et al. Proc Natl Acad Sci U S A. .

Abstract

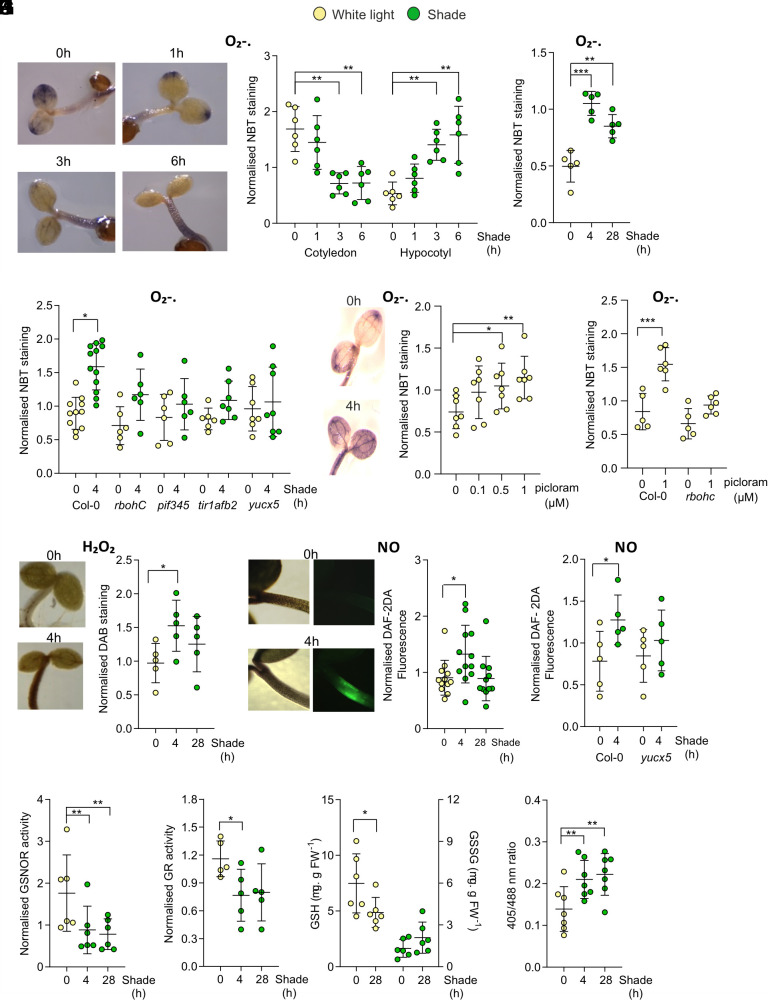
Canopy shade enhances the activity of PHYTOCHROME INTERACTING FACTORs (PIFs) to boost auxin synthesis in the cotyledons. Auxin, together with local PIFs and their positive regulator CONSTITUTIVELY PHOTOMORPHOGENIC 1 (COP1), promotes hypocotyl growth to facilitate access to light. Whether shade alters the cellular redox status thereby affecting growth responses, remains unexplored. Here, we show that, under shade, high auxin levels increased reactive oxygen species and nitric oxide accumulation in the hypocotyl of Arabidopsis. This nitroxidative environment favored the promotion of hypocotyl growth by COP1 under shade. We demonstrate that COP1 is S-nitrosylated, particularly under shade. Impairing this redox regulation enhanced COP1 degradation by the proteasome and diminished the capacity of COP1 to interact with target proteins and to promote hypocotyl growth. Disabling this regulation also generated transversal asymmetries in hypocotyl growth, indicating poor coordination among different cells, which resulted in random hypocotyl bending and predictably low ability to compete with neighbors. These findings highlight the significance of redox signaling in the control of diffuse growth during shade avoidance.

Keywords: S-nitrosylation; auxin; hypocotyl growth; redox; shade avoidance.


Conflict of interest statement

Competing interests statement:The authors declare no competing interest.

Figures

Fig. 1.
Fig. 1.
Shade reshapes the redox status of hypocotyl cells. (A and B) Time course of O2−. levels (detected by NBT staining) in response to shade in the cotyledons (A) and hypocotyl (A and B). (C) Deficient O2−. accumulation in the hypocotyl of rbohC, pif3 pif4 pif5 (pif345), tir1 afb2 and yuc3 yuc5 yuc7 yuc8 yuc9 (yucx5) mutants under shade. (D and E) Addition of Picloram enhances O2−. levels under white light (D), a response that is absent in the rbohC mutant (E). (F) Transient increase in the levels of H2O2 (measured by DAB staining) in the hypocotyl in response to shade. (G) Transient increase in the levels of NO (measured by DAF-2DA fluorescence probe) in the hypocotyls in response to shade. (H) Deficient NO accumulation of the yucx5 mutant under shade. (I and J) Shade reduces the activity of GSNOR (I) and GR (J) in the hypocotyl. (K) Shade reduces GSH without affecting GSSG in the hypocotyl. (L) Shade causes a more oxidative status (measured by the 405 nm/488 nm absorbance ratio in the roGFP2 redox sensor) in the hypocotyl. The determinations were conducted 6 h (A) or 4 h (BL) after the beginning of the fourth photoperiod. Shade treatments started 1, 3, 6 (A), 4 or 28 (BL) h earlier (as indicated in abscissas). Data are means ± SD and individual values of 4 to 12 biological replicates, which were analyzed by ANOVA followed by the Dunnet post hoc test between shade or Picloram and its corresponding light or mock control (*P < 0.05; **P < 0.01; no asterisk, not significant).
Fig. 2.
Fig. 2.
Shade-induced changes in ROS and NO favor the hypocotyl growth response to shade. (AG) Effects of the rbohC mutation (reduced O2−., A), addition of H2O2 (B), the nia mutation (reduced NO, C), addition of cPTIO (scavenger of NO, D), addition of GSNO (donor of NO, E), the cad2 and pad2 mutations (reduced GSH, F), and addition of GSH (G) on hypocotyl growth under white light or shade. (H) The phyB mutation enhances the response to GSH under white light. (I and J) The pif4 (I) and tir1 afb2 (J) mutants show reduced hypocotyl growth response to exogenous GSH under shade. Seedlings were transferred to shade 1 h after the beginning of the fourth photoperiod and hypocotyl growth rate was measured during the subsequent 9 h (A, B, D, and FJ) or just 3 h to focus on the endogenous NO peak (C and E). Data are means ± SD and individual values of 4 to 10 biological replicates, which were analyzed by ANOVA followed by the Dunnet post hoc test between each mutant and the wild-type under shade and under white light (A, C, and F) or between the pharmacological treatment and its mock control under shade and under white light for each genotype (B, D, E, and GJ; *P < 0.05; **P < 0.01; ***P < 0.0001; no asterisk, not significant).
Fig. 3.
Fig. 3.
Redox changes induced by shade favor the nuclear activity of COP1. (A and B) The negative effect of GSH (A) and the positive effect of GSNO (B) on hypocotyl growth under shade depend on COP1. (C) GSNO increases and GSH and cPTIO reduce the nuclear fluorescence of YFP-COP1 under shade. (D and E) GSH (D) and cPTIO (E) increase the nuclear fluorescence of RGA-GFP in hypocotyl cells in a COP1-dependent manner. (F and G) GSH (F) and cPTIO (G) reduce the nuclear abundance of BES1-GFP in hypocotyl cells in a COP1-dependent manner. (H) GSH has no effects on nuclear BES1-GFP in cotyledon cells. (I) cPTIO increases the nuclear fluorescence of BES1-GFP in cotyledon cells in a COP1-dependent manner. Seedlings were transferred to shade 1 h after the beginning of the fourth photoperiod. Hypocotyl growth rate was measured during the subsequent 9 h and confocal images were obtained 3 to 5 h after the beginning of shade. Data are means ± SD and individual values of 3 to 14 biological replicates, which were analyzed by ANOVA followed by the Dunnet post hoc test between the pharmacological treatment and its control under shade for each genotype (*P < 0.05; **P < 0.01; ***P < 0.0001; no asterisk, not significant). Representative images are shown in E and G and SI Appendix, Fig. S6.
Fig. 4.
Fig. 4.
COP1 is S-nitrosylated and this redox regulation enhances its stability and intrinsic ability to interact with specific partners. (A) Shade enhances the overall level of protein S-nitrosylation. (B) COP1 is S-nitrosylated in vivo (the dependence on ascorbic acid indicates the specificity of the biotin switch assays). (C) Shade enhances S-nitrosylated COP1, total COP1, and the ratio between S-nitrosylated and total COP1. (D) Shade enhances S-nitrosylated COP1 in seedlings treated with MG132 (SI Appendix, Fig. S7). (E) COP1C510A shows reduced S-nitrosylation compared to COP1 in plant extracts harvested 4 h after the beginning of shade and incubated with GSNO 1 h in darkness in vitro. (F) The NO donor GSNO increases COP1 abundance in vivo. (G) COP1C510A has reduced abundance in planta (0 h) and reduced stability in plant extract incubated 3 h in vitro (see percent decrease during incubation next to the arrows). Each datum point corresponds to an independent transgenic line. (H) Inhibition of proteasome activity by MG132 eliminates the defect in protein abundance of COP1C510A. (I and J) GSNO increases COP1 stability in plant extract incubated in vitro and cPTIO or DTT reverses this effect (I), which is absent for COP1C510A (J). (K and L) Effects of cPTIO on DsRED-COP1-HA and DsRED-COP1C510A-HA nuclear fluorescence (K) and nuclear body formation (L) in N. benthamiana cells. (M) Reduced interaction between COP1C510A and RGA in Arabidopsis protoplasts (the dotted lines represent positive and negative controls). (N) The UV-B-induced interaction with UVR8 is similar for COP1 and COP1C510A (the highest averages correspond to samples exposed to UV-B while the lowest remained in darkness). The transgenic lines expressing COP1 were p35S:TAP-COP1 (B), 35S:myc-COP1 (C and EJ), and p-COP1:mCHERRY-COP1 (C and D). Data are means ± SD and individual values of 4 to 8 biological replicates analyzed by Student’s t tests (A, E, F, L, and M) or at least nine nuclei analyzed by ANOVA followed by the Dunnet post hoc test between COP1 and COP1C510A (JL; *P < 0.05; **P < 0.01; ***P < 0.001).
Fig. 5.
Fig. 5.
COP1C510A shows impaired biological activity. (A) Co-expression of COP1 reduces the nuclear fluorescence of its target YFP-BES1 compared to COP1C510A in N. benthamiana cells. (B and C) Reduced hypocotyl growth under shade caused by COP1C510A compared to COP1 expressed in the cop1 background. Hypocotyl length in independent T1 lines (B) and hypocotyl growth rate in independent homozygous lines (L1, L2, C). (D) Dominant negative phenotype of COP1C510A expressed in the wild-type Col-0 background under shade (L1, L2, independent lines). In C and D, seedlings were transferred to shade 1 h after the beginning of the fourth photoperiod and hypocotyl growth rate was measured during the subsequent 9 h. Data are means ± SD and individual values of 10 nuclei (A), 6 to 10 independent transgenic lines (B), or five-six biological replicate samples (C and D), which were analyzed by Student’s t tests (A and B) or ANOVA followed by the Dunnet post hoc test (C and D; **P < 0.01; ***P < 0.0001; no asterisk, not significant).
Fig. 6.
Fig. 6.
The redox regulation reduces local growth asymmetries. Enhanced random bending of the hypocotyl of the rbohC mutant compared to Col-0 (A), of the transgenics expressing COP1C510A compared to COP1 in the Col-0 background (B) and of the transgenics expressing COP1C510A compared to COP1 in the cop1 background (C). The seedlings were exposed to asymmetric shade (red light from one side and far-red light from the other). Data are means ± SD and individual values of 100 seedlings. Asterisks indicate the significance of the differences between the variances in Snedecor and Cochran tests (**P < 0.01; ***P < 0.0001).

References

    1. Pham V. N., Kathare P. K., Huq E., Phytochromes and phytochrome interacting factors. Plant Physiol. 176, 1025–1038 (2018). - PMC - PubMed
    1. Ponnu J., Hoecker U., Illuminating the COP1/SPA ubiquitin ligase: Fresh insights into its structure and functions during plant photomorphogenesis. Front. Plant Sci. 12, 1–19 (2021). - PMC - PubMed
    1. Hornitschek P., Lorrain S., Zoete V., Michielin O., Fankhauser C., Inhibition of the shade avoidance response by formation of non-DNA binding bHLH heterodimers. EMBO J. 28, 3893–3902 (2009). - PMC - PubMed
    1. Paulišić S., et al. , Adjustment of the PIF7-HFR1 transcriptional module activity controls plant shade adaptation. EMBO J. 40, e104273 (2021). - PMC - PubMed
    1. De Lucas M., et al. , A molecular framework for light and gibberellin control of cell elongation. Nature 451, 480–484 (2008). - PubMed

MeSH terms

LinkOut - more resources