. 2024 Oct 15;121(42):e2404058121.
doi: 10.1073/pnas.2404058121. Epub 2024 Oct 9.

Histone modifications of circulating nucleosomes are associated with changes in cell-free DNA fragmentation patterns

Affiliations

Histone modifications of circulating nucleosomes are associated with changes in cell-free DNA fragmentation patterns

Jinyue Bai et al. Proc Natl Acad Sci U S A. .

Abstract

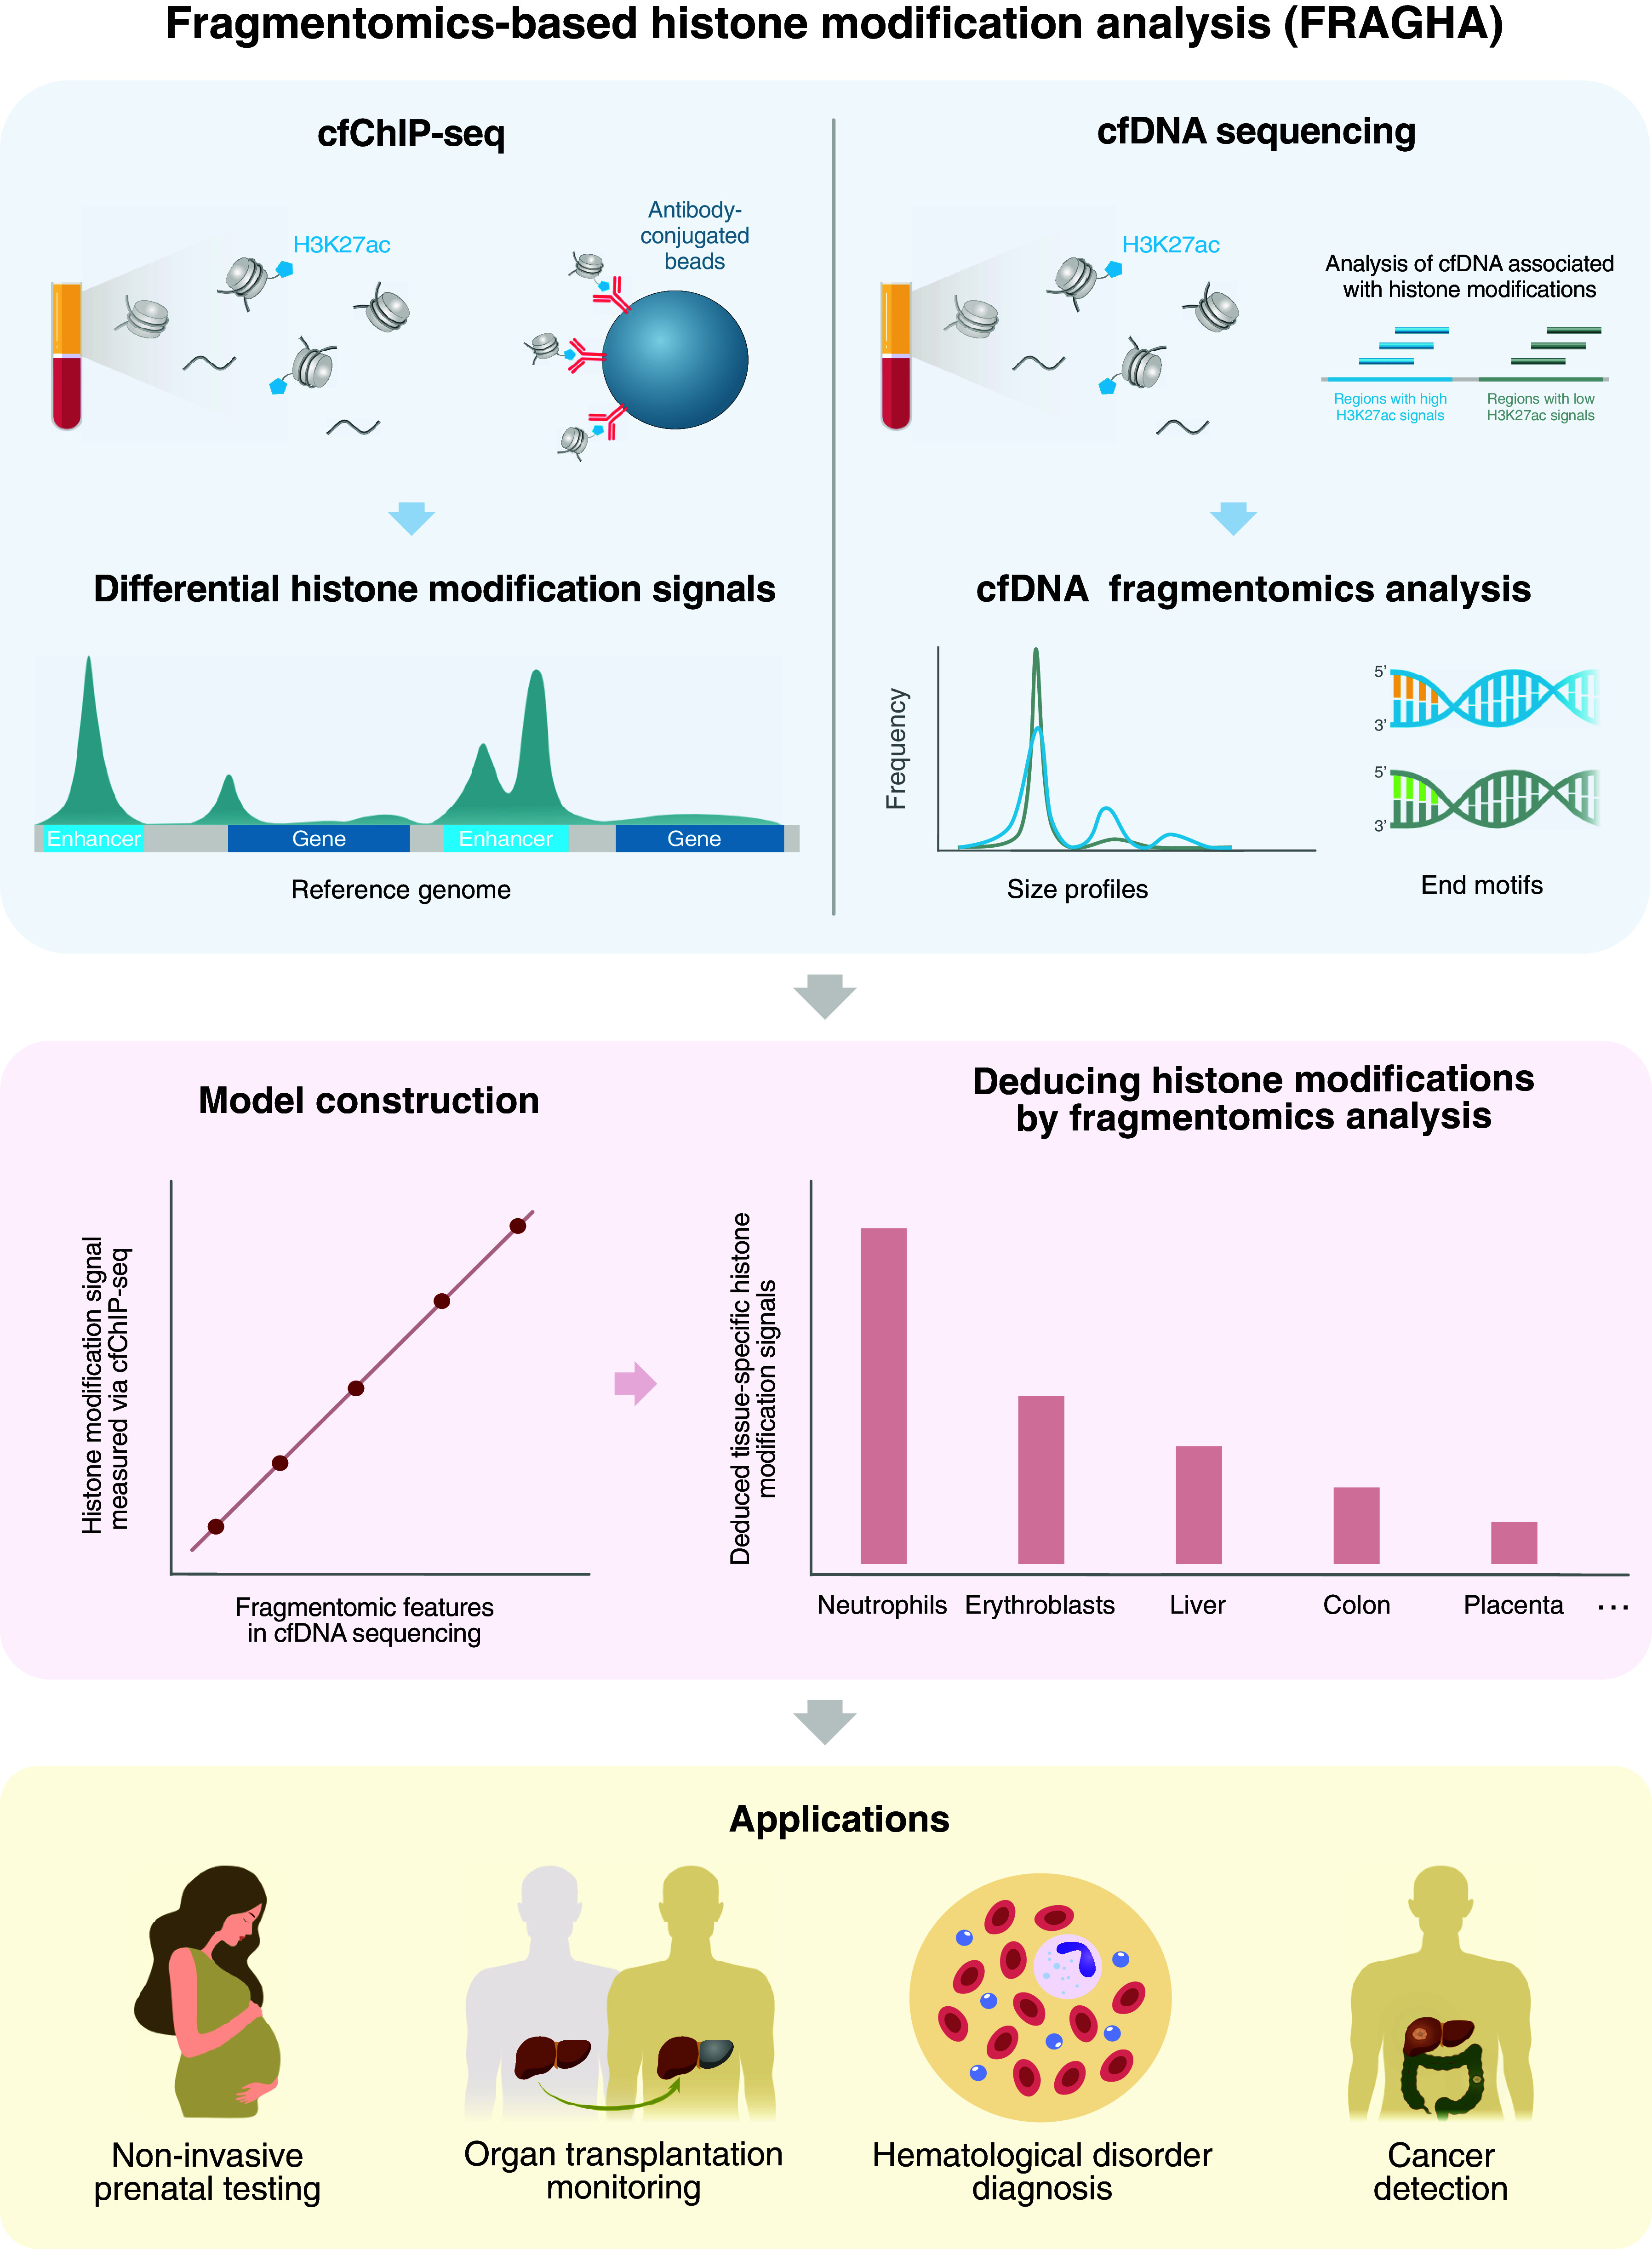
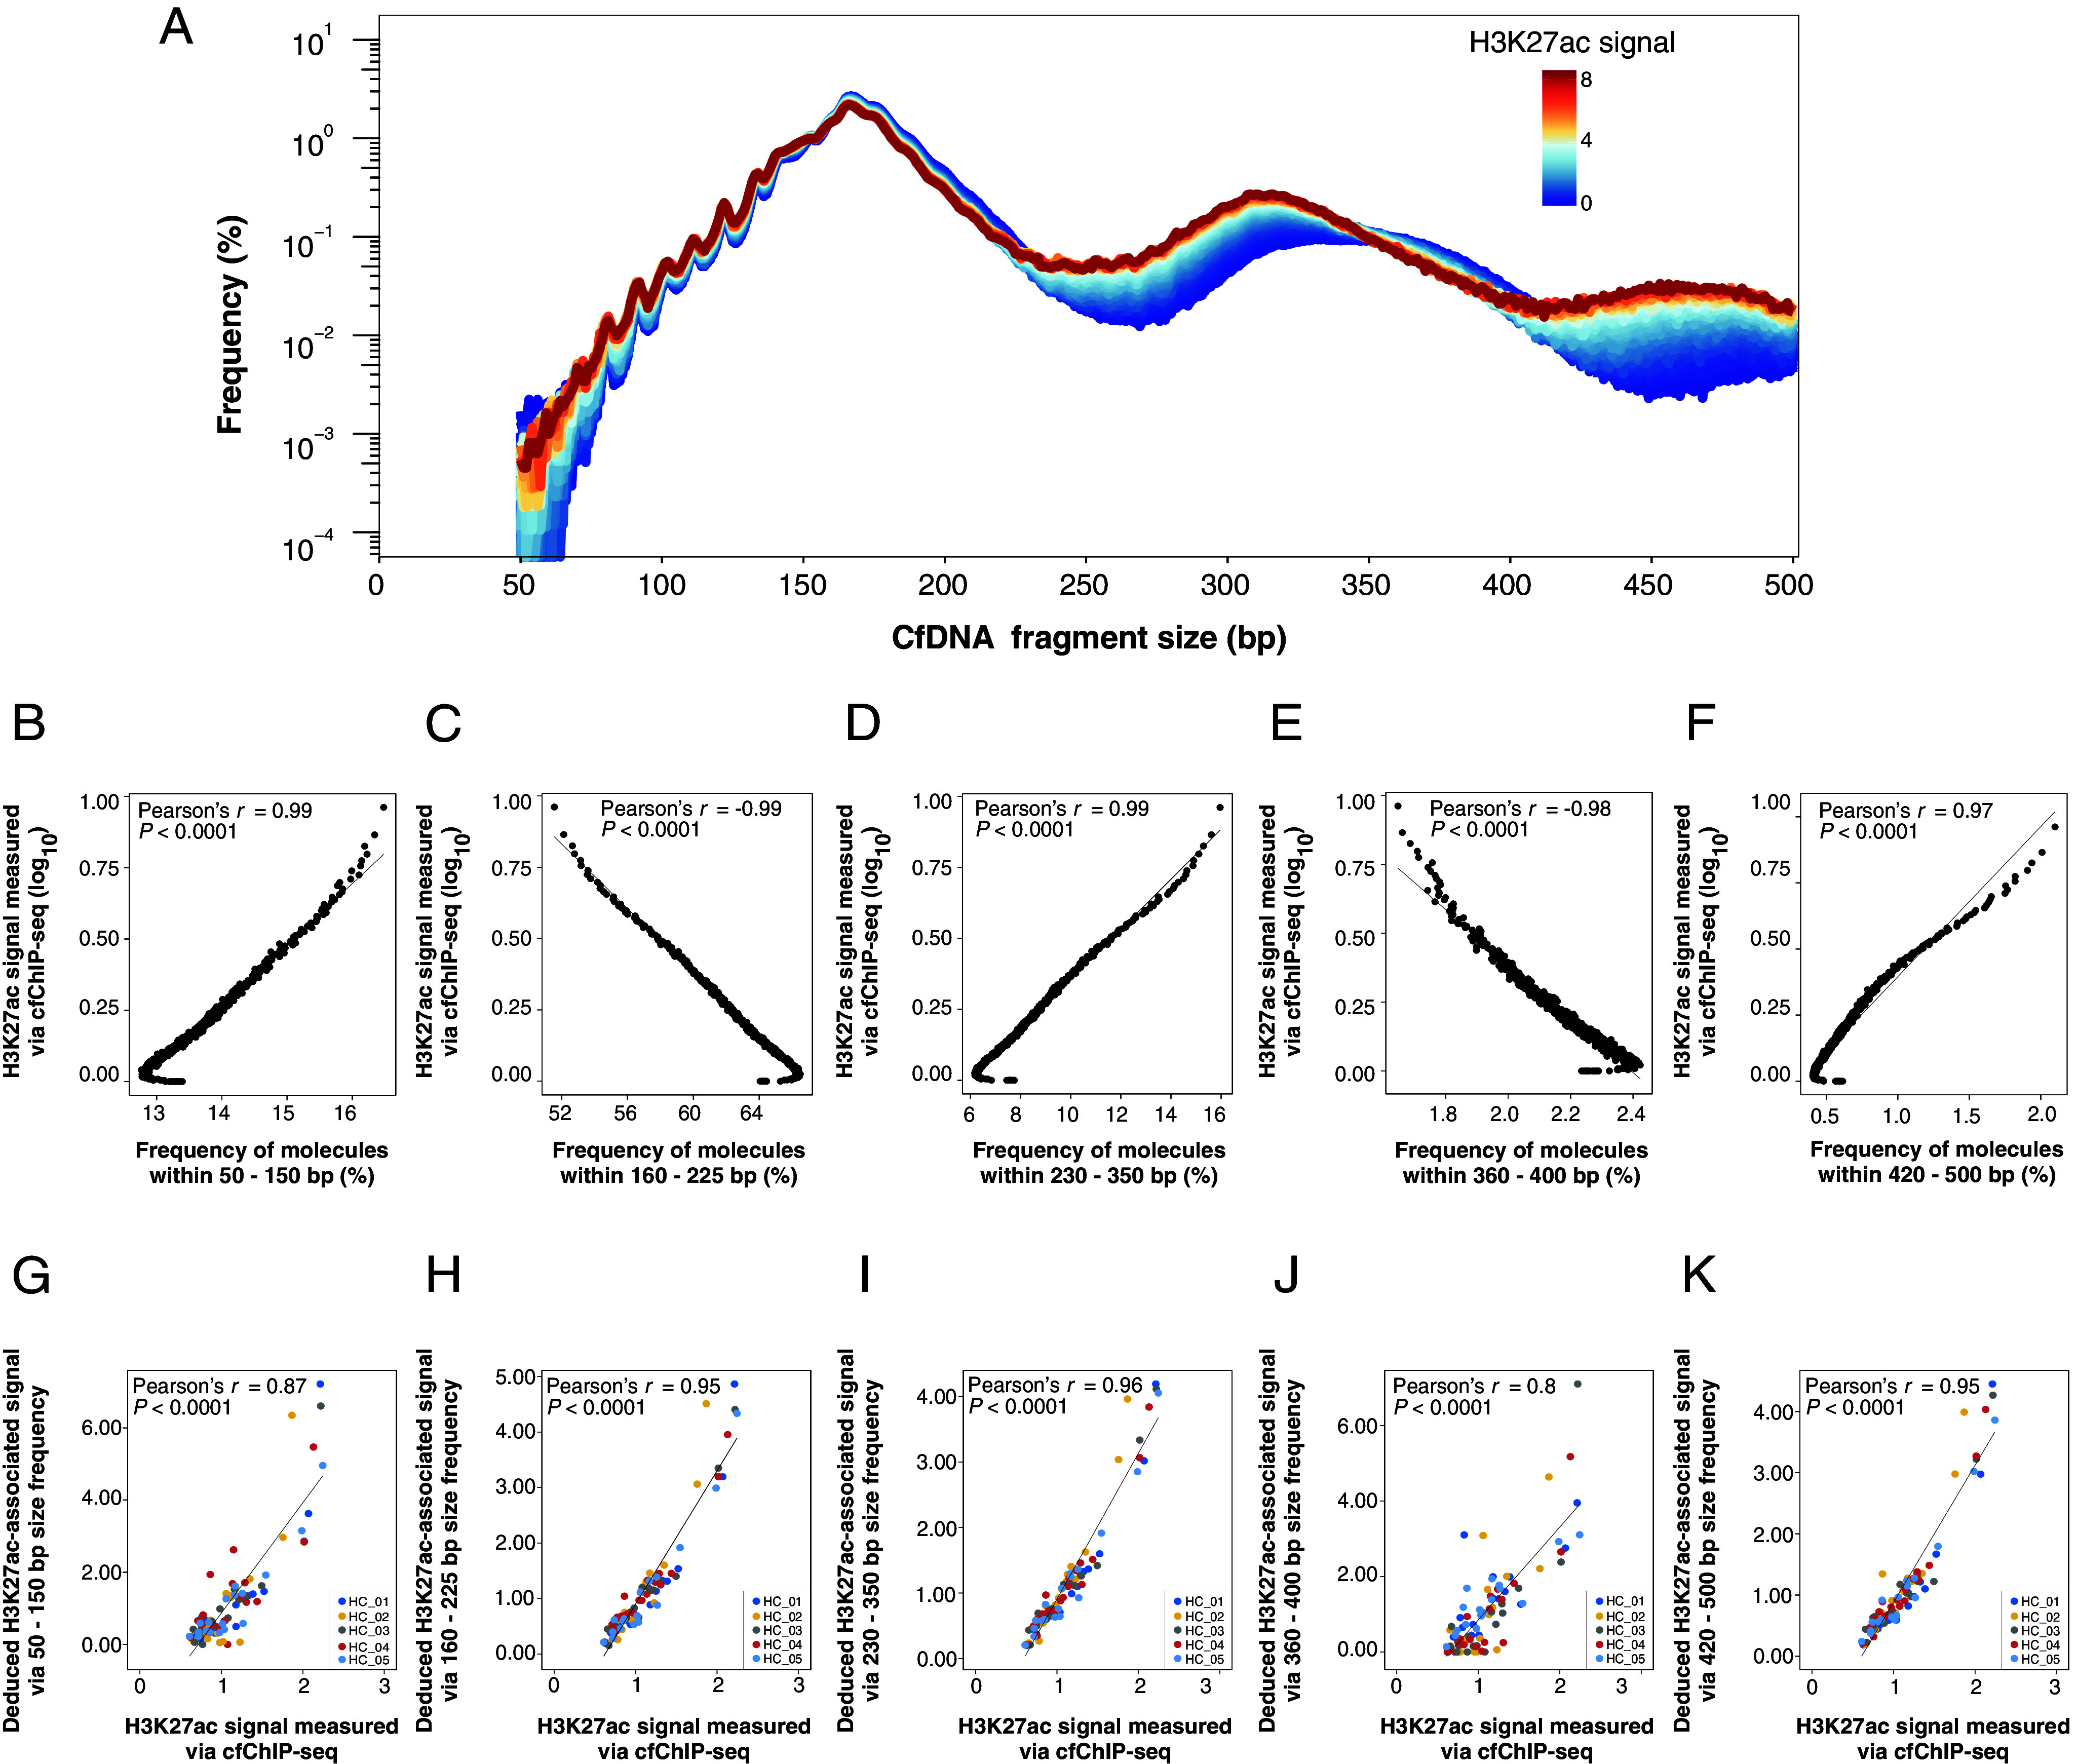
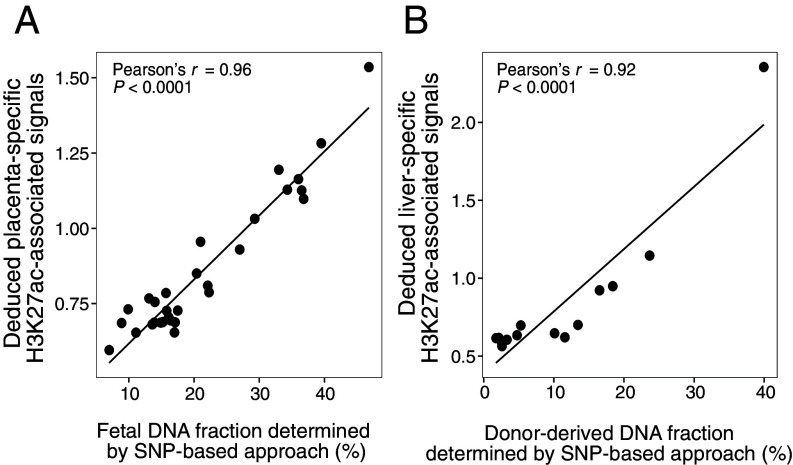
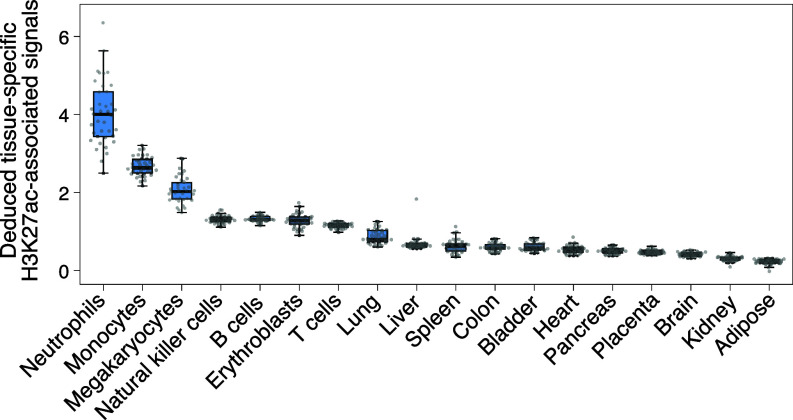
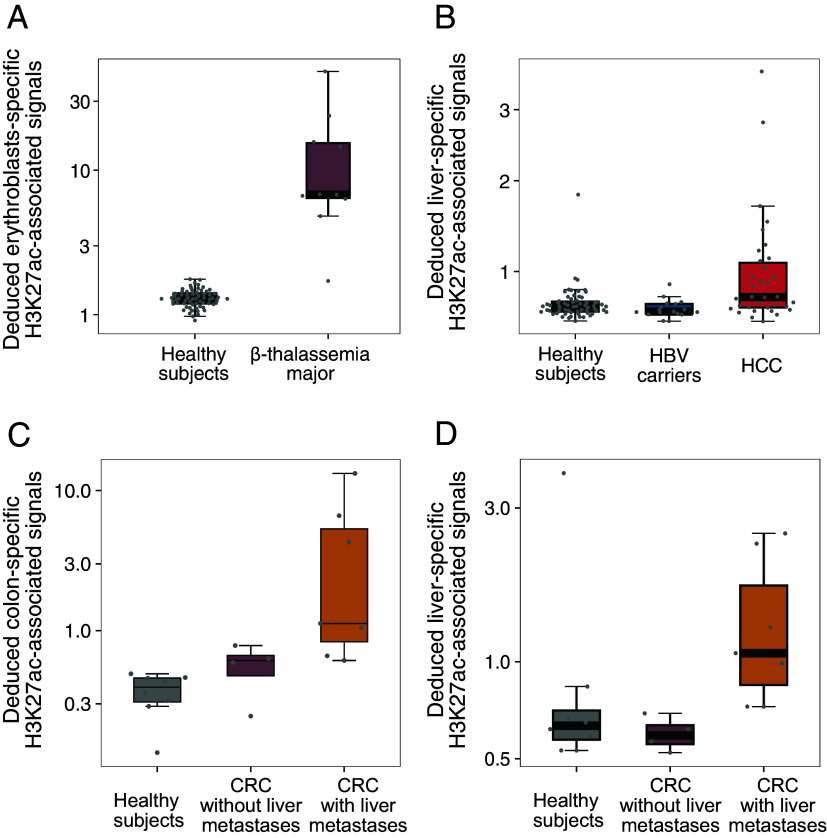
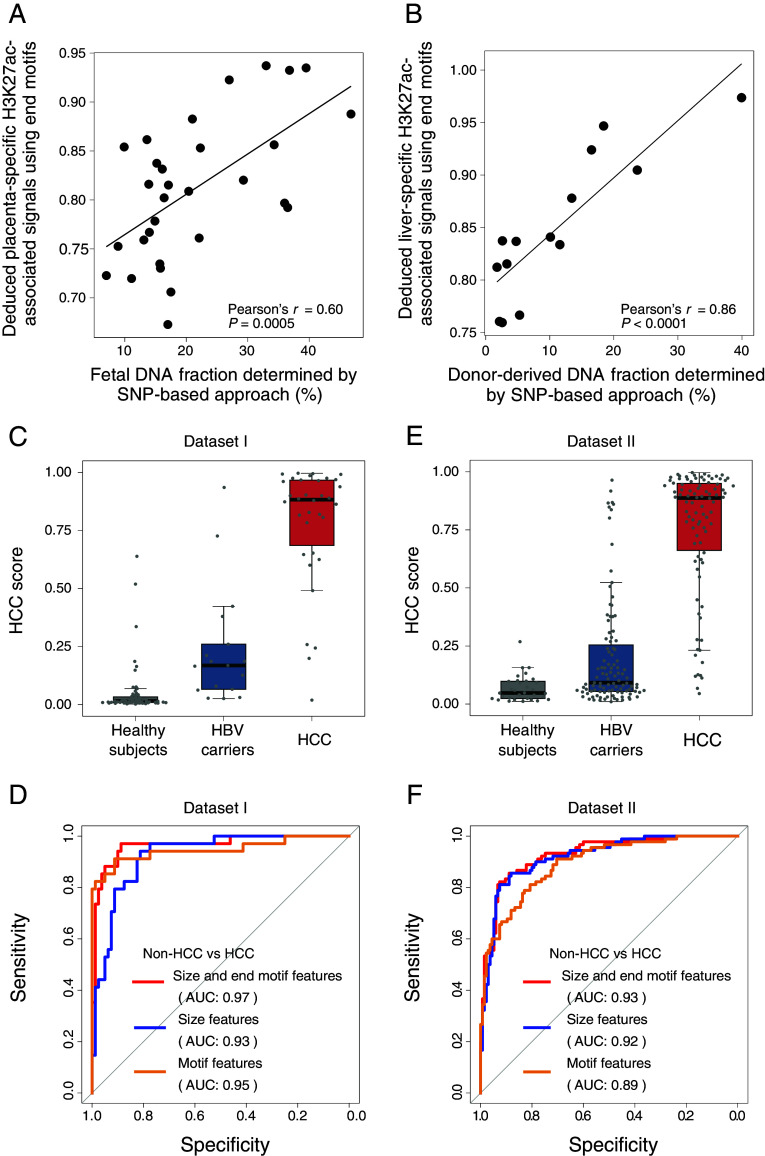
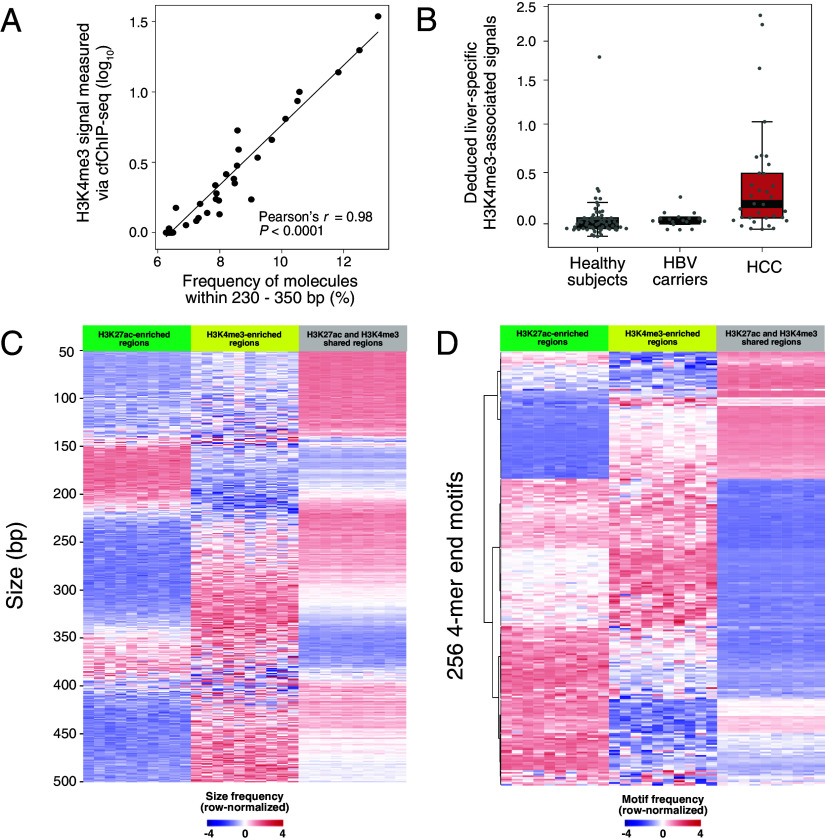
The analysis of tissues of origin of cell-free DNA (cfDNA) is of research and diagnostic interest. Many studies focused on bisulfite treatment or immunoprecipitation protocols to assess the tissues of origin of cfDNA. DNA loss often occurs during such processes. Fragmentomics of cfDNA molecules has uncovered a wealth of information related to tissues of origin of cfDNA. There is still much room for the development of tools for assessing contributions from various tissues into plasma using fragmentomic features. Hence, we developed an approach to analyze the relative contributions of DNA from different tissues into plasma, by identifying characteristic fragmentation patterns associated with selected histone modifications. We named this technique as FRAGmentomics-based Histone modification Analysis (FRAGHA). Deduced placenta-specific histone H3 lysine 27 acetylation (H3K27ac)-associated signal correlated well with the fetal DNA fraction in maternal plasma (Pearson's r = 0.96). The deduced liver-specific H3K27ac-associated signal correlated with the donor-derived DNA fraction in liver transplantation recipients (Pearson's r = 0.92) and was significantly increased in patients with hepatocellular carcinoma (HCC) (P < 0.01, Wilcoxon rank-sum test). Significant elevations of erythroblasts-specific and colon-specific H3K27ac-associated signals were observed in patients with β-thalassemia major and colorectal cancer, respectively. Furthermore, using the fragmentation patterns from tissue-specific H3K27ac regions, a machine learning algorithm was developed to enhance HCC detection, with an area under the curve (AUC) of up to 0.97. Finally, genomic regions with H3K27ac or histone H3 lysine 4 trimethylation (H3K4me3) were found to exhibit different fragmentomic patterns of cfDNA. This study has shed light on the relationship between cfDNA fragmentomics and histone modifications, thus expanding the armamentarium of liquid biopsy.

Keywords: epigenetics; fragmentomics; histone modifications; liquid biopsy.


Conflict of interest statement

Competing interests statement:J.B., P.J., L.J., M.Y., K.C.A.C., and Y.M.D.L. filed patent applications based on the data in this study. Reviewer S.B. is an inventor on patents related to cfDNA mutation and methylation analysis technologies that have been licensed to Roche and Adela, respectively, and is a co-founder and has ownership in Adela.

Figures

Fig. 1.
Fig. 1.
Schematic illustration for FRAGHA. The Top-Left panel illustrates the principle of chromatin immunoprecipitation of cf-nucleosomes carrying chromatin modifications followed by sequencing (cfChIP-seq). Double-stranded cfDNA molecules are wrapped around histone proteins to form circulating cf-nucleosomes. One common histone modification is the acetylation of lysine 27 on the histone H3 protein subunit (H3K27ac) as indicated by the blue pentagons. The cf-nucleosomes carrying H3K27ac can be captured by the corresponding antibodies covalently immobilized to paramagnetic beads. CfDNA isolated from those beads are subjected to massively parallel sequencing. After aligning the sequenced reads to the human reference genome, the read density of a given genomic region can be determined (e.g., peaks in the enhancers). The read density can be used to reflect the amount of a particular histone modification present in the sample. The Top-Right panel illustrates cfDNA sequencing without chromatin immunoprecipitation. We analyze cfDNA molecules originating from regions with differential H3K27ac signals, deciphering the fragmentomic features, including size profiles and end motifs, associated with histone modifications. Afterward, to construct the linear regression model, the fragmentomic features in the cfDNA sequencing results without immunoprecipitation are compared with the reference results generated by chromatin immunoprecipitation. Such a regression model is used to deduce histone modification signals in a test plasma sample. The deduced histone modification signals can inform the tissues of origin of cfDNA. This method could enable noninvasive prenatal testing, organ transplantation monitoring, hematological disease diagnosis, and cancer detection.
Fig. 2.
Fig. 2.
Correlation between cfDNA fragment size patterns and H3K27ac signals of circulating nucleosomes measured by cfChIP-seq using paired samples. (A) The plot of fragment size profiles of cfDNA molecules originating from region categories (n = 549) with differential H3K27ac signal levels. Size curves are highlighted by different colors depending on H3K27ac signal levels. The dark blue and red indicate the lowest and highest H3K27ac levels, respectively. CfDNA molecules were from the pooled sequenced cfDNA molecules of 18 healthy subjects. (BF) Correlation between the percentages of cfDNA molecules within a particular size range across those 549 region categories with differential H3K27ac signal levels and the log-transformed H3K27ac signals determined by cfChIP-seq of H3K27ac. The size ranges included 50 to 150 bp (B), 160 to 225 bp (C), 230 to 350 bp (D), 360 to 400 bp (E), and 420 to 500 bp (F). (GK) Correlation of the H3K27ac signals in 18 types of tissue-specific regions deduced by the fragment sizes and cfChIP-seq for another five healthy control subjects.
Fig. 3.
Fig. 3.
The deduced tissue-specific H3K27ac-associated signals are reflective of the tissue DNA contributions in plasma in pregnancy and liver transplantation models. (A) Correlation of placenta-specific H3K27ac-associated signals and fetal DNA fractions for 30 pregnant women. (B) Correlation of liver-specific H3K27ac-associated signals and donor-derived DNA fractions for 14 liver transplant recipients.
Fig. 4.
Fig. 4.
Distribution of the deduced H3K27ac-associated signals using the fragment sizes from tissue-specific histone modification regions. The sequenced cfDNA molecules were obtained from 38 healthy controls. The H3K27ac-associated signals were deduced using the size frequency of molecules within a range of 230 to 350 bp.
Fig. 5.
Fig. 5.
Clinical applications of the deduced H3K27ac-associated signals by cfDNA fragmentation patterns. (A) The deduced H3K27ac-associated signals in erythroblasts-specific regions for healthy subjects (n = 63) and patients with β-thalassemia major (n = 10). (B) The deduced H3K27ac-associated signals in liver-specific regions for healthy subjects (n = 63), HBV carriers (n = 17), and HCC patients (n = 34). (C and D) The deduced H3K27ac-associated signals in colon-specific and liver-specific regions for healthy subjects (n = 8), CRC patients with (n = 4) and without liver metastases (n = 7).
Fig. 6.
Fig. 6.
The analysis of H3K27ac-associated signals by cfDNA end motif profiling. (A) The deduced H3K27ac-associated signals by the frequency of seven informative end motifs in placenta-specific regions for 30 pregnant women. (B) The deduced H3K27ac-associated signals by the frequency of seven informative end motifs in liver-specific regions for 14 liver transplant recipients. (C) Comparison of HCC probability determined by the combined analysis of fragment sizes and end motifs in tissue-specific H3K27ac modification regions for Dataset I. The fragmentomic features include each frequency within 230 to 350 bp size (no. of feature: 121) and the seven informative 4-mer end motifs for those fragments associated with the liver-specific, neutrophils-specific, monocytes-specific, and megakaryocytes-specific H3K27ac regions (no. of region types: 4), resulting to the total number of predictive features of 512 [(121 + 7) × 4 = 512)]. 63 healthy subjects, 17 HBV carriers, and 34 patients with HCC were included. (D) ROC analysis for differentiating patients with and without HCC using different fragmentomic features associated with H3K27ac for Dataset I. (E) Comparison of HCC probability determined by the combined analysis of fragment sizes and end motifs in tissue-specific H3K27ac modification regions for Dataset II. 32 healthy subjects, 103 HBV carriers, and 90 patients with HCC were included. (F) ROC analysis for differentiating patients with and without HCC using different fragmentomic features associated with H3K27ac for Dataset II.
Fig. 7.
Fig. 7.
The analysis of H3K4me3 modification by cfDNA fragmentation patterns. (A) Correlation between the percentage of cfDNA molecules within 230 to 350 bp and the log-transformed H3K4me3 signal determined by cfChIP-seq of H3K4me3. The sequenced cfDNA molecules were obtained from the pooled sequenced results of 38 healthy subjects in a previously published study. (B) The deduced H3K4me3-associated signals in liver-specific regions for healthy subjects (n = 63), HBV carriers (n = 17), and HCC patients (n = 34). (C) Heatmap of cfDNA fragment size profiles across regions enriching H3K27ac or H3K4me3 or comodifications based on the pooled sequenced cfDNA molecules of 38 healthy subjects. The region enriched for one histone modification of interest is defined by the requirement that the histone modification peak is present in multiple tissue types (i.e., ≥6) being analyzed. To ensure an adequate number of sequence reads for analyzing fragmentation patterns, we randomly grouped histone modification regions into 10 subgroups for each type of histone modification. The fragment size distribution was determined for each subgroup. Each row in the heatmap corresponds to a particular size frequency, while each column represents plasma DNA from each subgroup. For a better visualization, the row-wise normalization (z-score) was applied to the size frequencies. (D) Heatmap of cfDNA fragment end motif patterns across regions enriching H3K27ac or H3K4me3 or comodifications based on the pooled sequenced cfDNA molecules of 38 healthy subjects. Similarly, we randomly grouped histone modification regions into 10 subgroups for end motif analysis. Each row in the heatmap corresponds to a particular end motif, while each column represents plasma DNA from each subgroup. For a better visualization, the row-wise normalization (z-score) was applied to the end motif frequencies. Hierarchical clustering was applied to the end motifs.

References

    1. Lo Y. M. D., Han D. S. C., Jiang P., Chiu R. W. K., Epigenetics, fragmentomics, and topology of cell-free DNA in liquid biopsies. Science 372, eaaw3616 (2021). - PubMed
    1. Rostami A., et al. , Senescence, necrosis, and apoptosis govern circulating cell-free DNA release kinetics. Cell Rep. 31, 107830 (2020). - PubMed
    1. Kustanovich A., Schwartz R., Peretz T., Grinshpun A., Life and death of circulating cell-free DNA. Cancer Biol. Ther. 20, 1057–1067 (2019). - PMC - PubMed
    1. Lo Y. M., et al. , Maternal plasma DNA sequencing reveals the genome-wide genetic and mutational profile of the fetus. Sci. Transl. Med. 2, 61ra91 (2010). - PubMed
    1. Jiang P., et al. , Lengthening and shortening of plasma DNA in hepatocellular carcinoma patients. Proc. Natl. Acad. Sci. U.S.A. 112, E1317–E1325 (2015). - PMC - PubMed

LinkOut - more resources