. 2024 Oct 22;43(10):114833.
doi: 10.1016/j.celrep.2024.114833. Epub 2024 Oct 8.

SIV-specific antibodies protect against inflammasome-driven encephalitis in untreated macaques

Affiliations

SIV-specific antibodies protect against inflammasome-driven encephalitis in untreated macaques

Natalie J Castell et al. Cell Rep. .

Abstract

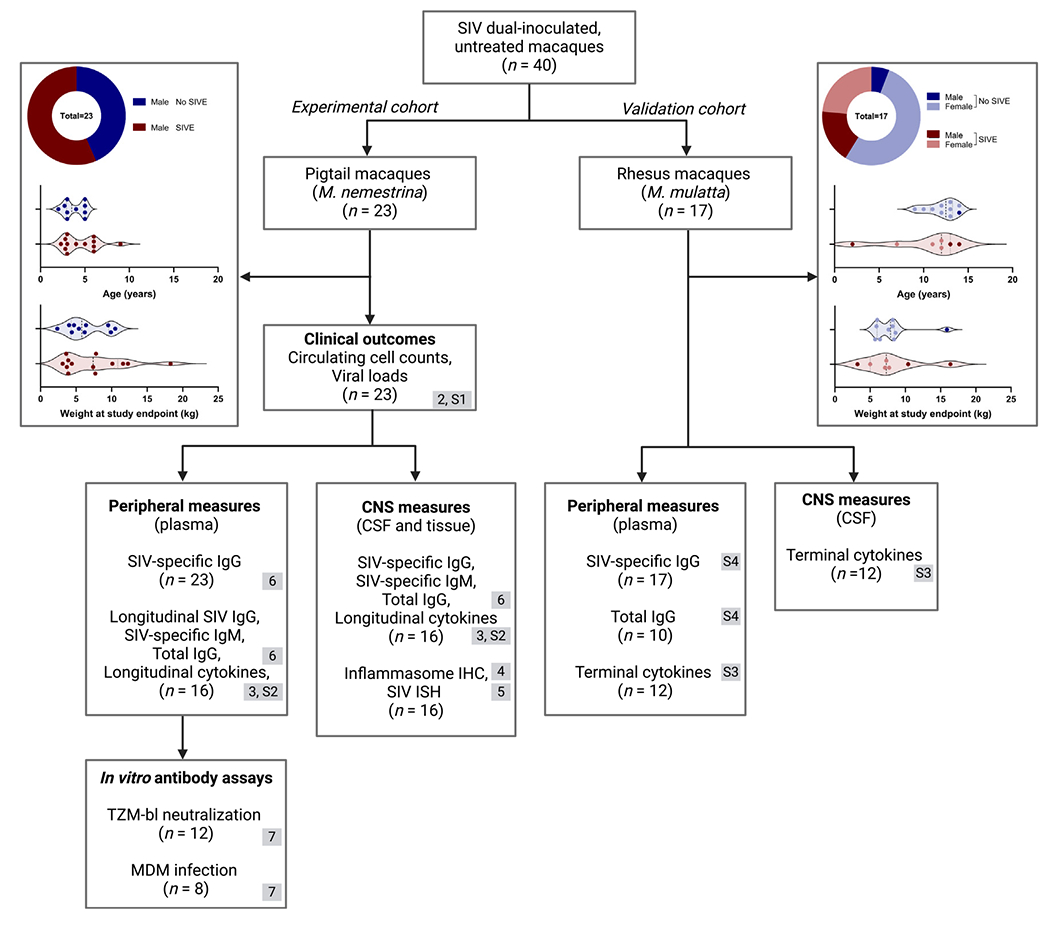
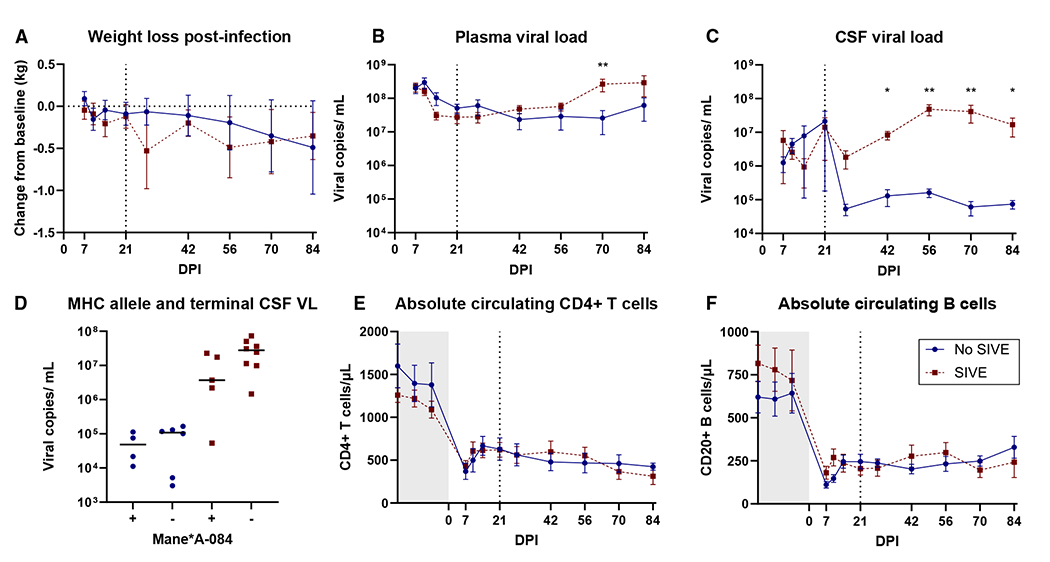
Viral encephalitis is a growing public health threat with limited diagnostic and treatment options. Simian immunodeficiency virus (SIV)-infected macaques are an established model for human immunodeficiency virus (HIV), and approximately 60% of untreated pigtail macaques rapidly progress to characteristic SIV encephalitis (SIVE). The immune responses of SIV-infected macaques are investigated in plasma, cerebrospinal fluid (CSF), and brain tissue to determine correlates with SIVE pathology. Macaques with SIVE show myeloid-dominant brain lesions with inflammasome activation in infected and bystander cells, as assessed by interleukin (IL)-1β, IL-18, and apoptosis-associated speck-like protein containing a caspase activation and recruitment domain (ASC), and elevations in monocyte chemoattractant protein (MCP)-1, macrophage inflammatory protein (MIP)-1α, and tumor necrosis factor alpha (TNF-α). SIV-specific immunoglobulin (Ig)G in plasma and CSF is predictive of SIVE as early as 21 days post-inoculation; animals with SIVE continue to show negligible seroconversion 3 months after infection. This dichotomy in immune responses, wherein some macaques fail to initiate robust IgG responses and subsequently develop SIVE, provides insight into the pathogenesis and heterogeneous outcomes in viral encephalitis.

Keywords: ASC; CP: Immunology; IL-18; IL-1β; IgG; inflammasome; seroconversion; simian immunodeficiency virus; viral encephalitis.


Conflict of interest statement

Declaration of interests The authors declare no competing interests.

Figures

Figure 1.
Figure 1.. Cohort characteristics
Demographics and available immunologic outcomes of historical cohorts (n = 40) of SIV-inoculated (SIVdeltaB670 and SIV/17E-Fr), untreated rhesus and pigtail macaques grouped by clinical outcome (no SIVE or SIVE). Measures are grouped by peripheral vs. CNS compartment, with the sample size for each indicated. Gray boxes indicate the figure number(s) where data are presented. Created with BioRender.com.
Figure 2.
Figure 2.. Macaques with SIVE have higher CSF viral loads compared to those without SIVE (n = 23)
(A) No differences between experimental cohort groups were found in post-infection weight loss (n = 16). (B) Plasma viral loads were different only at 70 days post-infection. (C) CSF viral load consistently distinguished groups starting 42 days post-infection. (D) CSF viral loads separated by Mane-A1*084:01:01 allele. (E and F) Circulating CD4+ T cell (E) and B cell (F) counts did not distinguish between groups over the course of infection. Gray box indicates pre-infection measures, and the line at 21 DPI indicates when CNS outcome groups became distinguishable. All comparisons between outcome groups were assessed by Mann-Whitney using Holm-šídák correction for multiple comparisons; points depict mean values with the standard error of the mean (SEM). *p < 0.05 and **p < 0.01. See also Figure S1.
Figure 3.
Figure 3.. Global cytokine elevations are present in CSF in encephalitis (n = 16)
(A and B) Experimental cohort terminal CSF cytokines (A) and terminal CSF:plasma ratios (B) were measured for ten cytokines. Bars indicate group median, and black symbols represent values below the lower limit of detection (LLOD). (C–G) Longitudinal plasma and CSF levels are shown for IL-18 (C), IL-1β (D), MCP-1 (E), MIP-1α (F), and TNF-α (G). Points depict geometric mean with 95% confidence interval, and gray line indicates the LLOD. Differences between CNS outcome groups were assessed by Mann-Whitney using Holm-šídák correction for multiple comparisons. *p < 0.05, **p < 0.01, and ***p < 0.001. See also Figures S2 and S3.
Figure 4.
Figure 4.. Inflammasome proteins are associated with myeloid cells in the brain parenchyma of macaques with SIVE (n = 16)
(A–D) Images show white matter at 4× (left) and 10× (right) from experimental cohort basal ganglia without (top) and with (bottom) SIVE stained against Iba-1 (A), IL-1β (B), IL-18 (C), and ASC (D) with DAB. Inset images and arrows indicate multinucleate giant cells. (E and F) Quantified IL-18 (E) and ASC (F) signals over total slide area were different between outcome groups by Mann-Whitney U (IL-18 p = 0.0047, ASC p < 0.001). (G) ASC correlated with CSF IL-18 using linear regression (R2 = 0.9631, slope ≠ 0 p < 0.0001).
Figure 5.
Figure 5.. SIV RNA co-localizes with inflammasome proteins but is largely excluded from the brain parenchyma of macaques without encephalitis.
(A–D) Images show 4× (left) and 10× (right) ISH for SIV RNA (red) from experimental cohort basal ganglia without (top) and with (bottom) SIVE stained against IL-18 (A and B) and ASC (C and D) with DAB. Arrows indicate multinucleate giant cells. (E) Basal ganglia SIV RNA was different between outcomes by Mann-Whitney; ***p < 0.001. (F) SIV RNA in CSF and basal ganglia was correlated using Spearman’s rank (r = 0.7811, p = 0.0009).
Figure 6.
Figure 6.. SIV-specific IgG responses define CNS outcomes of SIV-infected macaques, likely derived from the periphery, and differentiate groups early in infection
(A and B) Experimental cohort plasma SIV-specific IgG (A, n = 23) and IgM (B, n = 14) titration curves were graphed using nonlinear regression to generate sigmoidal (4PL) curves; the extra sum-of-squares F test rejected the null that one curve would fit both CNS outcomes (p < 0.0001). (C) Total IgG was similar between groups using Mann-Whitney (gray area indicates estimated reference range for normal macaque plasma IgG). (D and E) CSF SIV-specific IgG (D, n = 16) and IgM (E) titration curves were graphed with the same method; the null that one curve would fit both datasets was rejected (p < 0.0001) for IgG only. Points depict mean values with SEM. (F) Total IgGs in CSF were similar between outcome groups using Mann-Whitney. (G) SIV-specific IgG titers were correlated between the plasma and CSF using linear regression (R2 = 0.8944, slope ≠ 0 p < 0.001). (H) The ratios of SIV-specific IgG to total IgG were similar between compartments within outcome groups. (I) Plasma SIV-specific IgG titer was measured over the course of acute infection in untreated pigtail macaques. Differences between CNS outcome groups were assessed by Mann-Whitney using Holm-šídák correction for multiple comparisons. *p < 0.05, **p < 0.01, and ***p < 0.001. See also Figure S4.
Figure 7.
Figure 7.. SIV-specific antibodies may protect the CNS by preventing CNS macrophage infection
(A) The in vitro neutralization capacity (n = 12) of plasma showed CNS outcome accounted for the largest portion of variation using a two-way ANOVA (p < 0.0001). Multiple comparisons were performed using Dunnett’s correction; differences from IgG control are designated with red asterisks for the encephalitis group and blue asterisks for no encephalitis. (B) Plasma immunoglobulin was used to inhibit infection in pigtail MDMs (n = 8). Analysis was performed as above; DPI × CNS outcome and CNS outcome collectively accounted for the largest portion of variation (p = 0.0009 and 0.0192, respectively). Points depict mean values with SEM. *p < 0.05, **p < 0.01, and ***p < 0.001. See also Figure S5.

References

    1. Wang H, Zhao S, Wang S, Zheng Y,Wang S, Chen H, Pang J, Ma J, Yang X, and Chen Y (2022). Global magnitude of encephalitis burden and its evolving pattern over the past 30 years. J. Infect 84, 777–787. 10.1016/j.jinf.2022.04.026. - DOI - PubMed
    1. Hansen MA, Samannodi MS, and Hasbun R (2020). Predicting inpatient mortality among encephalitis patients: A novel admission risk score. Open Forum Infect. Dis 7, ofaa471. 10.1093/ofid/ofaa471. - DOI - PMC - PubMed
    1. Granerod J, Huang Y, Davies NWS, Sequeira PC, Mwapasa V, Rupali P, Michael BD, Solomon T, and Easton A (2023). Global landscape of encephalitis: key priorities to reduce future disease burden. Clin. Infect. Dis 77, 1552–1560. 10.1093/cid/ciad417. - DOI - PMC - PubMed
    1. Tunkel AR, Glaser CA, Bloch KC, Sejvar JJ, Marra CM, Roos KL, Hartman BJ, Kaplan SL, Scheld WM, and Whitley RJ; Infectious Diseases Society of America (2008). The management of encephalitis: clinical practice guidelines by the Infectious Diseases Society of America. Clin. Infect. Dis 47, 303–327. 10.1086/589747. - DOI - PubMed
    1. Aksamit AJ (2021). Treatment of viral encephalitis. Neurol. Clin 39, 197–207. 10.1016/j.ncl.2020.09.011. - DOI - PubMed

Publication types

MeSH terms

LinkOut - more resources