. 2024 Oct 9:13:RP94833.
doi: 10.7554/eLife.94833.

Robust estimation of cancer and immune cell-type proportions from bulk tumor ATAC-Seq data

Affiliations

Robust estimation of cancer and immune cell-type proportions from bulk tumor ATAC-Seq data

Aurélie Anne-Gaëlle Gabriel et al. Elife. .

Abstract

Assay for Transposase-Accessible Chromatin sequencing (ATAC-Seq) is a widely used technique to explore gene regulatory mechanisms. For most ATAC-Seq data from healthy and diseased tissues such as tumors, chromatin accessibility measurement represents a mixed signal from multiple cell types. In this work, we derive reliable chromatin accessibility marker peaks and reference profiles for most non-malignant cell types frequently observed in the microenvironment of human tumors. We then integrate these data into the EPIC deconvolution framework (Racle et al., 2017) to quantify cell-type heterogeneity in bulk ATAC-Seq data. Our EPIC-ATAC tool accurately predicts non-malignant and malignant cell fractions in tumor samples. When applied to a human breast cancer cohort, EPIC-ATAC accurately infers the immune contexture of the main breast cancer subtypes.

Keywords: ATAC-Seq; bulk deconvolution; cancer biology; chromatin accessibility; computational biology; human; systems biology; tumor microenvironment.


Conflict of interest statement

AG, JR, MF, CJ No competing interests declared, DG has recieved consulting fees from CeCaVa and Gnubiotics

Figures

Figure 1.
Figure 1.. Graphical description of the identification of cell-type specific marker peaks and reference ATAC-Seq profiles included in the EPIC-ATAC framework.
(1) 564 pure ATAC-Seq data of sorted cells were collected to build reference profiles for non-malignant cell types observed in the tumor microenvironment. (2) Cell-type specific marker peaks were identified using differential accessibility analysis. (3) Markers with previously observed chromatin accessibility in human healthy tissues were excluded. (4) For tumor bulk deconvolution, the set of remaining marker peaks was refined by selecting markers with correlated behavior in tumor bulk samples. (5) The cell-type specific marker peaks and reference profiles were integrated into the EPIC-ATAC framework to perform bulk ATAC-Seq deconvolution. Created with BioRender.com.
Figure 1—figure supplement 1.
Figure 1—figure supplement 1.. Chromatin accessibility of the markers in the reference and ENCODE samples.
Chromatin accessibility signal of each marker peak (rows) in each reference sample and in the ENCODE samples from diverse tissues (columns).
Figure 2.
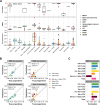
Figure 2.. ATAC-Seq data from sorted cell populations reveal cell-type specific marker peaks and reference profiles.
(A) Number of samples collected for each cell type. The colors correspond to the different studies of origin. (B) Representation of the collected samples using the first three components of the PCA based on the PBMC markers (left) and TME markers (right). Colors correspond to cell types. (C) Scaled averaged chromatin accessibility of all the cell-type specific marker peaks (PBMC and TME markers) (rows) in each cell type (columns) in the ATAC-Seq reference samples used to identify the marker peaks. (D) Scaled averaged chromatin accessibility of all the marker peaks in external ATAC-Seq data from samples of pure cell types excluded from the reference samples (see Materials and methods). (E) Scaled averaged chromatin accessibility of all the marker peaks in an external scATAC-Seq dataset (Human Atlas Zhang et al., 2021b). (F) Distribution of the marker peak distances to the nearest transcription start site (TSS) (left panel) and the ChIPseeker annotations (right panel). (G) Significance (-log10(q.value)) of pathways (columns) enrichment test obtained using ChIP-Enrich on each set of cell-type specific marker peaks (rows). A subset of relevant enriched pathways is represented. Colors of the names of the pathways correspond to cell types where the pathways were found to be enriched. When pathways were significantly enriched in more than one set of peaks, pathway names are written in bold.
Figure 2—figure supplement 1.
Figure 2—figure supplement 1.. Reference samples in the PCA space.
Pairwise scatterplots of the first 3 axes of the PCA run on the PBMC markers (left) and TME markers (right).
Figure 3.
Figure 3.. EPIC-ATAC accurately estimates immune cell fractions in PBMC ATAC-Seq samples.
(A) Schematic description of the experiment designed to validate the ATAC-Seq deconvolution on PBMC samples. Created with BioRender.com. (B) Comparison between cell-type proportions predicted by EPIC-ATAC and the true proportions in the PBMC bulk dataset. Symbols correspond to donors. (C) Comparison between the proportions of cell types predicted by EPIC-ATAC and the true proportions in the PBMC pseudobulk dataset. Symbols correspond to pseudobulks. (D) Pearson correlation (left) and RMSE (right) values obtained by each deconvolution tool on the PBMC bulk dataset. The EPIC-ATAC results are highlighted in red. (E) Pearson correlation (left) and RMSE (right) values obtained by each deconvolution tool on the PBMC pseudobulk dataset.
Figure 3—figure supplement 1.
Figure 3—figure supplement 1.. Cellular composition of the samples from the PBMC experiment.
Left panel: Proportions of each cell type in the PBMC experiment samples. Shapes match the points shapes from Figure 3B in the main text. Right panel: Chromatin accessibility signal (log scale) of the cell-type specific marker peaks (rows) in each sample (columns) of the PBMC experiment dataset.
Figure 3—figure supplement 2.
Figure 3—figure supplement 2.. Cell-type proportions estimated by different deconvolution methods on the PBMC datasets.
(A) Comparison of the cell-type proportions estimated by the different deconvolution methods included in the benchmark (y-axis) and the true proportions (x-axis) in the PBMC experiment samples (top panel) and in the PBMC pseudobulk samples (bottom panel). (B) Comparison of the cell-type proportions estimated by CIBERSORTx and DeconPeaker using reference profiles built by each tool using our collection of pure ATAC-Seq samples and the true proportions in the PBMC experiment samples (top panel) and in the PBMC pseudobulk samples (bottom panel). (C) Pearson’s correlation coefficient and RMSE values associated with the comparison of the cell-type proportions estimated by each deconvolution tool in each cell type of the PBMC datasets, colors correspond to cell types. Note that for quanTIseq, gray dots correspond to uncharacterized cells since the prediction of an uncharacterized cell type cannot be turned off using the quanTIseq function from the quantiseqr R package. p-values resulting from a paired Wilcoxon test are represented for each pair of comparison between tools. Significance levels are represented as follows: *: p<0.05, **: p<0.01, ***: p<0.001.
Figure 4.
Figure 4.. EPIC-ATAC accurately predicts fractions of cancer and non-malignant cells in tumor samples.
(A) Comparison between cell-type proportions estimated by EPIC-ATAC and true proportions for the basal cell carcinoma (top), gynecological (middle) and HTAN (bottom) pseudobulk datasets. Symbols correspond to pseudobulks. (B) Pearson’s correlation and RMSE values obtained for the deconvolution tools included in the benchmark. EPIC-ATAC is highlighted in red. (C) Same analyses as in panel B, with the uncharacterized cell population excluded for the evaluation of the prediction accuracy. The predicted and true proportions of the immune, stromal and vascular cell types were rescaled to sum to 1.
Figure 4—figure supplement 1.
Figure 4—figure supplement 1.. EPIC-ATAC estimations across different cancer types in the HTAN data.
Comparison of the cell-type proportions estimated by EPIC-ATAC (y-axis) and the true proportions (x-axis) in the HTAN dataset.
Figure 4—figure supplement 2.
Figure 4—figure supplement 2.. Cell-type proportions estimated by different deconvolution methods on the tumor samples.
Comparison of the cell-type proportions estimated by the different deconvolution methods using our reference profiles and the true proportions in the basal cell carcinoma samples (top panel), in the gynecological cancer samples (middle panel) and in the HTAN samples (bottom panel). In each panel, the top row includes the uncharacterized cells while the bottom row excludes them.
Figure 4—figure supplement 3.
Figure 4—figure supplement 3.. Cell-type proportions estimated by CIBERSORTx and DeconPeaker in tumor samples, using reference profiles built from our collection of pure ATAC-Seq samples.
Comparison of the cell-type proportions estimated by CIBERSORTx and DeconPeaker using reference profiles built by each tool using our collection of pure ATAC-Seq samples and the true proportions in the basal cell carcinoma samples (A), in the gynecological cancer samples (B) and in the HTAN samples (C) In each panel, the top row includes the uncharacterized cells while the bottom row excludes them.
Figure 4—figure supplement 4.
Figure 4—figure supplement 4.. RMSE values for cell-type predictions obtained by each tool on the tumor samples.
Top panel: RMSE values associated to the comparison of the true proportions and the cell-type proportions estimated by each deconvolution tool in each cell type. For each cell type, all samples from each cancer pseudobulk dataset were considered, that is colors correspond to cell types and shapes to datasets. p-values resulting from a paired Wilcoxon test are represented for each pair of comparisons between tools. Significance levels are represented as follows: *: p<0.05, **: p<0.01, ***: p<0.001. Bottom panel: Considering that not all deconvolution tools are able to predict the proportion of uncharacterized cells, the same analysis as in the top panel was performed without considering the uncharacterized cells predictions.
Figure 4—figure supplement 5.
Figure 4—figure supplement 5.. CPU time in seconds needed to run each tool on the benchmarking datasets.
Figure 5.
Figure 5.. Accuracy of ATAC-Seq deconvolution is determined by the abundance and specificity of each cell type.
(A) Correlations (top) and RMSE (middle) between EPIC-ATAC predictions and true cell-type proportions in each cell type. True proportions are also shown for each cell type (bottom). Colors correspond to different datasets. (B) Comparison of the proportions estimated by EPIC-ATAC and the true proportions for PBMC samples (PBMC experiment and PBMC pseudobulk samples combined) (top) and the basal cell carcinoma pseudobulks (bottom). Predictions of the proportions of CD4+ and CD8+ T cells were obtained using the reference profiles based on the major cell types, and subtypes predictions using the reference profiles including the T-cell subtypes. (C) Pearson’s correlation values obtained by EPIC-ATAC in each cell type.
Figure 5—figure supplement 1.
Figure 5—figure supplement 1.. Pearson’s correlation and RMSE values for cell-type predictions obtained by each tool for each cell type in the PBMC samples.
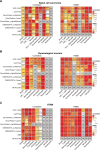
Pearson’s correlation (left panel) and RMSE values (right panel) associated with the comparison of the cell-type proportions estimated by each deconvolution tool (rows) included in the benchmark and the true cell-type proportions in the PBMC samples. The comparisons were made in each cell type (columns) separately. Significance levels of the correlations are represented as follows: *: p<0.05, **: p<0.01, ***: p<0.001.
Figure 5—figure supplement 2.
Figure 5—figure supplement 2.. Pearson’s correlation and RMSE values for cell-type predictions obtained by each tool for each cell type in the tumor samples.
Pearson’s correlation (left panel) and RMSE values (right panel) associated with the comparison of the cell-type proportions estimated by each deconvolution tool (rows) included in the benchmark and the true cell-type proportions. The comparisons were made in each cell type (columns) separately. Panels A, B, and C are associated with the benchmarks performed on the basal cell carcinoma dataset (A), the gynecological cancer dataset (B) and the HTAN dataset (C). Significance levels of the correlations are represented as follows: *: p<0.05, **: p<0.01, ***: p<0.001.
Figure 5—figure supplement 3.
Figure 5—figure supplement 3.. Scaled average chromatin accessibility of each cell-type-specific marker peak, including T-cell subtype markers, in the reference and validation samples.
(A) Scaled averaged chromatin accessibility of each cell-type specific marker peak in each cell-type obtained based on the ATAC-Seq reference samples used to identify the marker peaks. (B) Scaled averaged chromatin accessibility of each cell-type specific marker peak in each cell-type from the sorted samples excluded from the reference samples (see Materials and methods).
Figure 5—figure supplement 4.
Figure 5—figure supplement 4.. Predicted proportions of CD4+ and CD8+ T-cell subtypes using different deconvolution tools.
Left panels: Scatter plots representing proportions estimated by the different deconvolution tools included in the benchmark (y-axis) as a function of the true proportions (x-axis) for PBMC samples (top row) and the basal cell carcinoma pseudobulks (bottom row). CD4+ and CD8+ T cells predictions were obtained using the reference profiles based on the major cell types and the CD4+ and CD8+ T cell subtypes predictions using the reference profiles including the T-cells subtypes. Right panels: Barplots representing Pearson’s correlation values (x-axis) obtained based on the comparison of the predictions and true proportions in each cell type (y-axis).
Figure 6.
Figure 6.. EPIC-ATAC accurately infers the immune contexture in a bulk ATAC-Seq breast cancer cohort.
(A) Proportions of different cell types predicted by EPIC-ATAC in each sample as a function of the average ATAC signal at the cell-type specific CREs used by Kumegawa et al., 2023 to infer the level of cell-type infiltration in the tumor samples (42 samples). Pearson's correlation coefficients and linear regression lines were calculated for each cell type, 95% confidence intervals are represented by the shaded areas. (B) Proportions of different cell types predicted by EPIC-ATAC in the samples stratified based on two breast cancer subtypes. (C) Proportions of different cell types predicted by EPIC-ATAC in the samples stratified based on three ER+/HER2- subgroups. Wilcoxon test p-values are represented at the top of the boxplots.
Figure 6—figure supplement 1.
Figure 6—figure supplement 1.. EPIC-ATAC predictions of the proportions of each myeloid cell type in breast cancer samples.
Top panel: Proportions of each myeloid cell type predicted by EPIC-ATAC. in each sample as a function of the average ATAC signal at the myeloid specific CREs used by Kumegawa and colleagues to infer the level of infiltration in the tumor samples (42 samples). Pearson's correlation coefficients and linear regression lines were calculated for each cell type, 95% confidence intervals are represented by the shaded areas. Middle panel: Proportions of different cell types predicted by EPIC-ATAC in the samples stratified based on two breast cancer subtypes. Bottom panel: Proportions of different cell types predicted by EPIC-ATAC in the samples stratified based on three ER+/HER2- subgroups. Wilcoxon test p-values are represented at the top of the boxplots.
Figure 7.
Figure 7.. EPIC-ATAC and EPIC RNA-seq based deconvolution have similar accuracy and can complement each other.
(A–B) Pearson’s correlation (left) and RMSE (right) values comparing the proportions predicted by the ATAC-Seq deconvolution, the RNA-Seq deconvolution and the GA-based RNA deconvolution and true cell-type proportions in 100 pseudobulks simulated form the 10 x multiome PBMC dataset (10x Genomics, 2021) (panel A) and in the pseudobulks generated from the HTAN cohorts (panel B). Dots correspond to outlier pseudobulks. (C) Left panel: Schematic description of the dataset from Morandini et al., 2024 composed of matched bulk ATAC-Seq, RNA-Seq and flow cytometry data from PBMC samples. Created with BioRender.com. Right panel: Pearson’s correlation (left) and RMSE values (right) obtained by EPIC-ATAC, EPIC-RNA and EPIC-ATAC/RNA (i.e., averaged predictions of EPIC-ATAC and EPIC-RNA) in each cell type separately or all cell types together (columns).

Update of

  • doi: 10.1101/2023.10.11.561826
  • doi: 10.7554/eLife.94833.1
  • doi: 10.7554/eLife.94833.2
  • doi: 10.7554/eLife.94833.3

References

    1. 10x Genomics PBMC from a healthy donor - granulocytes removed through cell sorting (10k) 2021. [September 6, 2023]. https://www.10xgenomics.com/resources/datasets/pbmc-from-a-healthy-donor...
    1. Abascal F, Acosta R, Addleman NJ, Adrian J, Afzal V, Ai R, Aken B, Akiyama JA, Jammal OA, Amrhein H, Anderson SM, Andrews GR, Antoshechkin I, Ardlie KG, Armstrong J, Astley M, Banerjee B, Barkal AA, Barnes IHA, Barozzi I, Barrell D, Barson G, Bates D, Baymuradov UK, Bazile C, Beer MA, Beik S, Bender MA, Bennett R, Bouvrette LPB, Bernstein BE, Berry A, Bhaskar A, Bignell A, Blue SM, Bodine DM, Boix C, Boley N, Borrman T, Borsari B, Boyle AP, Brandsmeier LA, Breschi A, Bresnick EH, Brooks JA, Buckley M, Burge CB, Byron R, Cahill E, Cai L, Cao L, Carty M, Castanon RG, Castillo A, Chaib H, Chan ET, Chee DR, Chee S, Chen H, Chen H, Chen J-Y, Chen S, Cherry JM, Chhetri SB, Choudhary JS, Chrast J, Chung D, Clarke D, Cody NAL, Coppola CJ, Coursen J, D’Ippolito AM, Dalton S, Danyko C, Davidson C, Davila-Velderrain J, Davis CA, Dekker J, Deran A, DeSalvo G, Despacio-Reyes G, Dewey CN, Dickel DE, Diegel M, Diekhans M, Dileep V, Ding B, Djebali S, Dobin A, Dominguez D, Donaldson S, Drenkow J, Dreszer TR, Drier Y, Duff MO, Dunn D, Eastman C, Ecker JR, Edwards MD, El-Ali N, Elhajjajy SI, Elkins K, Emili A, Epstein CB, Evans RC, Ezkurdia I, Fan K, Farnham PJ, Farrell NP, Feingold EA, Ferreira A-M, Fisher-Aylor K, Fitzgerald S, Flicek P, Foo CS, Fortier K, Frankish A, Freese P, Fu S, Fu X-D, Fu Y, Fukuda-Yuzawa Y, Fulciniti M, Funnell APW, Gabdank I, Galeev T, Gao M, Giron CG, Garvin TH, Gelboin-Burkhart CA, Georgolopoulos G, Gerstein MB, Giardine BM, Gifford DK, Gilbert DM, Gilchrist DA, Gillespie S, Gingeras TR, Gong P, Gonzalez A, Gonzalez JM, Good P, Goren A, Gorkin DU, Graveley BR, Gray M, Greenblatt JF, Griffiths E, Groudine MT, Grubert F, Gu M, Guigó R, Guo H, Guo Y, Guo Y, Gursoy G, Gutierrez-Arcelus M, Halow J, Hardison RC, Hardy M, Hariharan M, Harmanci A, Harrington A, Harrow JL, Hashimoto TB, Hasz RD, Hatan M, Haugen E, Hayes JE, He P, He Y, Heidari N, Hendrickson D, Heuston EF, Hilton JA, Hitz BC, Hochman A, Holgren C, Hou L, Hou S, Hsiao Y-HE, Hsu S, Huang H, Hubbard TJ, Huey J, Hughes TR, Hunt T, Ibarrientos S, Issner R, Iwata M, Izuogu O, Jaakkola T, Jameel N, Jansen C, Jiang L, Jiang P, Johnson A, Johnson R, Jungreis I, Kadaba M, Kasowski M, Kasparian M, Kato M, Kaul R, Kawli T, Kay M, Keen JC, Keles S, Keller CA, Kelley D, Kellis M, Kheradpour P, Kim DS, Kirilusha A, Klein RJ, Knoechel B, Kuan S, Kulik MJ, Kumar S, Kundaje A, Kutyavin T, Lagarde J, Lajoie BR, Lambert NJ, Lazar J, Lee AY, Lee D, Lee E, Lee JW, Lee K, Leslie CS, Levy S, Li B, Li H, Li N, Li S, Li X, Li YI, Li Y, Li Y, Li Y, Lian J, Libbrecht MW, Lin S, Lin Y, Liu D, Liu J, Liu P, Liu T, Liu XS, Liu Y, Liu Y, Long M, Lou S, Loveland J, Lu A, Lu Y, Lécuyer E, Ma L, Mackiewicz M, Mannion BJ, Mannstadt M, Manthravadi D, Marinov GK, Martin FJ, Mattei E, McCue K, McEown M, McVicker G, Meadows SK, Meissner A, Mendenhall EM, Messer CL, Meuleman W, Meyer C, Miller S, Milton MG, Mishra T, Moore DE, Moore HM, Moore JE, Moore SH, Moran J, Mortazavi A, Mudge JM, Munshi N, Murad R, Myers RM, Nandakumar V, Nandi P, Narasimha AM, Narayanan AK, Naughton H, Navarro FCP, Navas P, Nazarovs J, Nelson J, Neph S, Neri FJ, Nery JR, Nesmith AR, Newberry JS, Newberry KM, Ngo V, Nguyen R, Nguyen TB, Nguyen T, Nishida A, Noble WS, Novak CS, Novoa EM, Nuñez B, O’Donnell CW, Olson S, Onate KC, Otterman E, Ozadam H, Pagan M, Palden T, Pan X, Park Y, Partridge EC, Paten B, Pauli-Behn F, Pazin MJ, Pei B, Pennacchio LA, Perez AR, Perry EH, Pervouchine DD, Phalke NN, Pham Q, Phanstiel DH, Plajzer-Frick I, Pratt GA, Pratt HE, Preissl S, Pritchard JK, Pritykin Y, Purcaro MJ, Qin Q, Quinones-Valdez G, Rabano I, Radovani E, Raj A, Rajagopal N, Ram O, Ramirez L, Ramirez RN, Rausch D, Raychaudhuri S, Raymond J, Razavi R, Reddy TE, Reimonn TM, Ren B, Reymond A, Reynolds A, Rhie SK, Rinn J, Rivera M, Rivera-Mulia JC, Roberts BS, Rodriguez JM, Rozowsky J, Ryan R, Rynes E, Salins DN, Sandstrom R, Sasaki T, Sathe S, Savic D, Scavelli A, Scheiman J, Schlaffner C, Schloss JA, Schmitges FW, See LH, Sethi A, Setty M, Shafer A, Shan S, Sharon E, Shen Q, Shen Y, Sherwood RI, Shi M, Shin S, Shoresh N, Siebenthall K, Sisu C, Slifer T, Sloan CA, Smith A, Snetkova V, Snyder MP, Spacek DV, Srinivasan S, Srivas R, Stamatoyannopoulos G, Stamatoyannopoulos JA, Stanton R, Steffan D, Stehling-Sun S, Strattan JS, Su A, Sundararaman B, Suner M-M, Syed T, Szynkarek M, Tanaka FY, Tenen D, Teng M, Thomas JA, Toffey D, Tress ML, Trout DE, Trynka G, Tsuji J, Upchurch SA, Ursu O, Uszczynska-Ratajczak B, Uziel MC, Valencia A, Biber BV, van der Velde AG, Van Nostrand EL, Vaydylevich Y, Vazquez J, Victorsen A, Vielmetter J, Vierstra J, Visel A, Vlasova A, Vockley CM, Volpi S, Vong S, Wang H, Wang M, Wang Q, Wang R, Wang T, Wang W, Wang X, Wang Y, Watson NK, Wei X, Wei Z, Weisser H, Weissman SM, Welch R, Welikson RE, Weng Z, Westra H-J, Whitaker JW, White C, White KP, Wildberg A, Williams BA, Wine D, Witt HN, Wold B, Wolf M, Wright J, Xiao R, Xiao X, Xu J, Xu J, Yan K-K, Yan Y, Yang H, Yang X, Yang Y-W, Yardımcı GG, Yee BA, Yeo GW, Young T, Yu T, Yue F, Zaleski C, Zang C, Zeng H, Zeng W, Zerbino DR, Zhai J, Zhan L, Zhan Y, Zhang B, Zhang J, Zhang J, Zhang K, Zhang L, Zhang P, Zhang Q, Zhang X-O, Zhang Y, Zhang Z, Zhao Y, Zheng Y, Zhong G, Zhou X-Q, Zhu Y, Zimmerman J, Moore JE, Purcaro MJ, Pratt HE, Epstein CB, Shoresh N, Adrian J, Kawli T, Davis CA, Dobin A, Kaul R, Halow J, Van Nostrand EL, Freese P, Gorkin DU, Shen Y, He Y, Mackiewicz M, Pauli-Behn F, Williams BA, Mortazavi A, Keller CA, Zhang X-O, Elhajjajy SI, Huey J, Dickel DE, Snetkova V, Wei X, Wang X, Rivera-Mulia JC, Rozowsky J, Zhang J, Chhetri SB, Zhang J, Victorsen A, White KP, Visel A, Yeo GW, Burge CB, Lécuyer E, Gilbert DM, Dekker J, Rinn J, Mendenhall EM, Ecker JR, Kellis M, Klein RJ, Noble WS, Kundaje A, Guigó R, Farnham PJ, Cherry JM, Myers RM, Ren B, Graveley BR, Gerstein MB, Pennacchio LA, Snyder MP, Bernstein BE, Wold B, Hardison RC, Gingeras TR, Stamatoyannopoulos JA, Weng Z, The ENCODE Project Consortium Expanded encyclopaedias of DNA elements in the human and mouse genomes. Nature. 2020;583:699–710. doi: 10.1038/s41586-020-2493-4. - DOI - PMC - PubMed
    1. Arneson D, Yang X, Wang K. MethylResolver-a method for deconvoluting bulk DNA methylation profiles into known and unknown cell contents. Communications Biology. 2020;3:422. doi: 10.1038/s42003-020-01146-2. - DOI - PMC - PubMed
    1. Aryee MJ, Jaffe AE, Corrada-Bravo H, Ladd-Acosta C, Feinberg AP, Hansen KD, Irizarry RA. Minfi: a flexible and comprehensive Bioconductor package for the analysis of Infinium DNA methylation microarrays. Bioinformatics. 2014;30:1363–1369. doi: 10.1093/bioinformatics/btu049. - DOI - PMC - PubMed
    1. Avila Cobos F, Vandesompele J, Mestdagh P, De Preter K. Computational deconvolution of transcriptomics data from mixed cell populations. Bioinformatics. 2018;34:1969–1979. doi: 10.1093/bioinformatics/bty019. - DOI - PubMed