. 2025 Mar 7;27(3):779-794.
doi: 10.1093/neuonc/noae210.

Development of an orthotopic medulloblastoma zebrafish model for rapid drug testing

Affiliations

Development of an orthotopic medulloblastoma zebrafish model for rapid drug testing

Niek van Bree et al. Neuro Oncol. .

Abstract

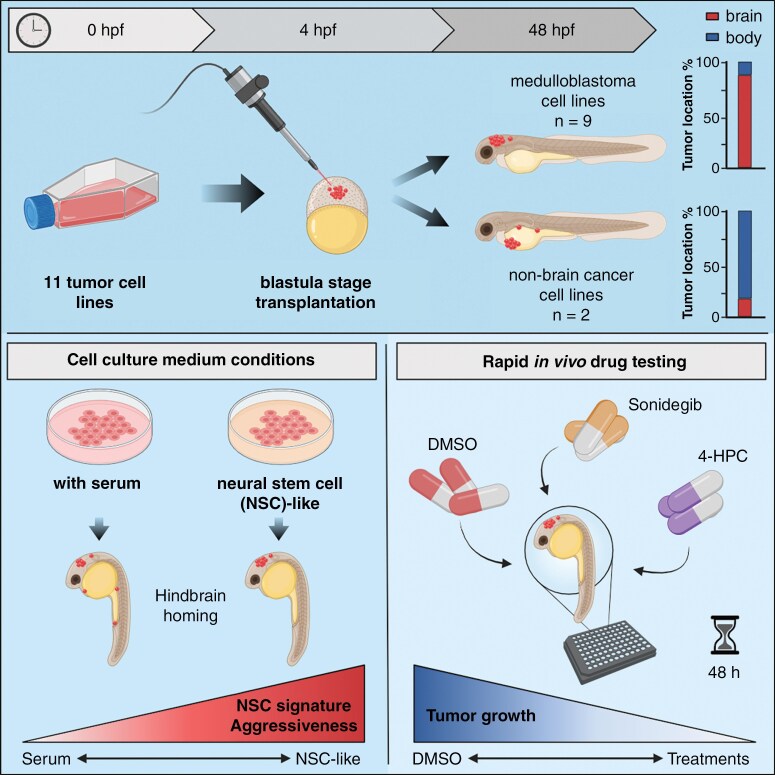
Background: Medulloblastoma (MB) is one of the most common malignant brain tumors in children. Current preclinical in vivo model systems for MB have increased our understanding of molecular mechanisms regulating MB development. However, they may not be suitable for large-scale studies. The aim of this study was to investigate if a zebrafish-based xenograft model can recapitulate MB growth and enable rapid drug testing.

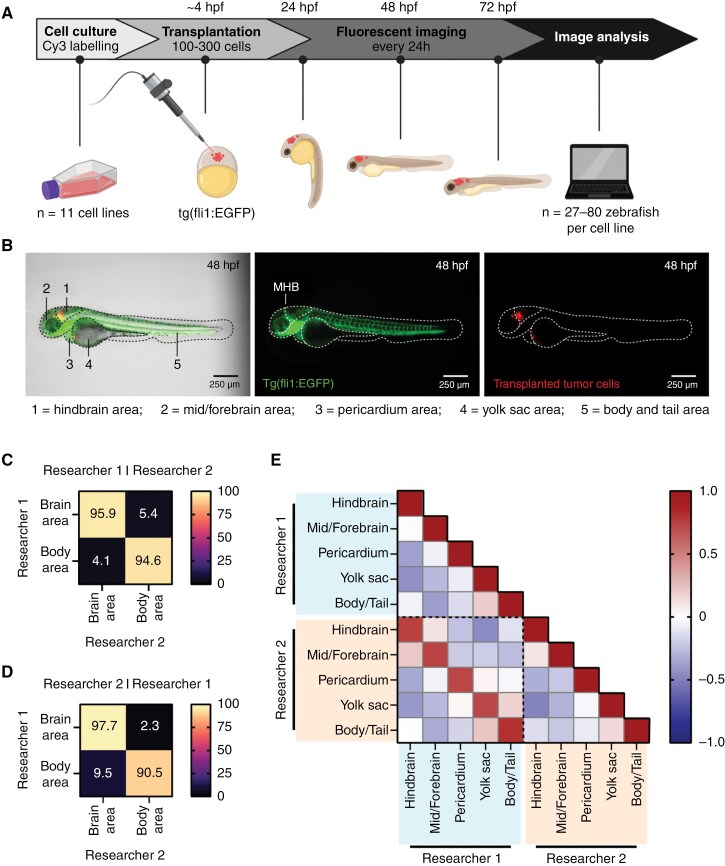
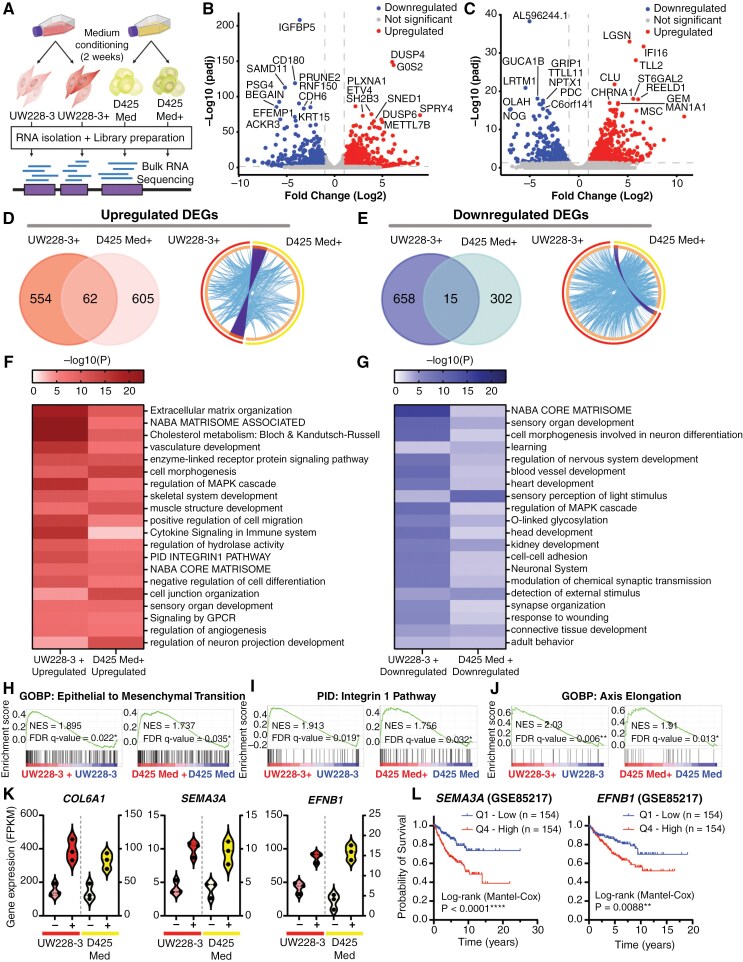
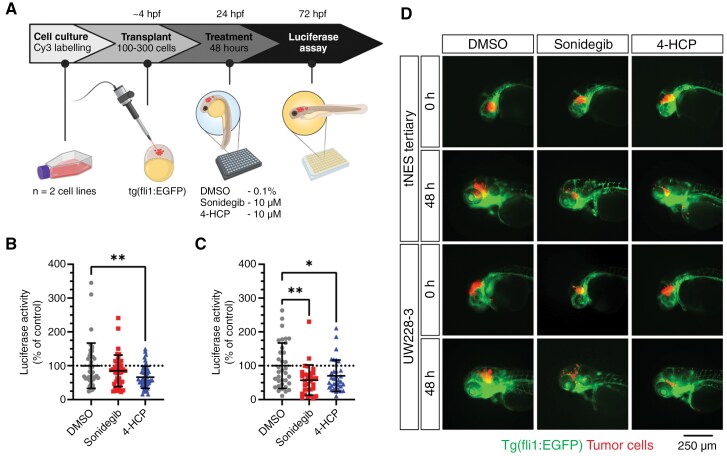
Methods: Nine different MB cell lines or patient-derived cells were transplanted into blastula-stage zebrafish embryos. Tumor development and migration were then monitored using live imaging. RNA sequencing was performed to investigate transcriptome changes after conditioning cells in a neural stem cell-like medium. Furthermore, drug treatments were tested in a 96-well format.

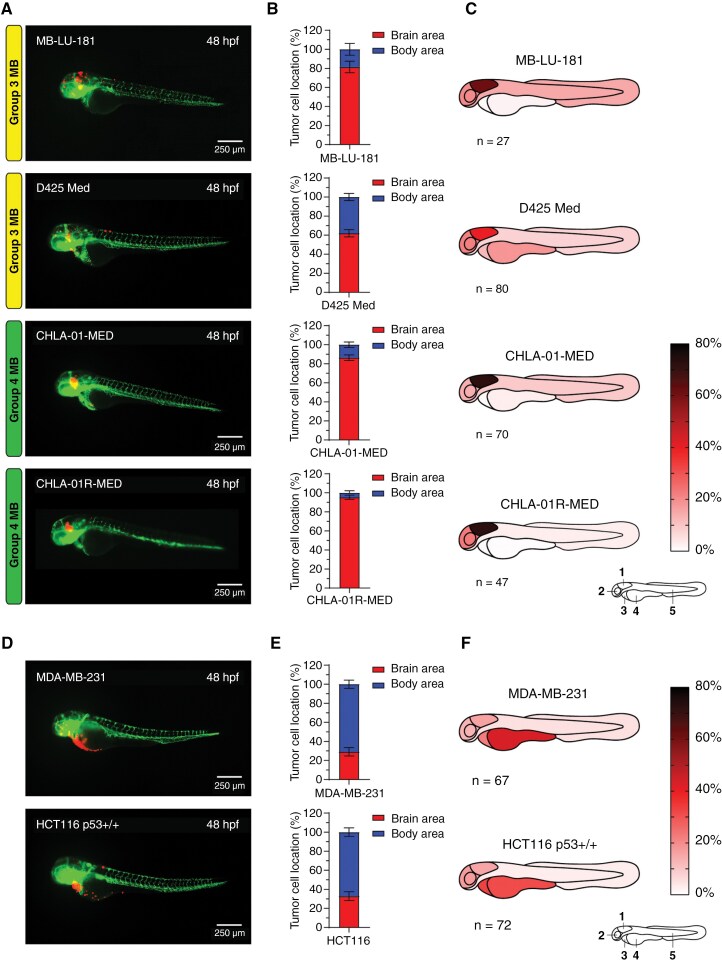
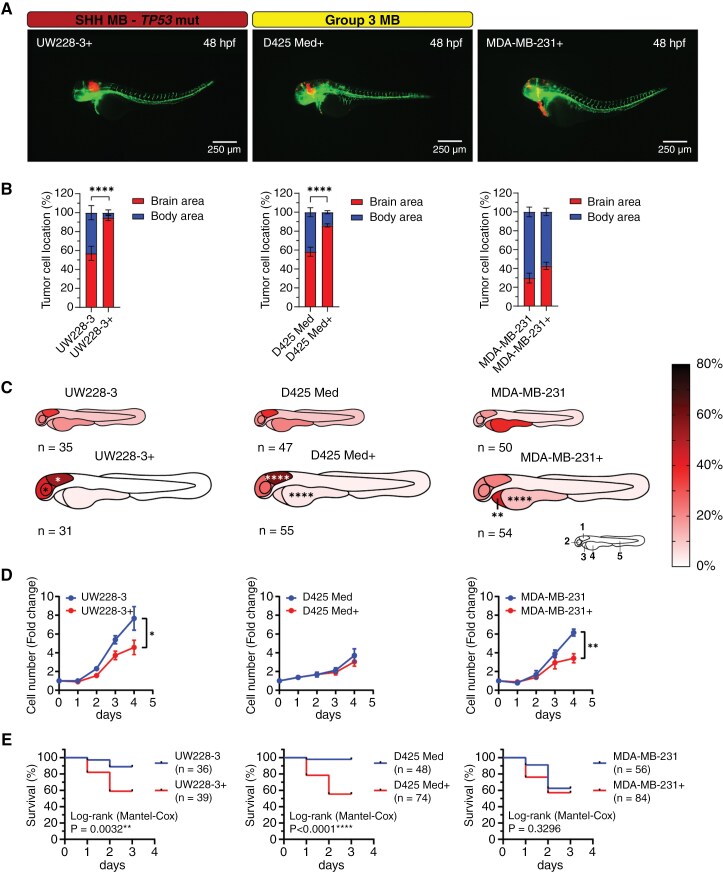
Results: We demonstrate here that transplantation of MB cells into the blastula stage of zebrafish embryos leads to orthotopic tumor growth that can be observed within 24 h after transplantation. Importantly, the homing of transplanted cells to the hindbrain region and the aggressiveness of tumor growth are enhanced by pre-culturing cells in a neural stem cell-like medium. The change in culture conditions rewires the transcriptome toward a more migratory and neuronal phenotype, including the expression of guidance molecules SEMA3A and EFNB1, both of which correlate with lower overall survival in MB patients. Furthermore, we highlight that the orthotopic zebrafish MB model has the potential to be used for rapid drug testing.

Conclusions: Blastula-stage zebrafish MB xenografts present an alternative to current MB mouse xenograft models, enabling quick evaluation of tumor cell growth, neurotropism, and drug efficacy.

Keywords: medulloblastoma; neurotropism; patient-derived xenografts; rapid drug testing; zebrafish.


Conflict of interest statement

The authors N.v.B., A.S.O., L.Z., L.Bo., B.C., F.J.S., J.I.J., and M.W. declare no conflict of interest. The authors S.L. and L.Br. received funding from the Karolinska Institutet core facility grant as well as user fees that are paid to the zebrafish core facility.

Figures

Graphical Abstract
Graphical Abstract
Figure 1.
Figure 1.
Homing of fluorescently labeled tumor cells transplanted in zebrafish embryos can be examined with fluorescent imaging and image analysis. (A) Schematic overview of the experimental workflow for zebrafish embryo transplantations followed by tumor location analysis. (B) Representative image of a tertiary tNES cell transplanted zebrafish embryo 48 h post-fertilization (hpf), displaying the 5 defined locations for location analysis. Left panel: bright field with GFP and Cy3 overlay. Middle panel: expression of enhanced GFP in the vasculature of the fli1:EGFP zebrafish embryo (GFP, green). MHB = mid-hindbrain boundary. Right panel: labeled tumor cells (Cy3, red). (C) Confusion matrices of image classification performed by researcher 1, (D) and researcher 2. (E) Pearson correlation matrix between the analyzed datasets of researcher 1 and researcher 2 revealing high correlation between individually analyzed datasets.
Figure 2.
Figure 2.
SHH medulloblastoma cell lines home toward the hindbrain region after transplantation into the blastula stage of zebrafish embryos. (A) Representative images of fli1:EGFP zebrafish embryos 48 hpf transplanted with SHH medulloblastoma (MB) cell lines. (B) Brain/body area distribution of transplanted SHH MB cell lines in 48 h old embryos (tertiary tNES n = 52, ONS-76 n = 45, BT084 n = 42, DAOY n = 48, and UW228-3 n = 65). Mean ± SEM. (C) Schematic heatmaps of the tumor cell location of SHH MB cell lines in 48 h old embryos. 1 = hindbrain area; 2 = mid/forebrain area; 3 = pericardium area; 4 = yolk sac area; 5 = body and tail area. (D) Tumor take rates (%) of all transplanted MB cell lines. (E) Representative images of tumor growth (tertiary tNES and BT084) from 24 hpf to 72 hpf. (F) Tumor growth rate and (G) survival rate analyses of all transplanted MB cell lines. Kaplan Meier curves represent the survival rate of transplanted zebrafish embryos up to 72 hpf.
Figure 3.
Figure 3.
Group 3 and Group 4 medulloblastoma cell lines display homing toward the hindbrain area upon transplantation into the blastula stage of zebrafish embryos whereas non-medulloblastoma cell lines do not. (A) Representative images of fli1:EGFP zebrafish embryos 48 hpf transplanted with Group 3 (MB-LU-181 and D425 Med) and Group 4 (CHLA-01-MED and CHLA-01R-MED) MB cells, (D) and non-MB cell lines (MDA-MB-231 and HCT116 p53+/+). (B) Brain/body area distribution of transplanted Group 3 and Group 4 MB cell lines MB-LU-181 (n = 27), D425 Med (n = 80), CHLA-01-MED (n = 70), and CHLA-01R-MED (n = 47), and (E) non-MB cell lines MDA-MB-231 (n = 67) and HCT116 p53+/+ (n = 72) in 48 h old embryos. Mean ± SEM. (C) Schematic heatmaps of the tumor cell location of Group 3 MB, Group 4 MB, (F) and non-MB cell lines in 48 h old embryos. 1 = hindbrain area; 2 = mid/forebrain area; 3 = pericardium area; 4 = yolk sac area; 5 = body and tail area.
Figure 4.
Figure 4.
Culture medium composition has a significant effect on tumor cell localization in transplanted zebrafish embryos. (A) Representative images of fli1:EGFP zebrafish embryos 48 hpf transplanted with tumor cell lines cultured in complete neural stem cell medium (UW228-3+, D425 Med+, and MDA-MB-231+). Medium for UW228-3+ was supplemented with 1% FBS for maintenance and removed before transplantation. (B) Brain/body area distribution of tumor cell lines cultured in complete neural stem cell medium (+) compared to normal culture medium in 48 h old embryos. Mean ± SEM, ****P < .0001, Student t-test. (C) Schematic heatmaps of the tumor cell location of tumor cell lines cultured in complete neural stem cell medium (+) compared to normal culture medium in 48 h old embryos. 1 = hindbrain area; 2 = mid/forebrain area; 3 = pericardium area; 4 = yolk sac area; 5 = body and tail area. *P < .05, **P < .01, ****P < .0001, 2-way ANOVA with Šídák post-hoc test. (D) Proliferation rate of UW228-3, D425 Med, and MDA-MB-231 cells cultured in medium with FBS or in neural stem cell medium (+) evaluated by cell counting. Mean ± SD, n = 3 independent experiments. (E) Overall survival analysis of zebrafish transplanted with UW228-3, D425 Med, and MDA-MB-231 cells cultured in medium with FBS or in neural stem cell medium (+). Kaplan–Meier curves depict differences in survival and statistical differences were determined using the Log-rank Mantel-Cox test.
Figure 5.
Figure 5.
Transcriptomic analysis reveals upregulation of genes associated with cancer stemness and migration. (A) Schematic overview of the bulk RNA sequencing protocol. (B) Volcano plot showing all differentially expressed genes (DEGs) upon comparison of the transcriptome of UW228-3 with UW228-3 in complete neural stem cell medium (+), or (C) D425 Med with D425 Med cultured in complete neural stem cell medium (+). Gene names of the top 20 most significant DEGs are shown. Significant DEGs are those with a fold change of ≥ 2 (Log2FC ≥ 1) and an adjusted P-value of ≤ .05. Blue dots (left side) represent downregulated genes and red dots (right side) represent upregulated genes. (D) Left panel: Venn diagram showing overlap between the upregulated and (E) downregulated DEGs in UW228-3+ and D425 Med+. Right panel: Circos plots displaying the gene overlap and shared term level between the gene lists UW228-3 versus UW228-3+ and D425 Med versus D425 Med+. Purple lines link identical genes and blue lines link genes that belong to the same enriched ontology term. The inner circle represents the 2 gene lists, whereas the outside circle represents the group. (F, G) Heatmaps of enriched gene set terms shared across both gene lists, colored by P-values. Each term represents a cluster of multiple associated gene sets. Clusters were named after the most significantly expressed gene set present in both gene lists. (H–J) Epithelial to mesenchymal transition, integrin-1 pathway, and axis elongation are all significantly enriched in both UW228-3 and D425 Med when cultured in complete neural stem cell medium (+) as observed upon GSEA analysis. (K) Violin plots showing the DEGs COL6A1, SEMA3A, and EFNB1 that are significantly enriched in both UW228-3+ and D425 Med+, expressed as fragments per kilobase (FPKM). (L) Kaplan–Meier curves represent the survival of MB patients with low expression (Q1) compared with MB patients with high expression (Q4) of SEMA3A or EFNB1.
Figure 6.
Figure 6.
Transplantation in the blastula stage of zebrafish embryos can be used as an orthotopic medulloblastoma model for rapid in vivo testing of drug compounds. (A) Schematic overview of the treatment protocol. (B) Luciferase activity of transplanted tertiary tNES cells (C) and UW228-3 cells after 48 h of treatment with sonidegib or 4-HCP. Data normalized to the DMSO control and presented as mean ± SD with each point representing one zebrafish embryo of 2 individual experiments. *P < .05, **P < .01, 1-way ANOVA with Dunnett post-hoc test. (D) Representative images of zebrafish upon Sonidegib and 4-HCP treatment. Green indicates the vasculature system of zebrafish (fli1:EGFP) and red (Cy3) indicates the tumor cells transplanted.

References

    1. Cavalli FMG, Remke M, Rampasek L, et al.Intertumoral heterogeneity within medulloblastoma subgroups. Cancer Cell. 2017;31(6):737–754.e6. - PMC - PubMed
    1. Packer RJ, Gajjar A, Vezina G, et al.Phase III study of craniospinal radiation therapy followed by adjuvant chemotherapy for newly diagnosed average-risk medulloblastoma. J Clin Oncol. 2006;24(25):4202–4208. - PubMed
    1. Hill RM, Richardson S, Schwalbe EC, et al.Time, pattern, and outcome of medulloblastoma relapse and their association with tumour biology at diagnosis and therapy: a multicentre cohort study. Lancet Child Adolesc Health. 2020;4(12):865–874. - PMC - PubMed
    1. Roussel MF, Stripay JL.. Modeling pediatric medulloblastoma. Brain Pathol. 2020;30(3):703–712. - PMC - PubMed
    1. Fan RY, Wu JQ, Liu YY, et al.Zebrafish xenograft model for studying mechanism and treatment of non-small cell lung cancer brain metastasis. J Exp Clin Cancer Res. 2021;40(1):371. - PMC - PubMed

MeSH terms

Substances