. 2024 Oct 11;10(41):eadl4374.
doi: 10.1126/sciadv.adl4374. Epub 2024 Oct 9.

Loss of atrial natriuretic peptide signaling causes insulin resistance, mitochondrial dysfunction, and low endurance capacity

Affiliations

Loss of atrial natriuretic peptide signaling causes insulin resistance, mitochondrial dysfunction, and low endurance capacity

Deborah Carper et al. Sci Adv. .

Abstract

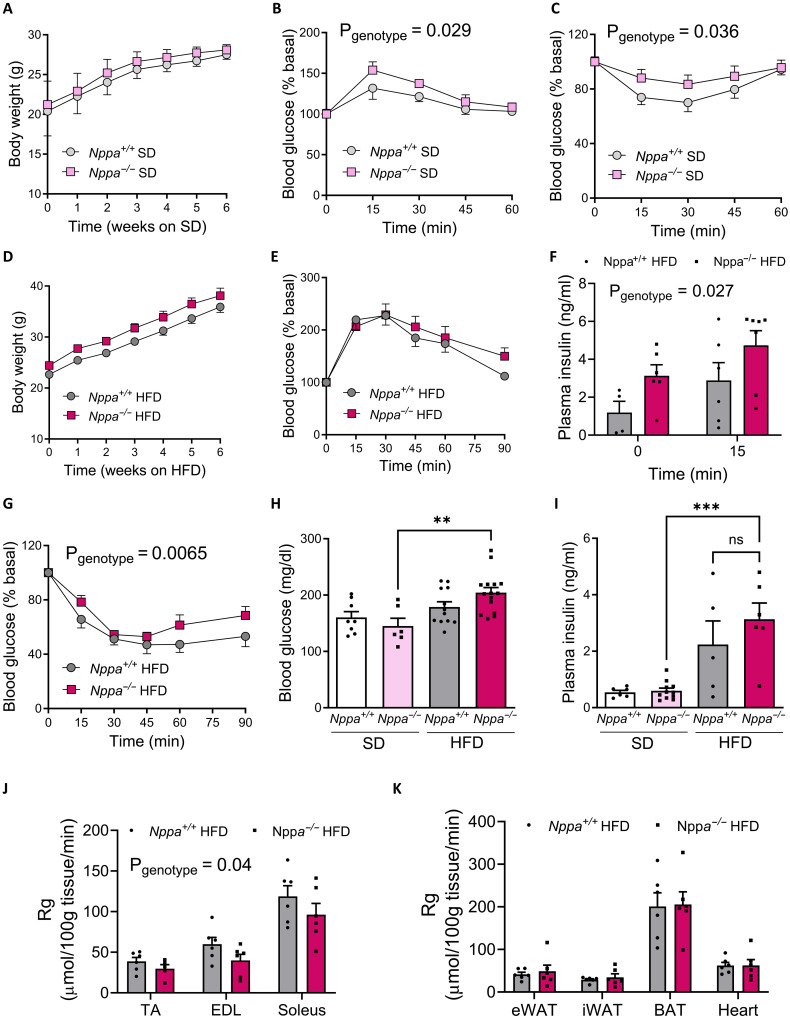
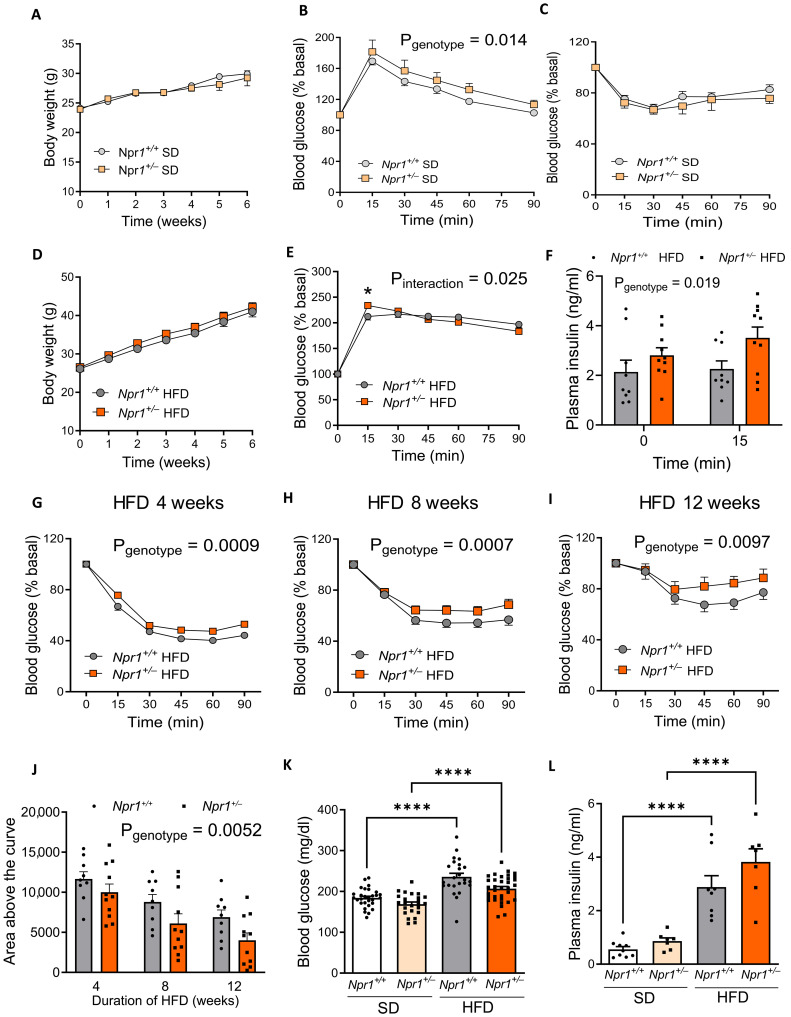
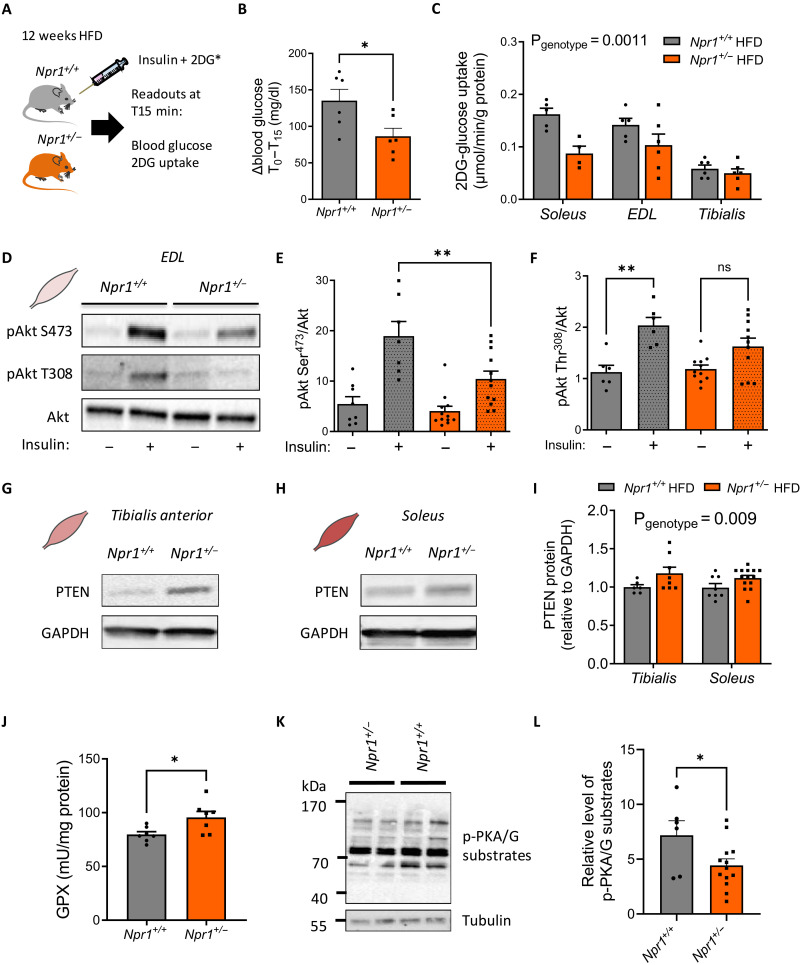
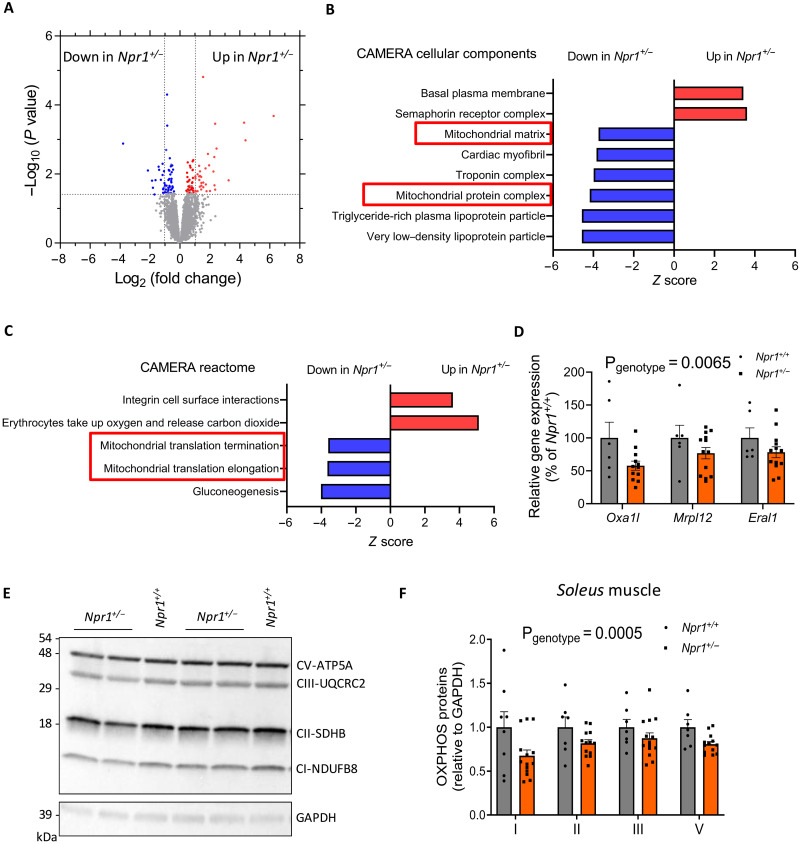
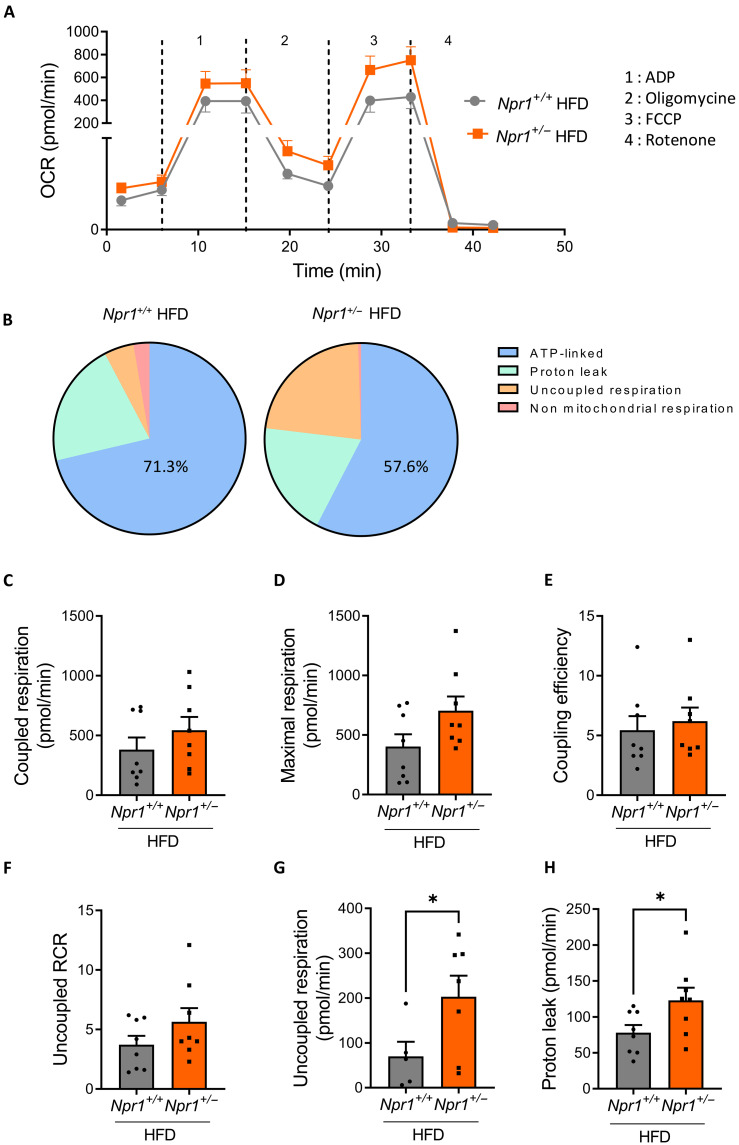
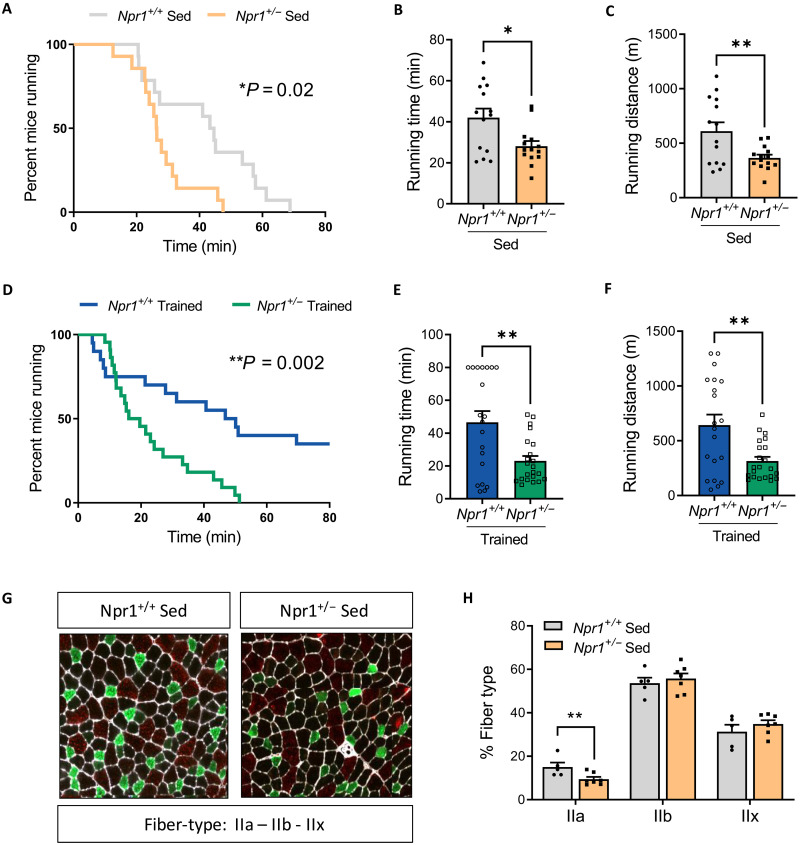
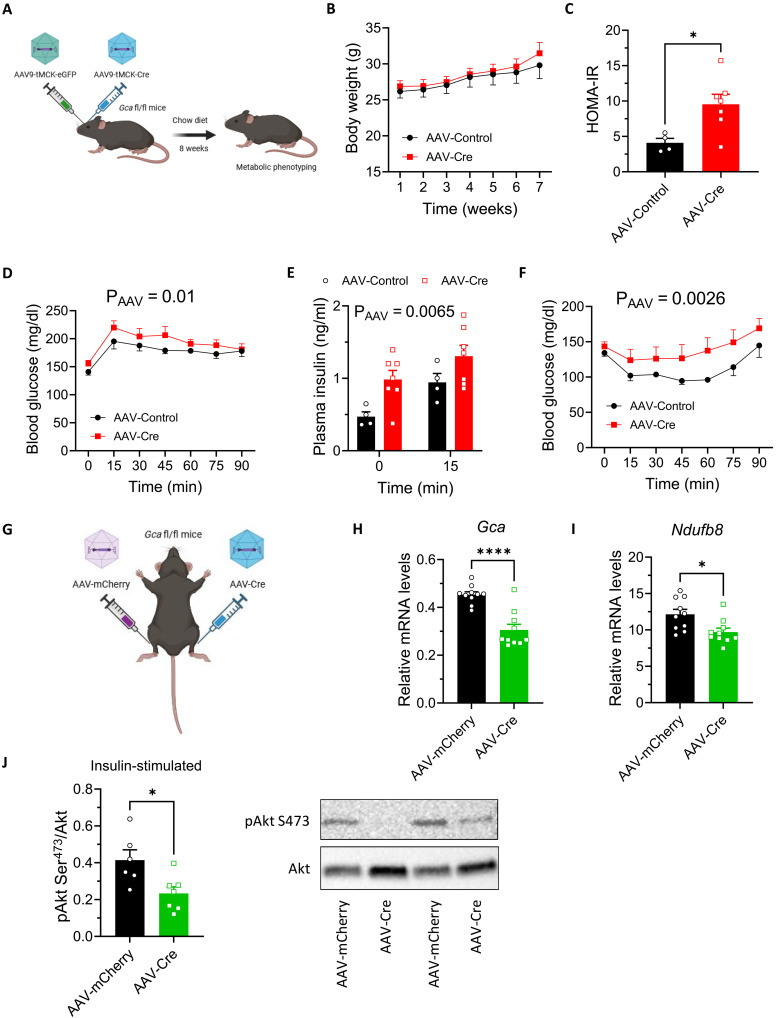
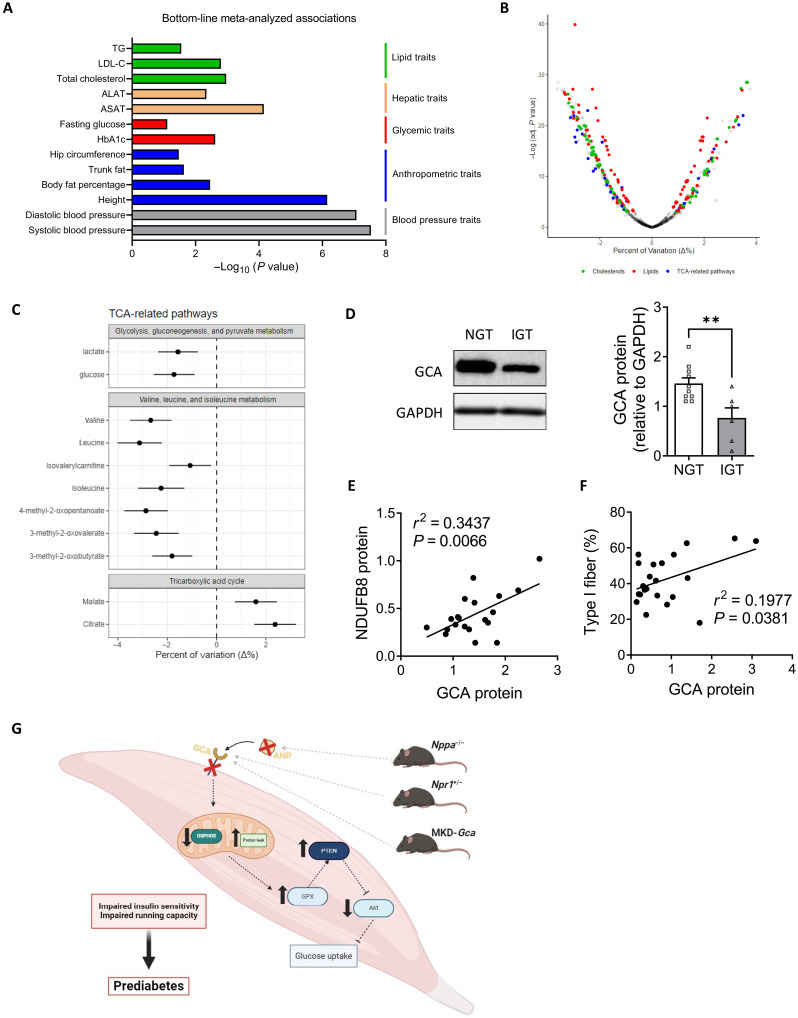
Type 2 diabetes (T2D) and obesity are strongly associated with low natriuretic peptide (NP) plasma levels and a down-regulation of NP guanylyl cyclase receptor-A (GCA) in skeletal muscle and adipose tissue. However, no study has so far provided evidence for a causal link between atrial NP (ANP)/GCA deficiency and T2D pathogenesis. Here, we show that both systemic and skeletal muscle ANP/GCA deficiencies in mice promote metabolic disturbances and prediabetes. Skeletal muscle insulin resistance is further associated with altered mitochondrial function and impaired endurance running capacity. ANP/GCA-deficient mice exhibit increased proton leak and reduced content of mitochondrial oxidative phosphorylation proteins. We further show that GCA is related to several metabolic traits in T2D and positively correlates with markers of oxidative capacity in human skeletal muscle. Together, these results indicate that ANP/GCA signaling controls muscle mitochondrial integrity and oxidative capacity in vivo and plays a causal role in the development of prediabetes.


Figures

Fig. 1.
Fig. 1.. ANP deficiency promotes insulin resistance in lean and obese mice.
Body weight (A) and blood glucose levels during a GTT (n = 8) (B) and an insulin tolerance test (ITT) (n = 13) (C) of Nppa−/− and Nppa+/+ male mice fed SD. Body weight (D) and blood glucose levels during a GTT (E) and plasma insulin levels at t0 and t15 min of the GTT (F) in HFD-fed Nppa−/− and Nppa+/+ mice. Blood glucose levels during an ITT (G) and fasting blood glucose (H) and fasting plasma insulin (I) levels under SD and HFD in Nppa−/− and Nppa+/+ mice. Tissue-specific 2-DG uptake in the tibialis anterior, extensor digitorum longus (EDL), and soleus muscles (J) and in various adipose tissues and the heart (K) of Nppa+/+ and Nppa−/− HFD-fed mice. **P < 0.01, ***P < 0.001, versus Nppa+/+.
Fig. 2.
Fig. 2.. GCA haploinsufficiency exacerbates HFD-induced insulin resistance.
Body weight (A) and blood glucose levels during a GTT (n = 7 to 9) (B) and an ITT (n = 17 to 21) (C) in Npr1+/− and Npr1+/+ male mice fed an SD. Body weight (D) and blood glucose levels during a GTT (E) and plasma insulin levels at t0 and t15 min of the GTT (F) in Npr1+/− and Npr1+/+ mice fed an HFD for 12 weeks (n = 8 to 14). Blood glucose levels during an ITT after 4 weeks (G), 8 weeks (H), and 12 weeks (I) of HFD in Npr1+/− and Npr1+/+ mice (n = 17 to 25). Corresponding area above the curve of the ITT at 4, 8, and 12 weeks of HFD (J), fasting blood glucose (n = 24 to 34) (K), and insulin (n = 7 to 9) levels (L) in Npr1+/− and Npr1+/+ mice fed an SD or HFD. *P ≤ 0.05, ****P < 0.0001, versus Npr1+/+.
Fig. 3.
Fig. 3.. GCA haploinsufficiency causes insulin resistance in skeletal muscle.
Insulin and 2-DG bolus injection in Npr1+/+ and Npr1+/− mice (A), change in blood glucose levels from t0 to t15 min after injection (B), and 2-DG uptake in the soleus, EDL, and tibialis anterior of Npr1+/− and Npr1+/+ HFD-fed male mice after in vivo insulin stimulation (n = 6) (C). Representative immunoblot (D) and relative quantification of Akt-Ser473 phosphorylation (E) and Akt-Thr308 phosphorylation (F) to total Akt ratio in the EDL muscle of Npr1+/− and Npr1+/+ HFD-fed mice after ex vivo insulin stimulation (n = 8 to 14). Representative immunoblot in tibialis anterior (G) and soleus muscle (H) and respective quantification of PTEN protein in both muscle of Npr1+/− and Npr1+/+ HFD-fed mice (n = 7 to 14) (I). GPX activity in the skeletal muscle of Npr1+/− and Npr1+/+ HFD-fed mice (n = 7) (J). Representative immunoblot (K) and quantification of PKA/PKG substrates phosphorylation levels (L) in Npr1+/− and Npr1+/+ HFD-fed mice. *P ≤ 0.05, **P < 0.01, versus Npr1+/+.
Fig. 4.
Fig. 4.. Muscle transcriptomic changes in GCA haploinsufficient obese mice.
(A) Volcano plot depicting DEGs in skeletal muscle of Npr1+/− and Npr1+/+ HFD-fed male mice. Gene Ontology analysis of the DEGs from (A), showing significantly changed CAMERA cellular components (B) and biological pathways (C). (D) Relative expression of three canonical genes of the mitochondrial translation pathway of Npr1+/− and Npr1+/+ HFD-fed mice. Representative immunoblot (E) and relative quantification (F) of OXPHOS protein content (n = 8 to 14) in the soleus of Npr1+/− and Npr1+/+ mice fed an HFD.
Fig. 5.
Fig. 5.. GCA haploinsufficiency induces mitochondrial dysfunction in skeletal muscle.
(A) OCR in isolated muscle mitochondria and (B) relative contribution of various components of mitochondrial respiration of Npr1+/− and Npr1+/+ male mice under fed an HFD (n = 8). Coupled respiration (C), maximal respiration (D), coupling efficiency (E), uncoupled RCR (F), uncoupled respiration (G), and mitochondrial proton leak (H) in isolated mitochondria from muscle of Npr1+/− and Npr1+/+ mice under fed an HFD (n = 8). *P ≤ 0.05, versus Npr1+/+.
Fig. 6.
Fig. 6.. Impaired endurance capacity and response to training in GCA haploinsufficient sedentary mice.
(A) Percent mice running, (B) running time, and (C) running distance of Npr1+/− and Npr1+/+ male sedentary (Sed) mice fed an SD during a submaximal endurance test (n = 14). Percent mice running (D), running time (E), and running distance (F) of Npr1+/− and Npr1+/+ sedentary (Sed) mice fed an SD during a submaximal endurance test after 4 weeks of endurance training (n = 20 to 23). Representative images of tibialis anterior fiber types (G) and relative quantification (H) in Npr1+/− and Npr1+/+ sedentary mice fed an SD with type IIa fibers (green), type IIb fibers (red), and type IIx fibers (black) (n = 5 to 7). *P ≤ 0.05, **P < 0.01, versus Npr1+/+.
Fig. 7.
Fig. 7.. Muscle-specific GCA knockdown impair insulin sensitivity.
(A) Systemic injection of AAV9-tMCK-eGFP or AAV9-tMCK-iCre in Gca fl/fl male mice. Longitudinal body weight (B) and HOMA-IR (C) in mice injected with AAV-Control (n = 4 to 5) and AAV-Cre (n = 7). Blood glucose levels during a GTT (D), plasma insulin at T0 and T15 of the GTT (E), and blood glucose levels during an ITT (F) in mice injected with AAV-Control and AAV-Cre. (G) Intramuscular injection of AAV1-mCherry or AAV1-Cre in Gca fl/fl male mice. Gca (H) and Ndufb8 (I) relative gene expression, as well as representative blot and quantification of insulin-stimulated Akt-Ser473 to Akt phosphorylation level in tibialis anterior muscle (J) of mice injected with AAV-mCherry (n = 10) or AAV-Cre (n = 10). *P ≤ 0.05, ****P < 0.0001, versus AAV-Control or AAV-mCherry.
Fig. 8.
Fig. 8.. GCA correlates with T2D and muscle mitochondrial oxidative traits in humans.
(A) Bottom-line meta-analyzed associations between common variants of NPR1 and metabolic traits extracted from T2DKP. (B) Volcano plot depicting correlations between serum MR-proANP and metabolites from various pathways of the NMR, Biocrates, and Metabolon dataset. Each dot represents a metabolite and its color the corresponding class if correlation reached significance. Dots are displayed on the % variation (x axis) and the negative logarithm of the adjusted P value (y axis) and (C) Forest plot of significant correlations between serum MR-proANP and various metabolites of the TCA cycle from the KORA cohort of the Metabolon dataset. Dots depict the mean % variation and lines the 95% confidence interval. (D) GCA protein level measured in vastus lateralis biopsies of obese individuals with normal glucose tolerance (NGT, n = 10) or IGT (n = 6), **P < 0.01 versus NGT. Linear regression analysis between muscle GCA protein expression and (E) complex I protein-NDUFB8 protein expression (n = 20) and (F) type 1 fiber content (n = 22) in muscle from healthy individuals with a wide-range of clinical characteristics. (G) Illustration of findings obtained in the current study.

References

    1. Roden M., Shulman G. I., The integrative biology of type 2 diabetes. Nature 576, 51–60 (2019). - PubMed
    1. Walford G. A., Ma Y., Christophi C. A., Goldberg R. B., Jarolim P., Horton E., Mather K. J., Barrett-Connor E., Davis J., Florez J. C., Wang T. J., Circulating natriuretic peptide concentrations reflect changes in insulin sensitivity over time in the Diabetes Prevention Program. Diabetologia 57, 935–939 (2014). - PMC - PubMed
    1. Wang T. J., Larson M. G., Levy D., Benjamin E. J., Leip E. P., Wilson P. W., Vasan R. S., Impact of obesity on plasma natriuretic peptide levels. Circulation 109, 594–600 (2004). - PubMed
    1. Kuhn M., Molecular physiology of membrane guanylyl cyclase receptors. Physiol. Rev. 96, 751–804 (2016). - PubMed
    1. Matsukawa N., Grzesik W. J., Takahashi N., Pandey K. N., Pang S., Yamauchi M., Smithies O., The natriuretic peptide clearance receptor locally modulates the physiological effects of the natriuretic peptide system. Proc. Natl. Acad. Sci. U.S.A. 96, 7403–7408 (1999). - PMC - PubMed

Publication types

Substances