. 2024 Oct 11;10(41):eadq0479.
doi: 10.1126/sciadv.adq0479. Epub 2024 Oct 9.

Epigenetic regulation of p63 blocks squamous-to-neuroendocrine transdifferentiation in esophageal development and malignancy

Affiliations

Epigenetic regulation of p63 blocks squamous-to-neuroendocrine transdifferentiation in esophageal development and malignancy

Yongchun Zhang et al. Sci Adv. .

Abstract

While cell fate determination and maintenance are important in establishing and preserving tissue identity and function during development, aberrant cell fate transition leads to cancer cell heterogeneity and resistance to treatment. Here, we report an unexpected role for the transcription factor p63 (Trp63/TP63) in the fate choice of the squamous versus neuroendocrine lineage in esophageal development and malignancy. Deletion of p63 results in extensive neuroendocrine differentiation in the developing mouse esophagus and esophageal progenitors derived from human embryonic stem cells. In human esophageal neuroendocrine carcinoma (eNEC) cells, p63 is transcriptionally silenced by EZH2-mediated H3K27 trimethylation (H3K27me3). Up-regulation of the major p63 isoform ΔNp63α, through either ectopic expression or EZH2 inhibition, promotes squamous transdifferentiation of eNEC cells. Together, these findings uncover p63 as a rheostat in coordinating the transition between squamous and neuroendocrine cell fates during esophageal development and tumor progression.


Figures
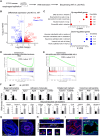
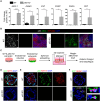
Fig. 1.
Fig. 1.. Loss of p63 leads to neuroendocrine cell differentiation in the developing mouse esophagus.
(A) Schematics showing the epithelial isolation, RNA extraction, and sequencing of the esophagus from WT and p63 KO mice. n = 3 per genotype. (B) Volcano plot of differentially expressed genes between WT and p63 KO mouse esophageal epithelium. Noted are genes involved in squamous and neuroendocrine cell identity. (C) Cell types and tissues gene ontology of genes up-regulated (red) and down-regulated (blue) in p63 KO mouse esophageal epithelium annotated by Descartes Cell Types and Tissues 2021. (D and E) Gene set enrichment analysis (GSEA) indicating down-regulation of the esophageal basal cell signature genes and up-regulation of the neuroendocrine cell signature genes. FDR, false discovery rate. (F) p63 deletion reduces the transcript levels of the basal cell keratins Krt5 and Krt15 and the adhesion molecules Itga3, Itga6, Itgb4, and Lamb3 but increases the levels of the ciliated cell genes Tuba1a and Tubb4a and neuroendocrine cell signature genes including Ascl1, Insm1, Cgrp, Syp, Chga, Chgb, Edn1, Eno2, Cck, Uch1, Gfi1, and Ncam1. *P < 0.05, **P < 0.01, and ***P < 0.001. FPKM, fragments per kilobase of transcript per million mapped reads. (G) The neuroendocrine cell marker INSM1 is ectopically expressed in the epithelium of E14.5 p63 KO esophagus. (H and I) The neuroendocrine markers INSM1, CGRP, and SYP are expressed in the epithelium of p63 KO esophagus. Eso, esophagus. Scale bars, 20 μm. DAPI, 4′,6-diamidino-2-phenylindole.
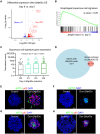
Fig. 2.
Fig. 2.. Lineage tracing and high-dimensional single-cell trajectory analysis reveal p63-expressing progenitor cells as the cellular source of neuroendocrine cells within the esophageal epithelium.
(A) p63CreERT2/+;R26tdTomato (control) and p63CreERT2/CreERT2;R26tdTomato (p63 KO) mouse embryos administered with tamoxifen by oral gavage at E10.5 and tissues were harvested at E18.5. Scale bar, 1 mm. (B) Immunostaining of SYP and tdTomato. Note that the whole esophageal epithelium expresses tdTomato in both WT and p63 KO mice and the ectopic presence of SYP+ neuroendocrine cells in p63 KO mutants. Scale bar, 20 μm. (C) UMAP plot of single-cell RNA sequencing data of E18.5 p63 KO and WT esophageal epithelial cells. (D) Dot plot depicting expression of epithelial cell marker Epcam; basal cell markers Trp63, Krt5, and Krt14; proliferation marker Mki67; suprabasal cell differentiation markers Krt4 and Krt13; neuroendocrine cell markers Syp, Insm1, and Chga; and ciliated cell markers Foxj1 and Ccdc17. (E and F) Percentage of each type of cell in the p63 KO and WT embryos. Notably, 0.05% of cells were assigned as neuroendocrine cells, but no such cells can be detected with immunostaining in WT mice. (G to M) Feature plot depicting individual gene expression. (N) Pseudo-time trajectory analysis of different cell types.
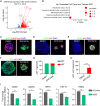
Fig. 3.
Fig. 3.. p63 deletion leads to neuroendocrine differentiation of esophageal progenitor cells derived from hESCs.
(A and B) p63 deletion leads to ectopic neuroendocrine cell differentiation, shown by the increased transcript levels of ASCL1, INSM1, SYP, CGRP, CHGA, and SST (A) and ectopic expression of ASCL1 protein (B). Black bar, WT; gray bar, p63 KO. *P < 0.05, **P < 0.01, and ***P < 0.001. (C) Schematics showing the differentiation of H9 hESCs into esophageal progenitor cells and the formation of esophageal organoids. Endodermal organoids derived from H9 hESCs cells were embedded in Matrigel and cultured in the presence of Noggin, SB431542, and EGF for 7 weeks to form esophageal organoids. (D) p63 deletion leads to the loss of KRT5 expression in hESC-derived esophageal cells. (E) p63 deletion perturbs the formation of stratified esophageal organoids. Note that the WT organoids express high levels of p63 and KRT13 in the periphery and center, respectively. The pattern is lost in p63 KO organoids. (F) p63 deletion leads to the ectopic expression of INSM1 and SYP (yellow boxes) in hESC-derived esophageal organoids. Scale bars, 20 μm.
Fig. 4.
Fig. 4.. ΔNp63 expression is regulated by methylation and acetylation of histone H3 lysine-27.
(A) p63 and INSM1 staining in human eNEC specimens. Scale bar, 20 μm. (B) Schematics showing that TYUC-1 eNEC cells were treated with inhibitors of epigenetic regulators, and gene expression was analyzed by quantitative real-time polymerase chain reaction (qRT-PCR). (C) The transcript levels of TAp63 and ΔNp63 in TYUC-1 eNEC cells treated with various epigenetic inhibitors. Note that the EZH2 inhibitor EPZ-6438 increased the expression of TAp63 and ΔNp63 to the highest levels compared to other inhibitors. (D) Transcript levels of ΔNp63 in TYUC-1 cells treated with EPZ-6438 alone or in combination with JQ1 or A485. (E and F) IF staining and quantification of p63+ cells in EPZ-6438–treated TYUC-1 cells. Note that p63 is expressed in the EPZ-6438–treated group but not in the dimethyl sulfoxide (DMSO)–treated group. ***P < 0.001. Scale bar, 20 μm. (G) Genome browser view at the TP63 locus showing esophagus epithelium H3K27ac ChIP-seq (ENCODE SRX3205374) and TYUC-1 cell H3K27me3, H3K27ac, and BRD4 cleavage under targets and tagmentation (CUT&Tag) upon treatment with EPZ-6438 for 3 and 6 days. Indicated are putative enhancer elements near the ΔNp63 isoform transcription start site (TSS) where H3K27 methylation is lost, and acetylation is restored.
Fig. 5.
Fig. 5.. When overexpressed ΔNp63 isoform binds to and promotes the expression of squamous identity genes in esophageal neuroendocrine cancer cells.
(A) Schematics showing overexpressing ΔNp63α and TAp63α in TYUC-1 cells. Gene expression was analyzed by RNA sequencing (RNA-seq; n = 3), and ΔNp63α binding sites on chromatin were profiled by CUT&Tag assays (n = 2). (B) A heatmap of the transcript levels of squamous cell markers. Note that KRT5 and KRT15 genes were only induced by ΔNp63α. (C) IF staining of p63 and KRT5 in TYUC-1 tumor organoids with doxycycline-induced overexpression of TAp63α and ΔNp63α versus the untreated (control). Scale bar, 20 μm. (D) Quantitation of p63-positive and/or KRT5-positive populations in IF staining images (n = 3). (E to H) Genome browser view of p63 CUT&Tag and RNA-seq upon induction of ΔNp63α expression. Note that ΔNp63α directly binds to KRT5, KRT15, LAMB3, and ITGB4.
Fig. 6.
Fig. 6.. ΔNp63 reprograms esophageal neuroendocrine cancer cells into squamous cells.
(A) Volcano plot of differentially expressed genes upon induction of ΔNp63α expression by doxycycline for 6 days. n = 3 independent experiments. OE, overexpression. (B) GSEA analysis showing that the esophageal squamous cell gene signature is positively correlated with ΔNp63α overexpression over time. (C) Expression levels of genes of the “Descartes Fetal Stomach Squamous Epithelial Cells” gene set at 0, 1, 3, and 6 days of doxycycline treatment. (D) Venn diagram showing the overlap between ΔNp63α-bound genes and ΔNp63α-induced genes. (E to H) IF staining of p63, KRT14, KRT15, KRT4, and KRT13 in the TYUC-1 tumor organoids with doxycycline-induced overexpression of ΔNp63α (Dox-ΔNp63α) versus the untreated (control). Scale bars, 20 μm.
Fig. 7.
Fig. 7.. EZH2i promotes squamous differentiation of esophageal neuroendocrine cancer organoids through p63.
(A) Volcano plot of differentially expressed genes upon treatment of TYUC-1 cells with DMSO or 2 μM EPZ-6438 for 6 days. n = 3 independent experiments. (B) “Descartes Cell Types and Tissues” gene ontology enrichment analysis of up-regulated genes. (C to F) IF staining of H3K27me3; basal cell markers p63, KRT5, and SOX2; and the neuroendocrine cell marker SYP in 3D TYUC-1 organoids. (G and H) Quantification of p63+ organoids (G) and p63+ cells (H) in organoids that contain p63+ cells. ***P < 0.001. (I) Gene expression fold change (2 μM EPZ-6438 versus DMSO) of TYUC-1 organoids transfected with p63 (sip63) or control (siControl) small interfering RNA (siRNA). *P < 0.05, **P < 0.01, and ***P < 0.001. Scale bars, 20 μm.

Update of

References

    1. Jabbari M., Goresky C. A., Lough J., Yaffe C., Daly D., Cote C., The inlet patch: Heterotopic gastric mucosa in the upper esophagus. Gastroenterology 89, 352–356 (1985). - PubMed
    1. Spechler S. J., Zeroogian J. M., Antonioli D. A., Wang H. H., Goyal R. K., Prevalence of metaplasia at the gastro-oesophageal junction. Lancet 344, 1533–1536 (1994). - PubMed
    1. Jiang M., Li H., Zhang Y., Yang Y., Lu R., Liu K., Lin S., Lan X., Wang H., Wu H., Zhu J., Zhou Z., Xu J., Lee D. K., Zhang L., Lee Y. C., Yuan J., Abrams J. A., Wang T. C., Sepulveda A. R., Wu Q., Chen H., Sun X., She J., Chen X., Que J., Transitional basal cells at the squamous-columnar junction generate Barrett’s oesophagus. Nature 550, 529–533 (2017). - PMC - PubMed
    1. Quante M., Bhagat G., Abrams J. A., Marache F., Good P., Lee M. D., Lee Y., Friedman R., Asfaha S., Dubeykovskaya Z., Mahmood U., Figueiredo J. L., Kitajewski J., Shawber C., Lightdale C. J., Rustgi A. K., Wang T. C., Bile acid and inflammation activate gastric cardia stem cells in a mouse model of Barrett-like metaplasia. Cancer Cell 21, 36–51 (2012). - PMC - PubMed
    1. Braslis K. G., David R. C., Nelson E., Civantos F., Soloway M. S., Squamous cell carcinoma of the prostate: A transformation from adenocarcinoma after the use of a luteinizing hormone-releasing hormone agonist and flutamide. Urology 45, 329–331 (1995). - PubMed

MeSH terms