. 2024 Oct 11;10(41):eado2134.
doi: 10.1126/sciadv.ado2134. Epub 2024 Oct 9.

LINE1 modulate human T cell function by regulating protein synthesis during the life span

Affiliations

LINE1 modulate human T cell function by regulating protein synthesis during the life span

Filippo V Burattin et al. Sci Adv. .

Abstract

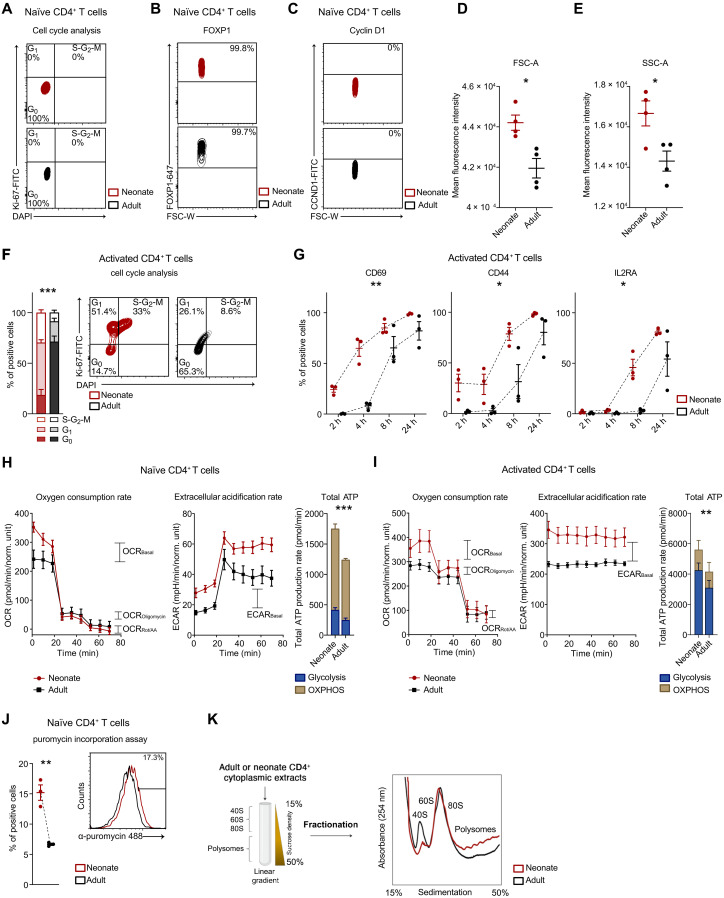
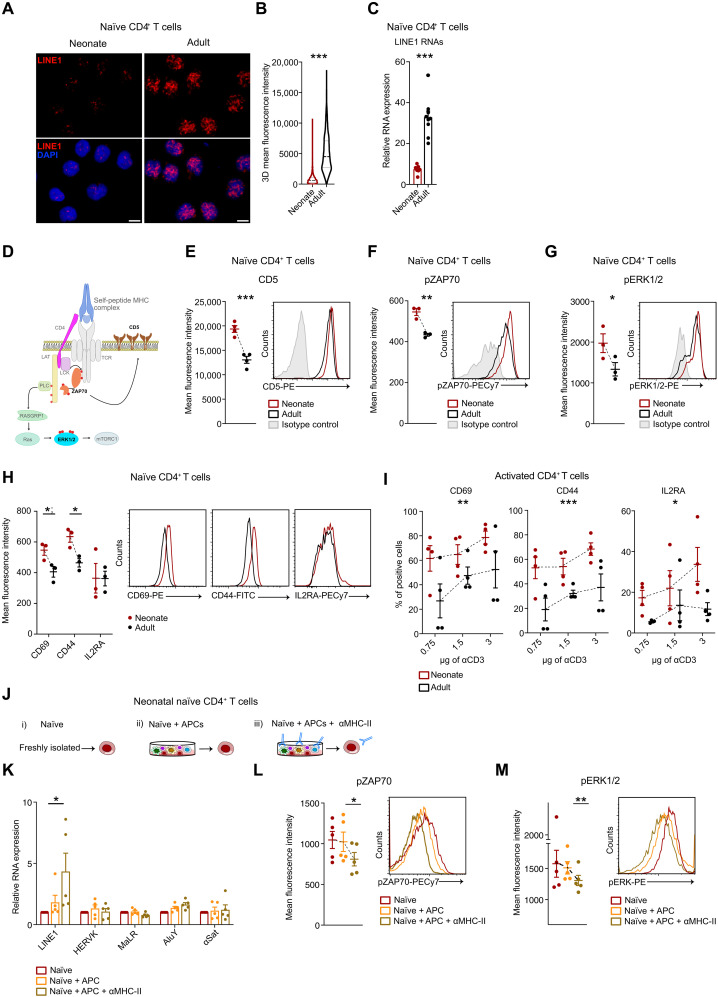
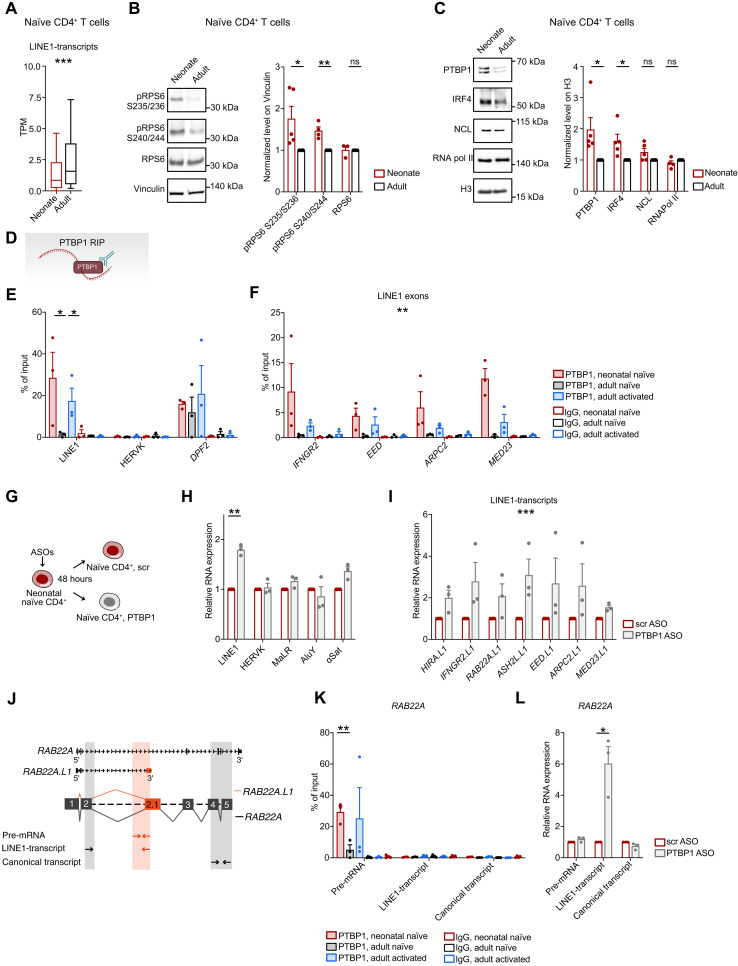
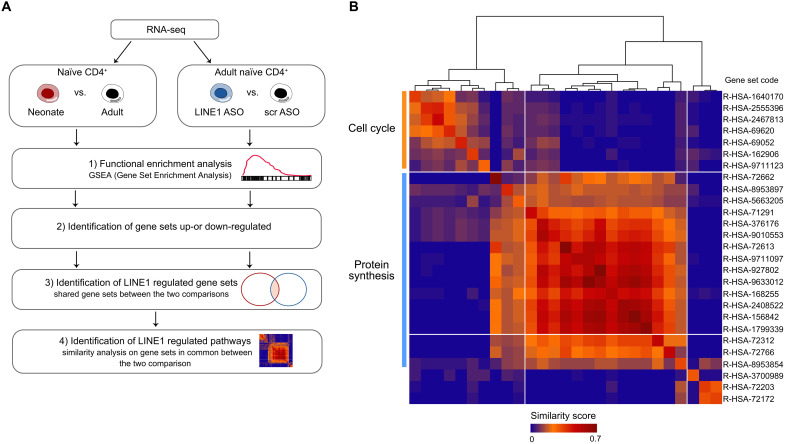
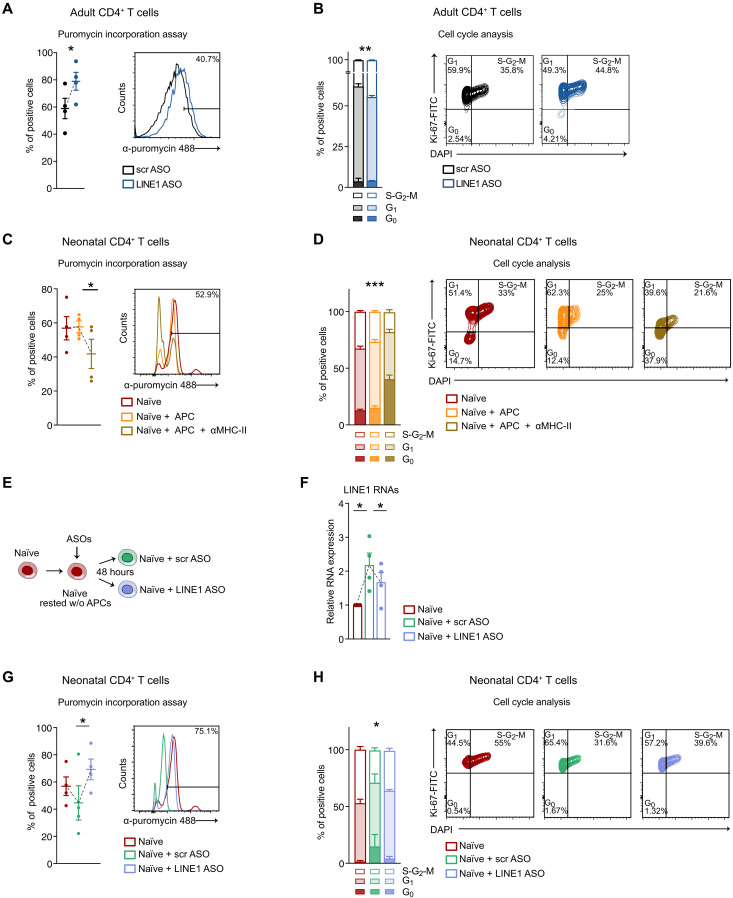
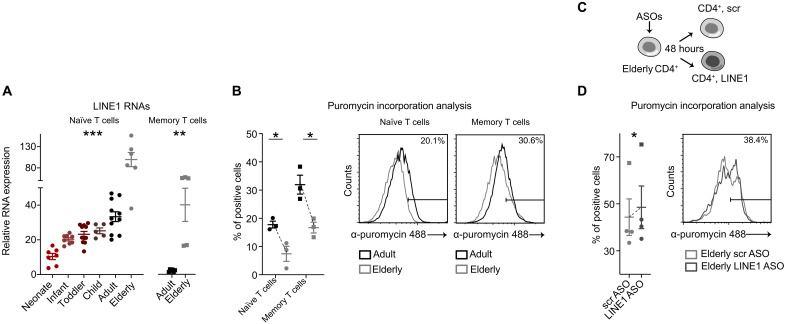
The molecular mechanisms responsible for the heightened reactivity of quiescent T cells in human early life remain largely elusive. Our previous research identified that quiescent adult naïve CD4+ T cells express LINE1 (long interspersed nuclear elements 1) spliced in previously unknown isoforms, and their down-regulation marks the transition to activation. Here, we unveil that neonatal naïve T cell quiescence is characterized by enhanced energy production and protein synthesis. This phenotype is associated with the absence of LINE1 expression attributed to tonic T cell receptor/mTOR complex 1 (mTORC1) signaling and (polypyrimidine tract-binding protein 1 (PTBP1)-mediated LINE1 splicing suppression. The absence of LINE1 expression primes these cells for rapid execution of the activation program by directly regulating protein synthesis. LINE1 expression progressively increases in childhood and adults, peaking in elderly individuals, and, by decreasing protein synthesis, contributes to immune senescence in aging. Our study proposes LINE1 as a critical player of human T cell function across the human life span.


Figures

Fig. 1.
Fig. 1.. Neonatal naïve CD4+ T cells exhibit a quiescent phenotype primed for activation, characterized by enhanced energy production and protein synthesis rate.
(A) Cell cycle analyses were performed using 4′,6-diamidino-2-phenylindole (DAPI) and Ki-67 staining in neonatal or adult naïve CD4+ T cells (n = 4). (B) FOXP1 and (C) CyclinD1 MFI (mean fluorescence intensity) in neonatal or adult naïve CD4+ T cells (n = 3). (D) Cellular size (FSC) and (E) granularity (SSC) MFI in neonatal or adult naïve CD4+ T cells (n = 4). FSC: *P = 0.0103; SSC: *P = 0.0250, unpaired one-tailed t test. (F) Cell cycle analyses in neonatal (n = 4) or adult (n = 5) CD4+ T cells activated for 36 hours. ***P ≤ 0.001, F = 61, two-way ANOVA. (G) Percentage of CD69-, CD44-, and IL2RA-positive naïve CD4+ T cells isolated from neonates or adults and activated for 2, 4, 8, or 24 hours (n = 3). CD69: **P = 0.003, F = 41.9; CD44: *P = 0.01, F = 20; IL2RA: *P = 0.01, F = 17.1, two-way ANOVA. (H and I) Representative kinetic profile of oxygen consumption rate (OCR) (left) and of extracellular acidification rate (ECAR) (middle) measured in neonatal or adult (H) naïve CD4+ T cells or (I) activated for 24 hours. Total ATP production rate (right) is represented as mitochondrial and glycolytic ATP (n = 3). ***P < 0.001, F = 303, two-way ANOVA. **P = 0.002, F = 20.4, two-way ANOVA. (J) Percentage of puromycin-positive neonatal or adult naïve CD4+ T cells (n = 3). **P = 0.003, unpaired two-tailed t test. (K) Schematic representation of polysome profiling technique (left). Polysome profile of neonatal or adult CD4+ T cells activated for 36 hours (right). All data represent mean ± SEM; n refers to individuals.
Fig. 2.
Fig. 2.. The expression of LINE1 is absent in neonatal naïve CD4+ T cells due to tonic TCR stimulation.
(A) LINE1 RNA-FISH in naïve CD4+ T cells from neonates or adults, magnification 63×; scale bar, 5 μm, and (B) relative quantification (at least 500 nuclei, n = 3). ***P < 0.001, unpaired two-tailed t test. (C) LINE1 expression by RT-qPCR in naïve CD4+ T cells from neonates (n = 7) or adults (n = 9). ***P < 0.001, unpaired two-tailed t test. (D) Schematic representation of tonic TCR signaling. (E) CD5, (F) phospho-ZAP70 (Tyr319), and (G) phospho-ERK1/2 (Thr202/Tyr204) MFI in neonatal or adult naïve CD4+ T cells. CD5 (n = 4): ***P < 0.001, unpaired two-tailed t test; phospho-ZAP70 (n = 3): **P = 0.0039, unpaired two-tailed t test; phospho-ERK1/2 (n = 3): *P = 0.04, unpaired one-tailed t test. (H) CD69, CD44, and IL2RA MFI in neonatal or adult naïve CD4+ T cells (n = 3). *P = 0.0432; *P = 0.02, unpaired two-tailed t test. (I) Percentage of CD69-, CD44-, and IL2RA-positive naïve CD4+ T cells activated with different anti-CD3 concentrations (n = 4). CD69: **P = 0.0074, F = 9.111; CD44: ***P = 0.0002, F = 20.89; IL2RA: *P = 0.0117, F = 7.870, two-way ANOVA. (J) Schematic representation of the experiments in (K) to (M). Neonatal naïve CD4+ T cells are either freshly processed or cultured in complete medium with autologous APC, with or without α-MHC-II blocking antibodies. (K) LINE1, HERVK, MaLR, AluY, and α-Satellite expression by RT-qPCR (n = 5). *P = 0.05, paired one-tailed t test. (L) Phospo-ZAP70 (Tyr319) and (M) phospo-ERK1/2 (Thr202/Tyr204) MFI (n = 5). *P = 0.0102; **P = 0.0041, paired two-tailed t test. All data represent mean ± SEM; n refers to individuals.
Fig. 3.
Fig. 3.. mTORC1/PTBP1 suppress LINE1 expression in neonatal naïve CD4+ T cells.
(A) Expression levels of the 461 LINE1-transcripts identified in (15) in RNA-seq datasets (n = 4). ***P = 2.2 × 10⁻¹⁶, unpaired two-tailed Wilcoxon rank sum test. (B and C) Western blot analysis and quantification of (B) RPS6, phospho-RPS6 (Ser235/236 and Ser240/244) and (C) PTBP1, IRF4, NCL, and RNA Pol II in neonatal or adult naïve CD4+ T cells (Ser235/236, PTBP1, and IRF4, n = 5; Ser240/244, NCL, and RNA pol II, n = 4; RPS6, n = 3). Data were normalized on Vinculin or H3. Ser235/236: *P = 0.0356; Ser240/244: **P = 0.0022; PTBP1: *P = 0.0352; IRF4: *P = 0.0205, unpaired two-tailed t test. (D) Schema of PTBP1 RIP assay. (E and F) RIP for PTBP1 in neonatal or adult naïve and adult activated CD4+ T cells (n = 3). LINE1: neonatal versus adult naïve: *P = 0.05; adult naïve versus activated: *P = 0.03, unpaired one-tailed t test. LINE1 exons: neonatal versus adult naïve: **P = 0.001, F = 16, two-way ANOVA. (G) Schematic representation of PTBP1 knockdown with ASOs. (H) LINE1, HERVK, MaLR, AluY, α-Satellite, and (I) LINE1-transcripts expression by RT-qPCR in neonatal naïve CD4+ T cells treated with PTBP1 or control (scr) ASOs (n = 3). **P = 0.006, paired two-tailed t test; ***P < 0.001, F = 20.8, two-way ANOVA. (J) Scheme of RT-qPCR for RAB22A transcripts to inspect PTBP1 regulation on pre-mRNA, LINE1-transcripts, or canonical transcripts. (K) RIP for PTBP1 in neonatal or adult naïve and adult activated CD4+ T cells (n = 3). Neonatal versus adult naïve: **P = 0.009, unpaired two-tailed t test. (L) RAB22A isoform expression by RT-qPCR in neonatal naïve CD4+ T cells treated with PTBP1 or scr ASOs (n = 3). *P = 0.0445, paired two-tailed t test. All data represent mean ± SEM; n refers to individuals.
Fig. 4.
Fig. 4.. The expression of LINE1 in T cells plays a regulatory role in processes related to protein synthesis and cell cycle.
(A) Diagram illustrating the workflow used for identifying commonly altered pathways in RNA-seq datasets, comparing neonatal versus adult naïve CD4+ T cells and adult naïve CD4+ T cells depleted of LINE1 (LINE1 ASOs) versus control cells (scr ASOs): (1) GSEA was conducted on “Curated Reactome.” (2) Identification of gene sets that were either up-regulated or down-regulated. (3) Determination of LINE1-regulated gene sets as those shared between the two comparisons. (4) Identification of shared enriched genes within each gene set identified in (3) and relative similarity analysis. (B) Jaccard coefficients were calculated for core-enriched genes within commonly up-regulated gene sets from the two GSEA comparisons. These coefficients were clustered to assess cross-similarity among gene sets, highlighting that most of these gene sets are associated with molecular pathways related to mRNA translation and cell cycle progression.
Fig. 5.
Fig. 5.. LINE1 expression regulates protein synthesis and cell cycle progression.
(A) Percentage of puromycin-positive adult CD4+ T cells treated with LINE1 or scr ASOs and activated for 24 hours (n = 4). *P = 0.04, paired two-tailed t test. (B) Cell cycle analyses in adult CD4+ T cells treated with LINE1 or scr ASOs and activated for 72 hours (n = 3). **P = 0.009, F = 11.2, two-way ANOVA. (C) Percentage of puromycin-positive neonatal CD4+ T cells either freshly processed or cultured in complete medium with autologous APC, with or without α-MHC-II, and activated for 24 hours (n = 4). *P = 0.03, paired one-tailed t test. (D) Cell cycle analyses in neonatal CD4+ T cells either freshly processed or cultured in complete medium with APC, with or without α-MHC-II, and activated for 72 hours (n = 3). ***P < 0.001, F = 38.7, two-way ANOVA. (E) Schematic representation of the strategy used to induce LINE1 re-expression followed by subsequent depletion in neonatal naïve CD4+ T cells [experiments in (F) to (H)]. Neonatal naïve CD4+ T cells were either freshly isolated or cultured in complete medium to re-express LINE1 and subsequently treated with LINE1 or scr ASOs (F) LINE1 expression by RT-qPCR in neonatal naïve CD4+ T cells (n = 4). Naïve versus naïve + scr ASOs: *P = 0.02; naïve + scr ASOs versus naïve + LINE1 ASOs: *P = 0.05, paired two-tailed t test. (G) Percentage of puromycin-positive neonatal naïve CD4+ T activated for 24 hours (n = 4). *P = 0.03, paired one-tailed t test. (H) Cell cycle analyses in neonatal naïve CD4+ T cells activated for 72 hours (n = 3). *P = 0.04, F = 3.26, two-way ANOVA. All data represent mean ± SEM; n refers to individuals.
Fig. 6.
Fig. 6.. LINE1 are overexpressed in T cells during aging, reducing the rate of protein synthesis.
(A) Left, LINE1 expression by RT-qPCR in naïve CD4+ T cells isolated from individuals across various age groups: neonates, 0 to 2 years old, 3 to 6 years old, 7 to 13 years old, adults (<65 years old), and elderly (>80 years old). Each data point corresponds to an individual (n = 48). ***P < 0.001, F = 25.6, one-way ANOVA. Right, LINE1 expression by RT-qPCR in memory CD4+ T cells isolated from adult or elderly individuals (n = 11). **P = 0.002, unpaired two-tailed t test. (B) Percentage of puromycin-positive naïve or memory CD4+ T cells isolated from adult or elderly individuals (n = 3). Naïve adult versus elderly: *P = 0.02; memory adult versus elderly: *P = 0.02, unpaired two-tailed t test. (C) Schematic representation of the strategy of LINE1 knockdown with ASOs in elderly naïve and memory CD4+ T cells. (D) Percentage of puromycin-positive naïve or memory CD4+ T cells treated with LINE1 or scr ASOs and activated for 24 hours (naïve, n = 3; memory, n = 1). *P = 0.03, paired one-tailed t test. All data represent mean ± SEM; n refers to individuals.

References

    1. Davenport M. P., Smith N. L., Rudd B. D., Building a T cell compartment: How immune cell development shapes function. Nat. Rev. Immunol. 20, 499–506 (2020). - PMC - PubMed
    1. Rudd B. D., Neonatal T cells: A reinterpretation. Annu. Rev. Immunol. 38, 229–247 (2020). - PMC - PubMed
    1. Lucivero G., D’Addario V., Tannoia N., Dell’Osso A., Gambatesa V., Lopalco P. L., Cagnazzo G., Ontogeny of human lymphocytes: Two-color fluorescence analysis of circulating lymphocyte subsets in fetuses in the second trimester of pregnancy. Fetal Diagn. Ther. 6, 101–106 (2009). - PubMed
    1. D'Arena G., Musto P., Cascavilla N., Di Giorgio G., Fusilli S., Zendoli F., Carotenuto M., Flow cytometric characterization of human umbilical cord blood lymphocytes: Immunophenotypic features. Haematologica 83, 197–203 (1998). - PubMed
    1. Fink P. J., The biology of recent thymic emigrants. Annu. Rev. Immunol. 31, 31–50 (2013). - PubMed

Publication types

MeSH terms

Substances