. 2024 Oct 11;10(41):eadm8663.
doi: 10.1126/sciadv.adm8663. Epub 2024 Oct 9.

SLC26A4-AP-2 mu2 interaction regulates SLC26A4 plasma membrane abundance in the endolymphatic sac

Affiliations

SLC26A4-AP-2 mu2 interaction regulates SLC26A4 plasma membrane abundance in the endolymphatic sac

Hyun Jae Lee et al. Sci Adv. .

Abstract

Decreased presence or activity of human SLC26A4 at the plasma membrane is a common cause of hearing loss. SLC26A4 (Pendrin) is necessary for normal reabsorption of endolymph, the fluid bathing the inner ear. We identified the μ2 subunit of adaptor protein 2 (AP-2) complex required for clathrin-mediated endocytosis as a protein-partner of SLC26A4 involved in regulating its plasma membrane abundance. We showed that, in the endolymphatic sac, where fluid reabsorption occurs, SLC26A4 is localized along the apical microvilli of mitochondria-rich cells, in contact with the endolymph, and associated with clathrin-coated pits where μ2 and AP-2 are present. Based on SLC26A4 structure, the elements involved in SLC26A4-μ2 interaction were identified and validated experimentally, allowing modeling of this interaction at the atomic level. Pharmacological inhibition of clathrin-mediated endocytosis led to an increased plasma membrane abundance of hemagglutinin-tagged SLC26A4 virally or endogenously expressed in mitochondria-rich cells. These results indicate that the SLC26A4-μ2 interaction regulates SLC26A4 abundance at the apical surface of mitochondria-rich cells.


Figures

Fig. 1.
Fig. 1.. Schematic illustration of an enlarged vestibular aqueduct and endolymphatic sac and duct in human, and identification of the μ2 subunit of AP-2 as an interacting protein of SLC26A4.
(A) Illustration of typical inner ear anatomy, endolymphatic duct and sac and, by comparison, EVA and endolymphatic sac [adapted from (1) and https://www.nidcd.nih.gov/health/enlarged-vestibular-aqueducts-and-childhood-hearing-loss]. (B) Structure of μ2 N-terminal (μ2-Nt) and C-terminal (μ2-Ct) domains. Five prey clones coding for part of μ2 were obtained from the kidney cDNA library screened with the C-terminal region of SLC26A4 (SLC26A4-Ct, residues 512 to 780). Two clones contained fragments of μ2 corresponding to residues 93 to 435, and three contained fragments corresponding to residues 124 to 435 of μ2, the MID (μ2-MID) among the interacting prey fragments identified in this screen. a.a., amino acid. (C) Results of Y2H assays showing the interaction of the SLC26A4-Ct bait and μ2-MID prey. Yeast expressing the bait and prey were grown in parallel on nonselective (Control) and selective without Histidine (-His) media. Yeast growth on plates without Histidine indicates the bait and prey interaction as observed with SMAD and SMURF, two proteins known to interact (positive control). No growth was seen when an empty vector replaced the vector expressing SLC26A4-Ct or μ2-MID (negative controls). N = 3.
Fig. 2.
Fig. 2.. NanoSPD assays validating the interaction of SLC26A4 with μ2 in HeLa cells.
(A) When coexpressed in HeLa cells, mCherry-MYO10NO BAIT (mCh-MYO10NO BAIT) was enriched at filopodia tips (red), whereas μ2 MID-EGFPPREY was detected in the cytoplasm without enrichment at filopodia tips (green) (upper panels). In contrast, when μ2 MID-EGFPPREY (green) was coexpressed with mCherry-MYO10-SLC26A4-Ct (mCh-MYO10-SLC26A4-CtBAIT) (red), both proteins were enriched at filopodia tips (yellow) (lower panels). Together, these results indicated that SLC26A4-Ct can recruit μ2-MID to filopodia tips. (B) Quantification of the fluorescence of μ2-MID-EGFPPREY, μ2 full-length (FL)-EGFPPREY, or μ2 C-terminal region (Ct)-EGFPPREY at filopodia tips when coexpressed with mCh-MYO10NO BAIT or mCh-MYO10-SLC26A4-CtBAIT. (C) Quantification of reciprocal experiments. mCh-SLC26A4-CtPREY was enriched at filopodia tips when coexpressed with EGFP-MYO10-μ2-MIDBAIT or EGFP-MYO10-μ2-FLBAIT but not when coexpressed with EGFP-MYO10NO BAIT. For each condition, prey fluorescence at filopodia tips from 106 to 439 filopodia is shown. Each dot corresponds to the fluorescence quantified at one filopodium tip and was color coded by biological replicate. Triangles show the mean value per biological replicate. The mean ± SD of these means is shown when N > 2. Experiments were quantified blind to the transfected plasmids. t test (B) or one-way ANOVA followed by Tukey’s multiple comparison tests (C) were used to compare results under different conditions. The value for each filopodium was considered as an independent measurement. ****P < 0.0001. Scale bars, 10 μm.
Fig. 3.
Fig. 3.. SLC26A4 and AP-2 expression and localization in the endolymphatic sac.
(A) Slc26a4 and Ap2m1 transcript levels in cells of developing mouse endolymphatic sac (ProlC, proliferating cell; ProgC, progenitor cell; RRC, ribosome-rich cell; MRC, mitochondria-rich cell) at different ages [scRNA-seq data (3)]. Slc26a4 is highly expressed in MRCs at E16.5, P5, and P30. Ap2m1 is expressed in all cell types at all time points studied. In these violin plots, black dots indicate the expression level of the gene as log2 normalized transcripts per million (nTPM) for a cell. (B to D) Confocal images of whole-mount E16.5 endolymphatic sac immunolabeled for SLC26A4 and α-adaptin used as a proxy of AP-2. Representative maximum intensity projection images of whole endolymphatic sac (B). Higher-magnification images of opened endolymphatic sac (C). Reconstructed tissue cross section at the level of the white dotted line in (C) shows that SLC26A4 and α-adaptin are enriched at the apical luminal membrane of MRCs (D). No qualitative difference was observed between labeling in tissues from male and female mice. Scale bars, 100 μm (B) and 10 μm [(C) and (D)].
Fig. 4.
Fig. 4.. Ultrastructural characteristics of the MRCs of the mouse endolymphatic sac and subcellular localization of SLC26A4.
(A to G) TEM images of MRCs of P0 mouse endolymphatic sac showing numerous apical microvilli, mitochondria, and intracellular vesicles. CCPs at the base of two microvilli are seen in (C), (D), and (F) [(D) and (F) also shown at a higher magnification in (E) and (G)]. (H to J) Immunogold EM images of endolymphatic sac labeled with anti-SLC26A4 antibodies and secondary antibodies coupled to gold particles. SLC26A4 labeling is concentrated along the microvilli (H) but is also present at their base (red arrows) and associated with CCPs (I) and detected in a subset of the many vesicles present in the MRC apical region (J). Similar results were obtained in samples from males and females. Scale bars, 500 nm [(A), (B), (D), and (F)], 250 nm [(H) and (J)], and 100 nm [(C), (E), (G), and (I)].
Fig. 5.
Fig. 5.. Identification of a tyrosine-based motif in the cytosolic C-terminal domain of SLC26A4 necessary for its interaction with μ2.
(A) Conservation across different species of the residues forming the four tyrosine-based motifs present in mouse SLC26A4-Ct. Residues are colored according to their physicochemical properties. (B) Cryo-EM structure of the mouse SLC26A4 dimer in asymmetric form (PDB ID: 7wk1) (7). Transmembrane and STAS domains of one monomer are highlighted in light and dark orange, respectively. Each red sphere represents the Cα atom of the tyrosine of each of these motifs. (C) Close-up view. Only 536-YKNL is in a flexible loop partially exposed to the solvent. (D) Interaction of μ2-MID with SLC26A4-Ct, either WT or carrying a tyrosine to alanine substitution at the different tyrosine-based motifs was tested (Y530A, Y536A, Y556A, and Y691A) in Y2H assays. Y536 is necessary for SLC26A4-Ct-μ2-MID interaction. N = 3. (E) Quantification of NanoSPD assays showing the fluorescence of μ2-MID-EGFPPREY at filopodia tips when coexpressed in HeLa cells with mCh-MYO10NO BAIT or mCh-MYO10-SLC26A4-CtBAIT, either WT or carrying different combinations of substitutions affecting Y530, Y536, Y556, and Y691. (F) Y2H assay results showing that L539 is necessary for the SLC26A4-Ct-μ2-MID interaction. N = 3. (G) Quantification of NanoSPD assays showing a similar result. [(E) and (G)] For each condition, prey fluorescence at filopodia tips from 344 to 431 filopodia is shown. Each dot corresponds to the fluorescence quantified at one filopodium tip and was color coded by biological replicate. Triangles show the mean value per biological replicate. The mean ± SD of these means is shown. One-way ANOVA followed by Tukey’s multiple comparison tests were used to compare results under different conditions. The value for each filopodium was considered as an independent measurement. ****P < 0.0001.
Fig. 6.
Fig. 6.. Residues in the binding pocket of μ2 necessary for its interaction with SLC26A4.
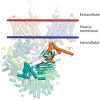
(A) Y2H assay results evaluating the interaction of SLC26A4-Ct and μ2-MID domain, either WT or carrying substitutions affecting different residues of its binding pocket (F174S, D176A, and W421S). N = 3. (B) Quantification of NanoSPD assays between SLC26A4-Ct and μ2-MID WT or with the substitution D176A. For each condition, prey fluorescence at filopodia tips from 323 to 349 filopodia is shown. Each dot corresponds to the fluorescence quantified at one filopodium tip and was color coded by biological replicate. Triangles show the mean value per biological replicate. The mean ± SD of these means is shown. One way ANOVA followed by Tukey’s multiple comparison tests were used to compare results under different conditions. The value for each filopodium was considered as an independent measurement. (C) The structural model of mouse SLC26A4 complexed with the μ2 subunit, obtained after the protein-protein docking protocol, is shown with the membrane represented by two sphere planes indicating extracellular (red) and intracellular (blue) lipid leaflets. SLC26A4 monomers are colored in orange and blue, while μ2 is colored in emerald-green. (D and E) Close-up views of binding sites in μ2 for Y536 and the hydrophobic residue L539 within the SLC26A4 tyrosine-based motif. Residues in μ2 coordinating with these two residues are shown as sticks, and their corresponding interactions are indicated as dashed lines; distances are presented in angstroms. Nitrogen and oxygen are colored in blue and red, respectively. ****P < 0.0001; n.s., not significant.
Fig. 7.
Fig. 7.. Structural model of mouse SLC26A4 complexed with AP-2.
The structural model of mouse SLC26A4 in complex with AP-2 was obtained after structural superimposition of the μ2 subunit in the SLC26A4-μ2 complex and that in the x-ray structure of Rattus norvegicus AP-2 in open form [PDB ID: 2xa7 (35)]. SLC26A4 monomers are colored in orange and blue, while AP-2 subunits are colored in different shades of green.
Fig. 8.
Fig. 8.. Increased surface localization of AAV8-expressed HA-SLC26A4 in MRCs following pharmacological inhibition of CME.
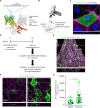
(A) HA tag (YPYDVPDYA) was inserted into the longest extracellular loop of SLC26A4, between A170 and L171. (B) Schematic of Helios Gene Gun–mediated delivery of plasmid-coated gold particles allowing the expression of HA-SLC26A4 in cells of the E16.5 endolymphatic sac (ES) placed 1 day in culture (DIV). (C) Representative image of a transfected ES cell 1 day after plasmid delivery. Anti-HA antibodies were used under nonpermeabilizing conditions to only detect HA-SLC26A4 present at the plasma membrane. HA labeling was concentrated at the apical surface of the cell. (D) Experimental approach designed to allow the expression of HA-SLC26A4 in ES in vivo and monitor the changes of its abundance at the plasma membrane following pharmacological inhibition of CME in ex vivo preparations. (E) Maximum intensity projection image of ES dissected from mouse inner ear 7 days after injection with AAV8-HA-SLC26A4. HA-SLC26A4 was detected in several cells including some positive for FOXI1, an MRC marker. (F) Maximum intensity projection images of DMSO-treated (left, control) and dynasore-treated (right) ESs. HA-SLC26A4 (green) was labeled under nonpermeabilizing conditions with anti-HA antibodies and secondary antibodies coupled to Alexa Fluor 568 (shown here in green). Lower part of each panel: XZ cross section at the level of the dotted line. (G) The CTCF was used as a measure of fluorescence associated with the presence of HA-SLC26A4 at the plasma membrane in cells treated with DMSO alone (27 cells) or with dynasore (31 cells) for 30 min. Each dot corresponds to the CTCF of one cell and was color coded by biological replicate. Triangles show the mean value per biological replicate. The mean ± SD of these means is shown. t test was used to compare results under the two experimental conditions. The CTCF value for each cell was considered as an independent measurement. A similar result was obtained using Mann-Whitney non-parametric test. ***P < 0.001. Scale bars, 10 μm (C), 50 μm (E), and 5 μm (F).
Fig. 9.
Fig. 9.. Increased presence of endogenously expressed HA-SLC26A4 at the plasma membrane of the MRCs following pharmacological inhibition of CME.
(A) Maximum intensity projection images of whole-mount P0 Slc26a4HA/+ mouse endolymphatic sac labeled with anti-HA antibody (green), phalloidin (F-actin, magenta), and Hoechst 33342 (blue) under nonpermeabilizing conditions. Similar to the labeling for the endogenous protein, HA-SLC26A4 labeling is concentrated at the apical membrane of the cells (arrowheads). (B) Maximum intensity projection images of P0 Slc26a4HA/+ mouse endolymphatic sacs treated with DMSO alone (left, control) or with dynasore (right). HA-SLC26A4 (green) and F-actin (magenta) were labeled under nonpermeabilizing conditions. Reconstructed XZ cross sections at the level of the white dotted line are shown in the lower panels [(A) and (B)]. (C and D) Comparison of the results obtained in cells treated with DMSO alone (70 cells, six preparations) or with dynasore (73 cells, seven preparations) for 30 min. The CTCF was used as a measure of the fluorescence associated with the presence of HA-SLC26A4 at the plasma membrane. (C) Each dot corresponds to the CTCF of one cell and was color coded by biological replicate. Triangles show the mean value per biological replicate. The mean ± SD of these means is shown. t test was used to compare results under the two experimental conditions. The value for each cell was considered as an independent measurement. A similar result was obtained using Mann-Whitney non-parametric test. (D) Distribution of the cells treated with DMSO alone or with dynasore as a function of their HA-SLC26A4 fluorescence. For these histograms, the bin width was chosen as 5000 A.U. and lower limits are inclusive. ****P < 0.0001. Scale bars, 10 μm (A) and 5 μm (B).

References

    1. Griffith A. J., Wangemann P., Hearing loss associated with enlargement of the vestibular aqueduct: Mechanistic insights from clinical phenotypes, genotypes, and mouse models. Hear. Res. 281, 11–17 (2011). - PMC - PubMed
    1. Dahlmann A., von During M., The endolymphatic duct and sac of the rat: A histological, ultrastructural, and immunocytochemical investigation. Cell Tissue Res. 282, 277–289 (1995). - PubMed
    1. Honda K., Kim S. H., Kelly M. C., Burns J. C., Constance L., Li X., Zhou F., Hoa M., Kelley M. W., Wangemann P., Morell R. J., Griffith A. J., Molecular architecture underlying fluid absorption by the developing inner ear. eLife 6, e26851 (2017). - PMC - PubMed
    1. Everett L. A., Glaser B., Beck J. C., Idol J. R., Buchs A., Heyman M., Adawi F., Hazani E., Nassir E., Baxevanis A. D., Sheffield V. C., Green E. D., Pendred syndrome is caused by mutations in a putative sulphate transporter gene (PDS). Nat. Genet. 17, 411–422 (1997). - PubMed
    1. Luxon L. M., Cohen M., Coffey R. A., Phelps P. D., Britton K. E., Jan H., Trembath R. C., Reardon W., Neuro-otological findings in Pendred syndrome. Int. J. Audiol. 42, 82–88 (2003). - PubMed

Publication types