. 2024 Oct 9;16(768):eadj7552.
doi: 10.1126/scitranslmed.adj7552. Epub 2024 Oct 9.

A proinflammatory stem cell niche drives myelofibrosis through a targetable galectin-1 axis

Affiliations

A proinflammatory stem cell niche drives myelofibrosis through a targetable galectin-1 axis

Rong Li et al. Sci Transl Med. .

Abstract

Myeloproliferative neoplasms are stem cell-driven cancers associated with a large burden of morbidity and mortality. Most patients present with early-stage disease, but a substantial proportion progress to myelofibrosis or secondary leukemia, advanced cancers with a poor prognosis and high symptom burden. Currently, it remains difficult to predict progression, and therapies that reliably prevent or reverse fibrosis are lacking. A major bottleneck to the discovery of disease-modifying therapies has been an incomplete understanding of the interplay between perturbed cellular and molecular states. Several cell types have individually been implicated, but a comprehensive analysis of myelofibrotic bone marrow is lacking. We therefore mapped the cross-talk between bone marrow cell types in myelofibrotic bone marrow. We found that inflammation and fibrosis are orchestrated by a "quartet" of immune and stromal cell lineages, with basophils and mast cells creating a TNF signaling hub, communicating with megakaryocytes, mesenchymal stromal cells, and proinflammatory fibroblasts. We identified the β-galactoside-binding protein galectin-1 as a biomarker of progression to myelofibrosis and poor survival in multiple patient cohorts and as a promising therapeutic target, with reduced myeloproliferation and fibrosis in vitro and in vivo and improved survival after galectin-1 inhibition. In human bone marrow organoids, TNF increased galectin-1 expression, suggesting a feedback loop wherein the proinflammatory myeloproliferative neoplasm clone creates a self-reinforcing niche, fueling progression to advanced disease. This study provides a resource for studying hematopoietic cell-niche interactions, with relevance for cancer-associated inflammation and disorders of tissue fibrosis.


Conflict of interest statement

Competing interests:

B. Psaila: Alethiomics (co-founder, equity holder, consultancy, research funding), Incyte (research funding, consultancy), Constellation Therapeutics (consultancy), Blueprint Medicines (advisory board, consultancy), Galecto (research funding), Novartis (paid speaking engagements, consultancy); GSK (consultancy, paid speaking engagements), BMS (consultancy). AJM has received honoraria for consulting and speaker fees from Novartis, Celgene/BMS, Abbvie, CTI, MD-Education, Sierra Oncology, Medialis, Morphosys, Ionis, Mescape, Karyopharm, Sensyn, Incyte, Galecto, Pfizer, Relay Therapeutics, GSK, Alethiomics & Gilead. AJM has received research funding from Celgene/BMS, Novartis, Roche, Alethiomics and Galecto. AJM is co-founder and equity holder in Alethiomics Ltd, a spin out company from the University of Oxford. A.O. Khan: Alethiomics (consultancy). Two patents have been filed by A.O. Khan and B. Psaila relating to the human bone marrow organoids platform utilised in this manuscript (GB2202025.9, GB2216647 and 2402478.8).

Figures
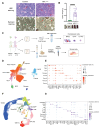
Figure 1
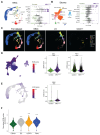
Figure 1. A high resolution cellular atlas of myelofibrotic bone marrow.
(A) H&E (top) and reticulin stained (bottom) femur sections from control and MPLW515L mice. Red arrows highlight megakaryocytes (top) and reticulin fibrosis (bottom), representative images shown. (B) Spleen weights (grams, g) with representative images of control (n = 24) and MPLW515L (n=24) mice. ****p < 0.0001 for unpaired t test with Welch’s correction. Mean ± SEM. (C) Schematic of experimental workflow to capture hematopoietic cells including lineage negative (lin-) cKit+ HPSCs, CD41+ and total mononuclear cells, as well as bone marrow stromal cells from control (n=12) and MPLW515L mice (n=11) for single cell RNA sequencing. n=3 independent experiments. Created with Biorender.com. (D and F) Uniform Manifold Approximation and Projections (UMAPs) of (D) 34,969 stromal cells and (F) 42,319 hematopoietic cells from 12 GFP control mice and 11 MPLW515L mice, colored by annotated cell cluster. (E and G) Dot plots showing expression of canonical marker genes used to annotate (E) stromal and (G) hematopoietic cells. Abbreviations: BM, bone marrow; MNC, mononuclear cells; Fibro-chondro, fibroblast-chondrocytes; Chondro, chondrocytes; OLC, osteolineage cells; Fibro-osteo, fibroblast-osteoblasts; Fibro, Fibroblasts; MSC, mesenchymal stromal cells; A-endo, arterial endothelial cells; S-endo, sinusoidal endothelial cells; Neutro, neutrophils; GMP, granulocyte-monocyte progenitors; Pro-mono, monocyte progenitors; Mono/MG, monocyte/macrophages; HSC/MPP, hematopoietic stem and multipotent progenitor cells; MK, megakaryocytes; EBM, eosinophil, basophil, mast cells; DC, dendritic cells; B, B-cell; T, T-cell; Ery, erythrocytes.
Figure 2
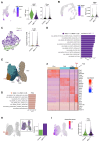
Figure 2. Alterations to the cellular constituents of myelofibrotic bone marrow and source of extracellular matrix components.
(A and B) Differential abundance of (A) mononuclear cell (MNC) subsets and (B) stromal cell subsets in control (green) vs. MPLW515L mice (purple), shown with relevant Uniform Manifold Approximation and Projections (UMAPs) to indicate relative frequency of each cell type. Each dot in the differential abundance plots represents a KNN cluster of the indicated cell type, clusters marked green and purple indicate those significantly depleted or enriched in MPLW515L mice respectively. Sinusoidal and arterial endothelial cells are merged (endo) for the purpose of differential abundance in panel B. (C) Derivation of the total bone marrow hematopoietic cells captured (full dataset) from the three flow cytometric sorting strategies for MNCs, lineage negative cKit+ HSPCs (LK) and CD41+ cells (CD41), indicating that eosinophil, basophil and mast (EBM) cells and megakaryocytes (MK) were primarily captured by the CD41+ cell sort. (D and E) UMAPs (left) showing expression of a gene set of extracellular matrix factors (ECM) in (D) stromal and (E) full hematopoietic cell dataset, with violin plots (right) showing expression in relevant cell clusters from control (green) and MPLW515L mice (purple). Yellow diamond indicates mean value. ***p < 0.001 for Wilcoxon test. (F) Abundance of ECM proteins detected by low-input mass spectrometry proteomics in hematopoietic cells (CD45+), endothelial cells (EC), leptin receptor + mesenchymal stromal cells (LEPR+) and fibroblasts (fibro). **** p < 0001 for adjusted p value comparing each stromal cell subtype to CD45+ hematopoietic cells, n = 4 control mice.
Figure 3
Figure 3. Altered cellular sources of hematopoietic support factors and expansion of inflammatory fibroblasts in myelofibrosis bone marrow.
(A & B) Uniform manifold Approximation and Projection (UMAP, left) and violin plots (right) showing expression of niche supporting factors (NSFs) in (A) stromal and (B) hematopoietic cell datasets. Violin plots show expression in mesenchymal stromal cells (MSC), fibroblasts (Fibro) and eosinophil, basophil & mast cells (EBM) from control (green) and MPLW515L mice (purple). ***p < 0.001 for Wilcoxon test. (C) MSCs from control (green) and MPLW515L mice (purple) cluster separately, reflecting marked transcriptional reprogramming and myofibroblast trans-differentiation as indicated by increased alpha smooth muscle actin (Acta2). (D) Significantly enriched HALLMARK gene sets in MSCs from myelofibrosis mice. Selected gene sets shown. (E) UMAP showing 5 fibroblast sub-clusters. (F) Top 5 differentially expressed genes in each fibroblast subcluster. (G) Selected HALLMARK gene sets significantly enriched in Cluster 4, reflecting inflammatory fibroblast (iFib) phenotype. (H) Frequency of iFibs in MPLW515L vs. control mice. (I) Expression of chemokine genes in fibroblasts. ***p < 0.001 for Wilcoxon test.
Figure 4
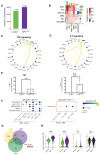
Figure 4. Expansion of pro-inflammatory basophils and mast cells in myelofibrosis.
(A) UMAP showing annotated sub-clusters of cells from the eosinophil, basophil and mast (EBM) cell cluster. (B) CytoTRACE differentiation state analysis of EBM cells, with blue indicating primitive state and yellow showing differentiation trajectory. (C) UMAP identifying cells originating from MPLW515L (purple) and control (green) mice. (D) Significantly enriched HALLMARK gene sets in basophils and mast cells from MPLW515L vs. control mice. (E) Expression of TNF-NFκB pathway genes projected onto the EBM cell UMAP.
Figure 5
Figure 5. Basophils and mast cells emerge as the ‘hub’ of TNF and interleukin 4 pro-inflammatory signaling.
(A) Number of inferred Ligand (L) – Receptor (R) interactions in control and MPLW515L bone marrow. (B) Differential number of L-R interactions in MPLW515L vs. control bone marrow. Total Number of enriched L-R interactions is shown as a bar on the x/y axes and relative strength of the interactions (MPLW515L vs. control bone marrow) is shown in the heatmap for key stromal and hematopoietic cell populations. (C & D) Circus plot depicting interaction pathway of (C) TNF and (D) IL4 uniquely upregulated in MPLW515L mice. The width of the connections reflects the strength of the interactions between two populations. (E) Percentage of TNF-positive (left) and IL4-positive (right) basophils in MPLW515L vs. control bone marrow (n=4) assessed by intracellular flow cytometry. * p < 0.05. (F) Selected L-R interactions predicted to be upregulated in MPLW515L mice between EBM cells, fibroblasts, iFibs, and mesenchymal stromal cells (MSCs). (G) Venn diagram showing distinct and overlapping differentially expressed genes in EBM, MSC and MK clusters. (H) Violin plots showing expression of Lgals1 in EBM, MSC, MK and fibroblasts in control and MPLW515L mice. Abbreviations: R – L, receptor-ligand; L – R, ligand-receptor; TNF, tumor necrosis factor alpha; IL, interleukin; EBM, eosinophil, basophil, mast cells; iFibs, inflammatory fibroblasts; MSCs, mesenchymal stromal cells; Fibro, fibroblast; HSC/MPP, hematopoietic stem and multipotent progenitor cells. ***p < 0.001; ns – non-significant for Wilcoxon test.
Figure 6
Figure 6. Inhibition of Galectin-1 ameliorates fibrosis and myeloproliferation in vivo
(A) Schematic of treatment with isotype control (IgG) or anti-galectin-1 (anti-Gal1) mAb3, initiated on day 7 following transplantation of control or MPLW515L BM cells. (B) H&E and reticulin staining of femur sections from MPLW515L mice treated with IgG control or anti-Gal1 mAb3. Representative images shown. (C) Mean ± SEM platelet counts and hematocrit (HCT) in IgG or anti-Gal1 treated control (n=8 and n=8) and MPLW515L mice (n=13 and n=11). *p < 0.05, **p < 0.01 for unpaired t test with Welch’s correction.. (D & E) Representative images (D) and weights (E) of spleens from IgG or anti-Gal1 mAb3 treated control (n=8 and n=8) and MPLW515L mice (n=13 and n=11). (F) Mean + SEM spleen weights of mice treated with PBS control (n=5) or the JAK2 inhibitor fedratinib (n=4). *p < 0.05, **p < 0.01 for unpaired t test with Welch’s correction.
Figure 7
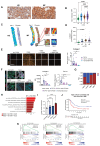
Figure 7. Galectin-1 is a robust biomarker for fibrosis and poor outcomes in myeloid malignancies.
(A) Representative immunohistochemistry staining for galectin-1 (Gal-1) in healthy donor (HD) (n=7) and myelofibrosis (MF) (n=14) bone marrow biopsy sections. (B) Gal-1 expression per high power field (HPF) view in bone marrow biopsy sections from HDs (n=7) and patients with essential thrombocythemia (ET, n = 9), polycythemia vera (PV, n=7), and MF (n=14). Median + 95% CI shown, ****p < 0.0001 for Kruskal-Wallis test. (C) Gal-1 staining intensity correlated with reticulin fibrosis density across bone marrow biopsy sections from HDs and MF patients. Color scale from blue to red as fibrosis density increases. Representative images shown. (D) LGALS1 expression in platelets from a cohort of 120 HDs and patients with MPNs (HD=21, ET=24, PV=33, MF=42). Median + 95% CI. (E) TGFβ-induced fibroblast to myofibroblast transition assay using human BMSCs treated with TGFβ alone + OTX001 (galectin-1 inhibitor) or SB431542 (TGFβ inhibitor). Representative images shown for high-throughput, 384-well imaging plate (left). Each treatment was performed in quadruplicate and 4 images acquired per well (n=7 patients). Chart (right) shows MFI per cell for collagen 1 normalized to the no-TGFβ control ± SEM (n=7). *p < 0.05 for wilcoxon matched pairs signed rank test. (F) Impact of OTX008 on TGFβ-induced Collagen 1 and aSMA in human iPSC-derived BM organoids. Representative images (left); Mean + SEM for protein/mRNA expression quantification of Collagen 1/COL1A1 (right). n=5-8 organoids from 3 independent experiments. *p < 0.05, **p < 0.01, ****p < 0.0001 for one-way ANOVA. (G) Bar chart showing relative proportion of cell subtypes from a previously published dataset of ~120,000 cells from human CD34+ hematopoietic stem/progenitor cells from patients with myelofibrosis (MF) and age-matched healthy donors (HD). (H) Enriched HALLMARK gene sets in EBM progenitor cells from MF patients vs. HD. Abbreviations: UMAP, Uniform manifold Approximation and Projection; EBM, eosinophil (eosino)-basophil (baso)-mast cells; MF, myelofibrosis; HD, healthy donors; NES, normalized enrichment score; FDR, false discovery rate. (I) Mean ± SEM Lgals1 mRNA expression in human bone marrow organoids with/without treatment with TNF at doses shown. n=80 organoids across 2 independent experiments. *p < 0.05, **p < 0.01, ****p < 0.0001 for one-way ANOVA. (J) Schematic illustrating the interactions between basophils, mast cells and megakaryocytes derived from the MPN clone interacting with BMSC subsets, fueling inflammation and fibrosis via galectin-1 induction. Created with Biorender.com. Abbreviations: Ctrl, control; TGFβ, transforming growth factor β; Col1, collagen 1; αSMA, alpha smooth muscle actin; anti-Gal-1, monoclonal anti-Galectin-1 neutralizing antibody; HCT, hematocrit; IgG, isotype IgG control antibody; H&E, hematoxylin and eosin; g, grams. (K) Kaplan-Meier survival curves showing correlation between high LGALS1 expression and poor survival in 132 patients with acute myeloid leukemia (AML) in The Cancer Genome Atlas (TCGA) dataset. (L) Gene set enrichment analysis show significant enrichment of IL6-JAK-STAT3 signalling, inflammatory response and TNF signalling via NFKB in patients with high LGALS1 expression in TCGA database. Abbreviations: HR, hazard ratio; NES, normalized enrichment score; FDR, false discovery rate.

References

    1. Khoury JD, Solary E, Abla O, Akkari Y, Alaggio R, Apperley JF, Bejar R, Berti E, Busque L, Chan JKC, Chen W, et al. The 5th edition of the World Health Organization Classification of Haematolymphoid Tumours: Myeloid and Histiocytic/Dendritic Neoplasms. Leukemia. 2022;36:1703–1719. doi: 10.1038/s41375-022-01613-1. - DOI - PMC - PubMed
    1. Nangalia J, Green AR. Myeloproliferative neoplasms: from origins to outcomes. Hematology Am Soc Hematol Educ Program. 2017;2017:470–479. doi: 10.1182/asheducation-2017.1.470. - DOI - PMC - PubMed
    1. Koschmieder S, Mughal TI, Hasselbalch HC, Barosi G, Valent P, Kiladjian JJ, Jeryczynski G, Gisslinger H, Jutzi JS, Pahl HL, Hehlmann R, et al. Myeloproliferative neoplasms and inflammation: whether to target the malignant clone or the inflammatory process or both. Leukemia. 2016;30:1018–1024. - PubMed
    1. Koschmieder S, Chatain N. Role of inflammation in the biology of myeloproliferative neoplasms. Blood Rev. 2020;42:100711. - PubMed
    1. Strickland M, Quek L, Psaila B. The immune landscape in BCR-ABL negative myeloproliferative neoplasms: inflammation, infections and opportunities for immunotherapy. Br J Haematol. 2022;196:1149–1158. doi: 10.1111/bjh.17850. - DOI - PMC - PubMed

Publication types