. 2024 Dec;18(1):2402749.
doi: 10.1080/19336950.2024.2402749. Epub 2024 Oct 9.

Binding kinetics of quaternary ammonium ions in Kcv potassium channels

Affiliations

Binding kinetics of quaternary ammonium ions in Kcv potassium channels

Tobias Korn et al. Channels (Austin). 2024 Dec.

Abstract

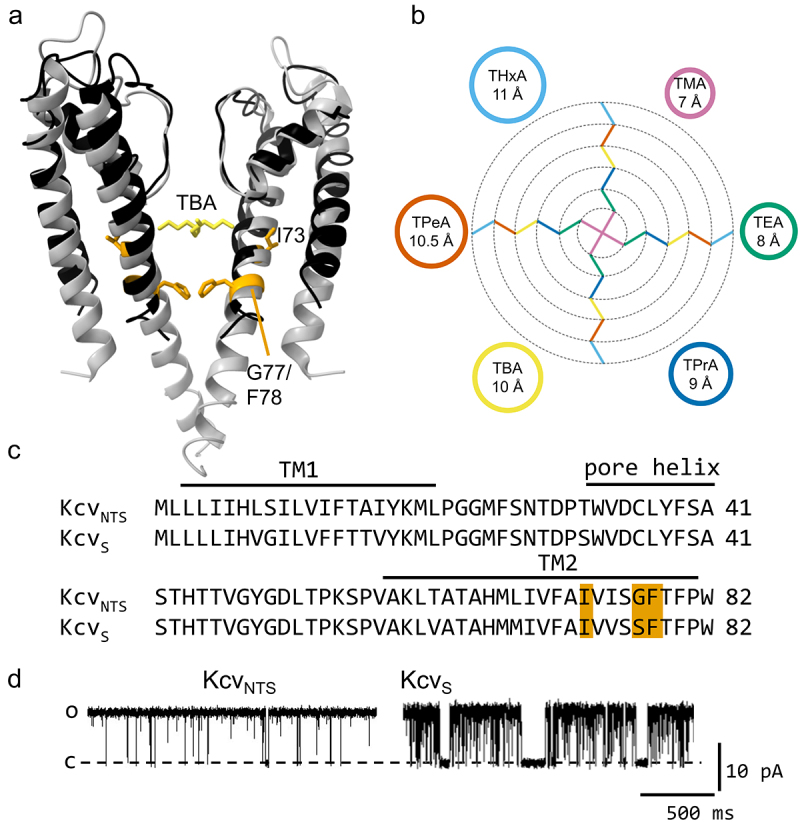
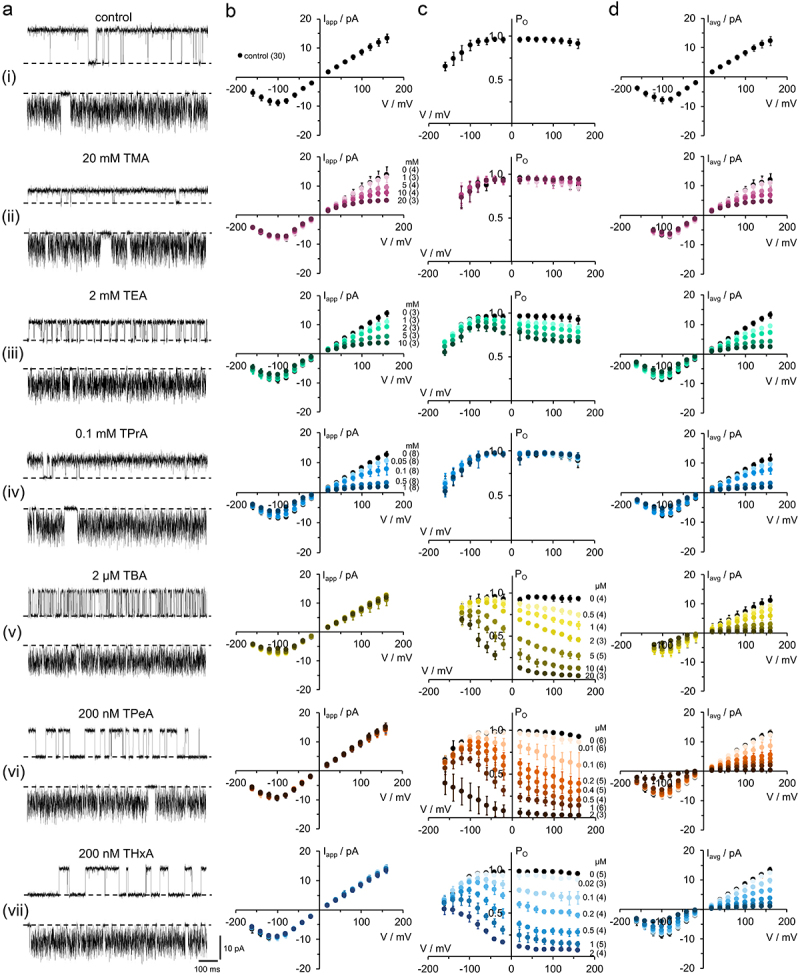
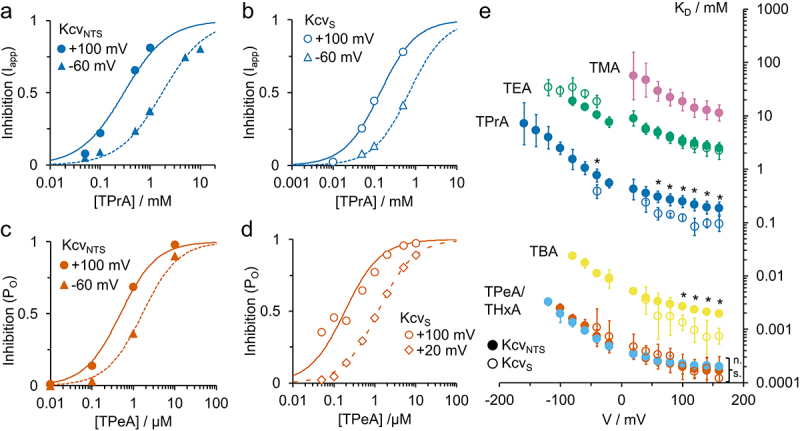
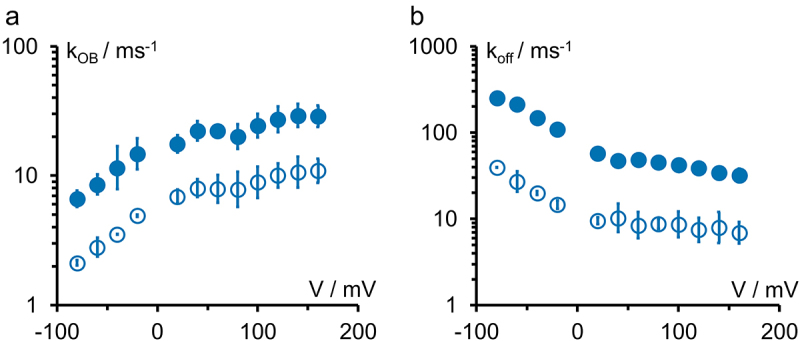
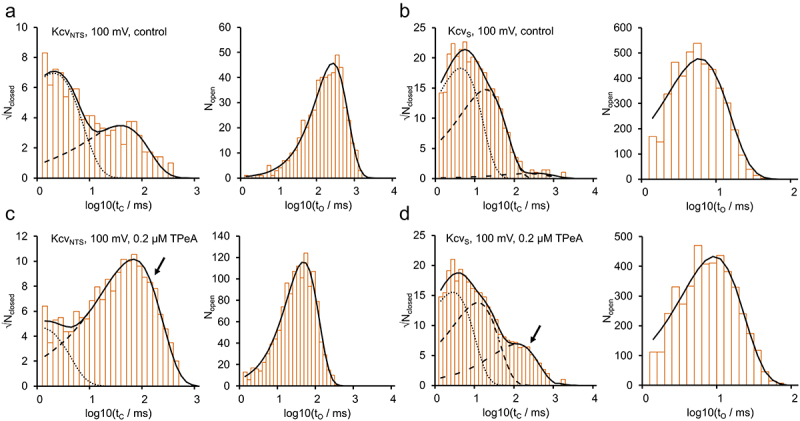
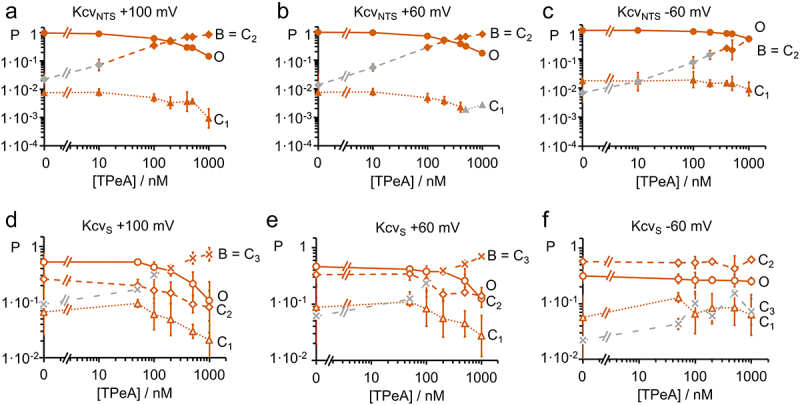
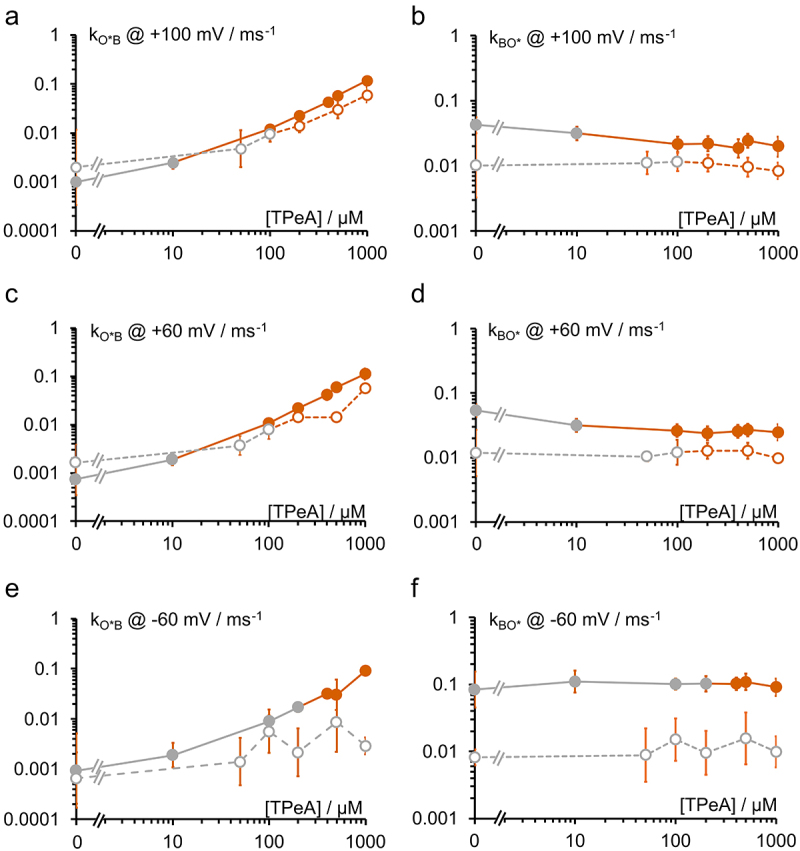
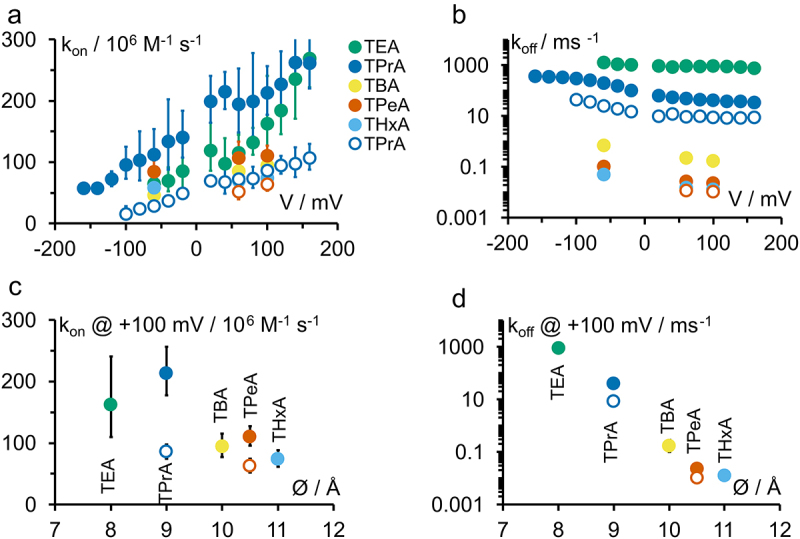
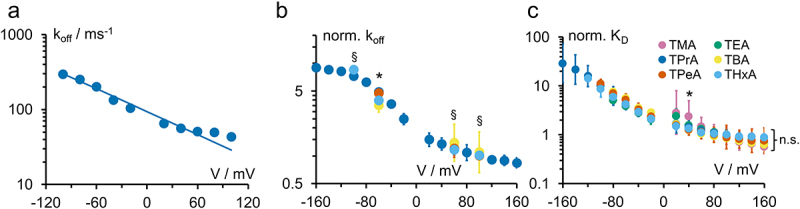
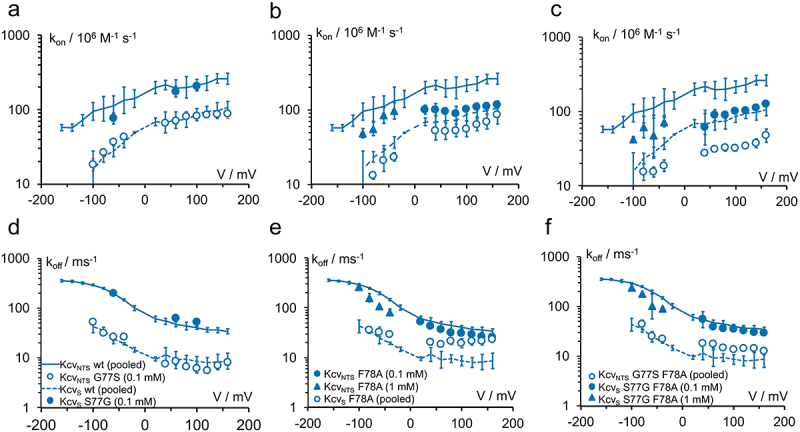
Kcv channels from plant viruses represent the autonomous pore module of potassium channels, devoid of any regulatory domains. These small proteins show very reproducible single-channel behavior in planar lipid bilayers. Thus, they are an optimum system for the study of the biophysics of ion transport and gating. Structural models based on homology modeling have been used successfully, but experimental structural data are currently not available. Here we determine the size of the cytosolic pore entrance by studying the blocker kinetics. Blocker binding and dissociation rate constants ranging from 0.01 to 1000 ms-1 were determined for different quaternary ammonium ions. We found that the cytosolic pore entrance of KcvNTS must be at least 11 Å wide. The results further indicate that the residues controlling a cytosolic gate in one of the Kcv isoforms influence blocker binding/dissociation as well as a second gate even when the cytosolic gate is in the open state. The voltage dependence of the rate constant of blocker release is used to test, which blockers bind to the same binding site.

Keywords: Fast block; blocker; diffusion limitation; planar lipid bilayer; single-channel currents; viral potassium channel.


Conflict of interest statement

No potential conflict of interest was reported by the author(s).

Figures

The figure contains six different Markov models. All are star-shaped with a single open state in the center and all closed states directly connected to the open state. Panel A has the full model with five closed states and the blocked state B. In panels B-F, some states are fused, reducing the number of closed states.
Figure 1.
Markov models used for the fitting of the blocking kinetics. (a) The full Markov model with all states as known so far from previous studies [2,3,29] supplemented by the blocked state B. The states C1, C2 and C3 belong to slow gating with dwell times longer than a millisecond, with C3 occurring only in KcvS due to its cytosolic gate [2]. These states can be analyzed by a jump detector and dwell time analysis. F and M belong to fast gating (dwell-time in F about 5 µs) and medium gating (dwell-time in M is voltage-dependent ranging between 150 µs to 40 µs) [3]. (b, c) The models used for the analysis of fast blockers. C1 - C3 cannot be resolved by the beta distribution analysis and are merged into S (“slow”). (c) For TEA, B has a similar dwell time as F, so the two states cannot be kinetically separated. (b) for TPrA, this separation is possible [7]. (d,e,f) in the experiments with slow blockers, the dwell time in B coincides with one of the slow states C1 - C3. Thus, only two (KcvNTS) or three (KcvS) closed states are detected in the dwell time histograms. The inclusion of B is identified by concentration dependence. O,F,M are merged into an apparent open state O*. Definition: The rate constant of the transition from a state X to a state Y is called kXY. kBO as the rate constant of blocker dissociation is also called koff.
Panel A shows a structural model of KcvNTS overlaid with a model of KcsA. They are very similar. The KcsA model illustrates the position of the blocker TBA in the cavity. Panel B illustrates the blocker structures and sizes used in this paper. Panel C shows an amino acid sequence alignment of the channels KcvNTS and KcvS. Panel D shows representative single-channel current traces of KcvNTS and KcvS at +120 mV. The open probability of KcvS is significantly smaller.
Figure 2.
(a) Comparison of the structure of a homology model for KcvNTS and the structure of the TBA@KcsA complex (pdb code 2HVK), which is used as an illustration of the location of the blocker [41]. Two monomers of the KcsA channel are shown in gray, the TBA ion (yellow) is located inside the cavity. The homology model of KcvNTS on the template structure of KirBac1.1 (1P7B) calculated with Swissmodel [42] is shown in black with the amino acids discussed in this work highlighted in orange. Structures drawn with UCSF chimera [43]. (b) size of quaternary ammonium blockers (QAs), as estimated by [44]. The colors of the alkyl chains refer to the circles with the same color. The same accessible color palette ([45] and https://www.accessiblecolorpalette.com/, accessed June 2024) for the blockers is used in all figures in this work. (c) Sequence alignment of KcvNTS and KcvS. Residues I73, G/S77 and F78 are highlighted in orange. (d) Representative single-channel traces of KcvNTS and KcvS at +120 mV in a DPhPC membrane in 100 mM KCl.
A large figure. Panel A shows representative single-channel current traces of KcvNTS for all blockers used in this study. The slowing down of the block with increasing blocker size can be seen. Panels B-D show the respective single-channel IV curves, open probabilities, and average current for different blocker concentrations. The block is stronger at positive voltages in all cases.
Figure 3.
Blocking properties of KcvNTS by cytosolic QAs. (a) Single-channel fluctuations in DPhPC bilayers in symmetric 100 mM KCl without and with different QAs recorded at +120 mV (upper traces) and −120 mV (lower traces). The closed channel is indicated by a dashed line. The blocker concentrations are given above the traces. (b) Apparent single-channel channel Iapp/V-relations without (black) and with (colored) blocker, concentrations indicated at the curves in either (b) or (c). (c) Apparent open probabilities and (d) time averaged Iavg/V relations with Iavg = Iapp·P0. Mean ± s.D., number of independent recordings is indicated in brackets.
Panels A-B show representative concentration–response curves of single experiments for KcvNTS and KcvS for the blockers TPrA and TPeA. All curves have the typical Hill-shape with a Hill factor of 1. Panel E shows the KD for both channels and all blockers in this study over a voltage range from approximately -100 mV to -160 mV. All KD curves rise to higher values with negative voltages with similar steepness. KD decreases with blocker size. For TPrA and TBA, the KD in KcvS is slightly lower than in KcvNTS.
Figure 4.
Representative concentration response curves of inhibition Inhexp for (a,b) TPrA (9 Å diameter) and (c,d) TPeA (10.5 Å) in (a,c) KcvNTS and in (b,d) KcvS as obtained from the data in Figure 3 and Figure S2, respectively. Fit with Eq. 5. (e) Voltage dependence of apparent KD (as obtained from fits like those in Figure 4a–d) for the different blockers in KcvNTS (filled circles) and KcvS (open circles). TMA: purple, TEA: green, TPrA: dark blue, TBA: yellow, TPeA: light blue, THxA: orange. *: At these voltages, the KD for TPrA and TBA differ significantly from each other in KcvNTS and KcvS. “n.s.:” The KD for TPeA (KcvNTS and KcvS) and TPeA (KcvNTS) do not differ significantly at any voltage. One-parameter ANOVA with threshold p = 0.05.
Panel A shows the rate constant kOB of TPrA binding for KcvNTS and KcvS. The curve for KcvNTS lies higher than that for KcvS. Both rise with positive voltages. Panel B shows the rate constant kBO of TPrA dissociation for KcvNTS and KcvS. The curve for KcvNTS lies higher than that of KcvS. Both decrease with positive voltages.
Figure 5.
Kinetics of the open-state block with TPrA for the two channel isoforms KcvNTS (filled symbols, no cytosolic gate) and KcvS open symbols, with cytosolic gate) (Figure 2a,c). (a) Rate constant kOB of blocker binding and (b) rate constant kBO = koff of blocker release for 0.1 mM cytosolic TPrA. Averages ± sd of three experiments each. The small errors are a typical benefit of Kcv channels.
The figure shows dwell time histograms for both KcvNTS and KcvS with and without the blocker TPeA. All open-time histograms are well fitted with a single exponential function. The closed-time histograms of KcvNTS are well fitted with two exponential functions. With 200 nM TPeA, the amplitude factor for state C2 increases. The closed-time histograms of KcvS are well fitted with three exponential functions. With 200 nM TPeA, the amplitude factor for state C3 increases.
Figure 6.
Dwell-time histograms of (a,c) KcvNTS and (b,d) KcvS under control conditions and blocked by TPeA. Exemplary closed- and open-time histograms at +100 mV for the control (a,b) and 200 nM TPeA (c,d). Open histograms (right hand side in each panel) were fitted by Eq. 1 (black) with a single exponential. Closed time histograms were fitted with a sum (black, continuous line) of two exponentials for KcvNTS or three exponentials for KcvS. Individual components: C1 = dotted, C2 = dashed, C3 = dash-dot. Inclusion of state B in one of the closed states is indicated by the arrows.
Panels A-C show the occupation probabilities of the states O, C1, and C2 for KcvNTS at various TPrA concentrations for +100, +60, and -60 mV. Panels D-F do the same for KcvS with the addition of state C3. In KcvNTS, the probability of C2 rises with TPeA. In KcvS, the probability of C3 rises with TPeA.
Figure 7.
Dependence of occupation probabilities P of the states in the Markov models of Figure 1e or f on TPeA concentration. Association of the blocked state B to C2 (diamonds in (a-c)) or C3 (crosses in (d-f) is based on the dependence of their occupation probabilities on blocker concentration. The occupation probabilities of the open state (PO, circles) and of the two or three closed states (PC1, triangles, PC2, diamonds, and PC3, crosses) are shown for (a,b,c) KcvNTS (filled symbols) and for (d,e,f) KcvS (open symbols) at different TPeA concentrations at (a,d) +100 mV, (b,e) +60 mV and (c,f) −60 mV. Averages ± sd of three experiments each. Orange symbols in the curves related to B mark the concentrations, where the occupation probability of the respective state exceeds 10 times that of the control value and are therefore dominated by B. Grey symbols indicate that this probability is too small for the identification of B. for KcvS at −60 mV, and for both channels at −100 mV (not shown), this threshold was not reached (only gray symbols). The two additional gray triangles in B are data points, where due to the low probability of C1, n = 3 could not be achieved for this state. This did not affect the determination of C2.
Panels A, C, and E show an increase in the binding rate constant kO*B for TPeA for KcvNTS and KcvS at +100, +60, and -60 mV. All increase with higher concentrations. At -60 mV, the block in KcvS could not be analyzed sufficiently well. Panels B, D, and E show the data for the unbinding rate constant kBO*. These curves are horizontal. The values for KcvS are slightly smaller than those for KcvNTS.
Figure 8.
Rate constants of blocking of the open channel (a,c,e) kOB and (b,d,f) kBO as obtained from the dwell time histograms in Figure 6 by means of Eqs. 1 and 3 at −60 mV, +60 mV and +100 mV. Filled symbols: KcvNTS, open symbols; KcvS. Orange symbols are those where the blocked state B dominates the intrinsic closed state, and the rate constants can be taken as a good approximation of the rate constants of blocking. Grey symbols: this condition was not met; the rate constant was not used for further analysis. Mean ± sd of three experiments each.
Panel A shows the on-rates kon for all blockers on both channels plotted over the membrane voltage. They all increase with positive voltages. There is no significant influence of blocker size. Panel B shows the off-rates koff for all blockers on both channels plotted over the membrane voltage. They all increase with negative voltages. There is a large decrease with increasing blocker size. Panels C and D plot the data points for +100 mV over the blocker size. There is no trend for kon, but koff is clearly decreased by increasing blocker size.
Figure 9.
(a,b) Voltage dependence of the rate constants of open-state block (A) kon as calculated by Eq. 6 and (B) koff for different QAs. (c,d) Dependence of (C) kon and (D) koff at +100 mV on blocker diameter estimated by Robinson and Stokes [46]. Filled symbols: KcvNTS, open symbols: KcvS. Colors are defined in (A). Averages +/- sd of three experiments each.
Panel A shows not ideal exponential fit of koff from an experiment in KcvNTS with TPrA. Panel B shows that the curve shape of koff plotted over the voltage is very similar in KcvNTS for different blockers. Panel C shows that also the shape of the KD plotted over the voltage is the same for all blockers.
Figure 10.
(a) Exemplary fit of koff on an KcvNTS data set with 0.5 mM cytosolic TPrA with the equation koff = koff,0·exp(-zδ·FV/RT), zδ = 0.28, koff,0 = 1.05·105 s−1. (b) Overlay of the normalized (see text) koff for TPrA (dark blue), TBA (yellow), TPrA (orange) and THxA (light blue) in KcvNTS. §: No significant difference between the data points at this voltage. *: at least one data point is significantly different from the others. (c) Normalized (see text) KD of all blockers in KcvNTS. A significant difference for at least one of the data points from the others is only found at +40 mV. One-parameter ANOVA with threshold p = 0.05.
This figure shows the on- and off rates for TPrA in KcvNTS and KcvS for the respective wild type and channels that are mutated on positions 77 and/or 78. The data are divided into six panels to avoid overcrowding. Panels A and C show that exchanging Serine and Glycine at position 77 switches the blocking phenotype between the two channels. Panels B and C show that the effect of mutations on position 78, either as single-point mutations or combined with mutations at position 77, is very complex.
Figure 11.
Block by TPrA. Influence of the residues at positions 77 and 78 on the rate constants of (a, b, c) blocker binding kon = kOB/[TPrA] and (d,e,f) release (kBO = koff) in different mutants of KcvNTS and of KcvS. Lines show the wild-type data (KcvNTS: continuous, KcvS: dashed), the symbols indicate the residue at locations 77: G = filled, S = open for the mutants (a,d) S77G and G77S (b,e) F78A and (c,f) the double mutants. “pooled:” wt data averaged over TPrA concentration from 0.05 – 5 mM (KcvNTS) and 0.1 – 1 mM (KcvS), data for KcvNTS S77G F78A averaged over 0.1 & 1 mM. All other blocker concentrations are indicated in the legends. All data points: mean ± sd of at least three experiments each. Because of the decrease of the signal with higher negative voltages, rate constants could not be determined from fitting amplitude histograms for voltages more negative than −80 mV or −60 mV for all mutants and KcvS.

References

    1. Thiel G, Baumeister D, Schroeder I, et al. Minimal art: or why small viral K+ channels are good tools for understanding basic structure and function relations. Biochim Biophys Acta. 2011;1808(2):580–19. doi: 10.1016/j.bbamem.2010.04.008 - DOI - PubMed
    1. Rauh O, Urban M, Henkes LM, et al. Identification of intrahelical bifurcated H-Bonds as a new type of gate in K+ channels. J Am Chem Soc. 2017;139(22):7494–7503. doi: 10.1021/jacs.7b01158 - DOI - PMC - PubMed
    1. Rauh O, Hansen U-P, Scheub DD, et al. Site-specific ion occupation in the selectivity filter causes voltage-dependent gating in a viral K+ channel. Sci Rep. 2018;8(1):10406. doi: 10.1038/s41598-018-28751-w - DOI - PMC - PubMed
    1. Eckert D, Schulze T, Stahl J, et al. A small viral potassium ion channel with an inherent inward rectification. Channels Austin Tex. 2019;13(1):124–135. doi: 10.1080/19336950.2019.1605813 - DOI - PMC - PubMed
    1. Kang M, Graves M, Mehmel M, et al. Genetic diversity in chlorella viruses flanking kcv, a gene that encodes a potassium ion channel protein. Virology. 2004;326:150–159. doi: 10.1016/j.virol.2004.05.023 - DOI - PubMed

MeSH terms

Substances

LinkOut - more resources