. 2024 Nov:77:103390.
doi: 10.1016/j.redox.2024.103390. Epub 2024 Oct 8.

Methionine restriction alleviates diabetes-associated cognitive impairment via activation of FGF21

Affiliations

Methionine restriction alleviates diabetes-associated cognitive impairment via activation of FGF21

Yuyu Zhang et al. Redox Biol. 2024 Nov.

Abstract

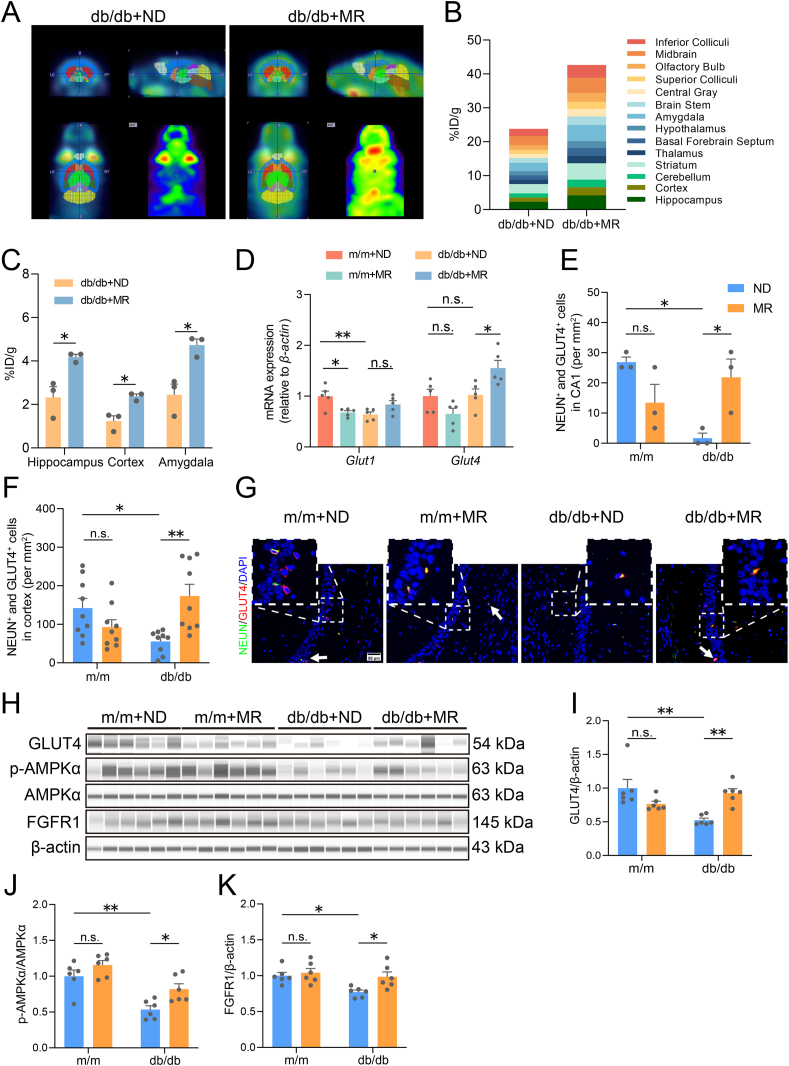
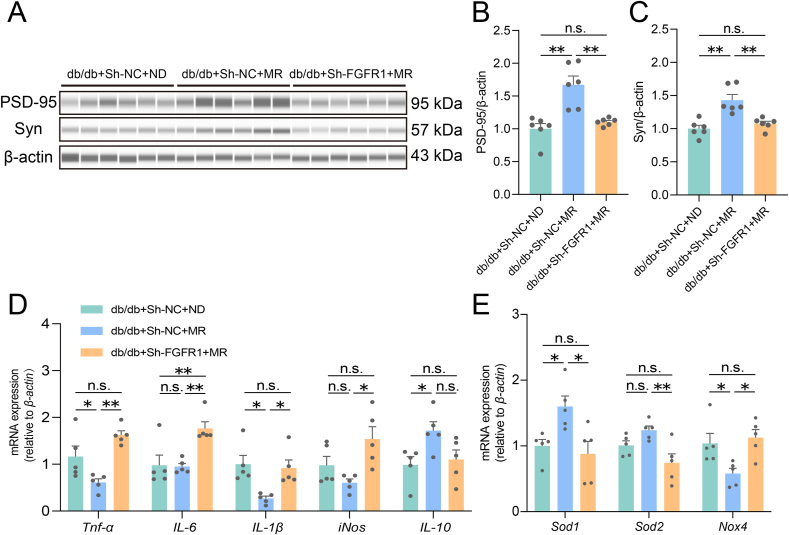
Glucose metabolism disturbances may result in diabetes-associated cognitive decline (DACI). Methionine restriction (MR) diet has emerged as a potential dietary strategy for managing glucose homeostasis. However, the effects and underlying mechanisms of MR on DACI have not been fully elucidated. Here, we found that a 13-week MR (0.17 % methionine, w/w) intervention starting at 8 weeks of age improved peripheral insulin sensitivity in male db/db mice, a model for type 2 diabetes. Notably, MR significantly improved working as well as long-term memory in db/db mice, accompanied by increased PSD-95 level and reduced neuroinflammatory factors, malondialdehyde (MDA), and 8-hydroxy-2'-deoxyguanosine (8-OHdG). We speculate that this effect may be mediated by MR activating hepatic fibroblast growth factor 21 (FGF21) and the brain FGFR1/AMPK/GLUT4 signaling pathway to enhance brain glucose metabolism. To further delineate the mechanism, we used intracerebroventricular injection of adeno-associated virus to specifically knock down FGFR1 in the brain to verify the role of FGFR1 in MR-mediated DACI. It was found that the positive effects of MR on DACI were offset, reflected in decreased cognitive function, impaired synaptic plasticity, upregulated neuroinflammation, and balanced enzymes regulating reactive oxygen species (Sod1, Sod2, Nox4). Of note, the FGFR1/AMPK/GLUT4 signaling pathway and brain glucose metabolism were inhibited. In summary, our study demonstrated that MR increased peripheral insulin sensitivity, activated brain FGFR1/AMPK/GLUT4 signaling through FGF21, maintained normal glucose metabolism and redox balance in the brain, and thereby alleviated DACI. These results provide new insights into the effects of MR diet on cognitive dysfunction caused by impaired brain energy metabolism.

Keywords: AMP-Activated protein kinase; Diabetes-associated cognitive impairment; Fibroblast growth factor 21; Glucose metabolism; Glucose transporter proteins; Methionine restriction.


Conflict of interest statement

Declaration of competing interest The authors declare that they have no known competing financial interests or personal relationships that could have appeared to influence the work reported in this paper.

Figures

Image 1
Graphical abstract
Fig. 1
Fig. 1
Effects of MR on peripheral insulin sensitivity in db/db mice (A) Schematic diagram of a phased protocol for animal experiments; (B) Average food intake/week (n = 6–8); (C) Average water intake/week (n = 6–8); (D) The body weights from weeks 0–13 (n = 6–8); (E) Body weight gain (n = 6–8); (F) Insulin tolerance test (n = 6–8); (G) Area under the curve in insulin tolerance test (n = 6–8); (H) Fasting glucose concentration (n = 6–8); (I) Fasting insulin concentration (n = 6–8); (J) HOMA-IR (n = 6–8). Data were presented as mean ± SEM. ∗p < 0.05, ∗∗p < 0.01, compared with the m/m + ND group, #p < 0.05, ##p < 0.01 compared with the db/db + ND group. Significant differences between mean values were determined by two-way ANOVA with Tukey multiple comparisons test.
Fig. 2
Fig. 2
Effects of MR on cognitive function and synaptic plasticity in db/db mice (A) Representative trajectory images for each group on the fifth test day of the Barnes maze; (B) Escape latency changes in four training days (n = 6–8); (C) Escape latency on fifth test day (n = 6–8); (D) Representative trajectory images for each group on the third test day of the Novel object recognition; (E) Preference index on third test day (n = 6–8); (F) Discrimination index on third test day (n = 6–8); (G) Representative images of H&E and PSD-95 immunofluorescence staining of hippocampal CA1 region in the brain (Scale bar = 50 μm); (H) Quantification of PSD-95 mean fluorescence intensity in the CA1 by ImageJ software (n = 9 from 3 slices per group); (I) Quantification of PSD-95 mean fluorescence intensity in the cortex by ImageJ software (n = 9 from 3 slices per group). Data were presented as mean ± SEM. ∗p < 0.05, ∗∗p < 0.01, compared with the m/m + ND group. Significant differences between mean values were determined by two-way ANOVA with Tukey multiple comparisons test.
Fig. 3
Fig. 3
Effects of MR on neuroinflammation and oxidative stress in db/db mice (A) Representative images of IBA-1 immunofluorescence staining of hippocampal CA1 region (Scale bar = 50 μm); (B) Quantification of IBA-1 positive cells in the CA1 by ImageJ software (n = 3 slices per group); (C) Quantification of IBA-1 positive cells in the cortex by ImageJ software (n = 9 from 3 slices per group); (D) mRNA levels of Tnf-α, IL-6, IL-1β, and IL-10 in the cortex (n = 5); (E) Cortex MDA levels (n = 6–8); (F) Representative images of 8-OHdG immunohistochemistry staining of hippocampal CA1 region (Scale bar = 50 μm); (G) Quantification of numbers of 8-OHdG positive cells in the CA1 by ImageJ software (n = 3 slices per group); (H) Quantification of numbers of 8-OHdG positive cells in the cortex by ImageJ software (n = 9 form 3 slices per group). Data were presented as mean ± SEM. Significant differences between mean values were determined by two-way ANOVA with Tukey multiple comparisons test.
Fig. 4
Fig. 4
Effects of MR on glucose uptake and FGFR1/AMPK/GLUT4 signaling pathway in the brain of db/db mice (A) Representative axial, sagittal, and coronal PET images showing brain uptake with [18F]-FDG; (B) Brain uptake (%ID/g) results from the in vivo biodistribution study in mice during 30–60 min post-injection (n = 3); (C) PET quantification of hippocampus, cortex, and amygdala (n = 3); (D) mRNA levels of Glut1 and Glut4 in the cortex (n = 5); (E) Quantification of NEUN positive and GLUT4 positive cells in the CA1 by ImageJ software (n = 9 from 3 slices per group); (F) Quantification of NEUN positive and GLUT4 positive cells in the cortex by ImageJ software (n = 9 from 3 slices per group); (G) Representative images of NEUN and GLUT4 immunofluorescence staining of hippocampal CA1 region (Scale bar = 50 μm); (H) Representative Western blot of GLUT4, p-AMPKα, AMPKα, FGFR1, and β-actin protein levels in the cortex; (I) Quantification of the Western blot of GLUT4 protein levels relative to β-actin in the cortex (n = 6); (J) Quantification of the Western blot of p-AMPKα protein levels relative to AMPKα in the cortex (n = 6); (K) Quantification of the Western blot of FGFR1 protein levels relative to β-actin in the cortex (n = 6). Data were presented as mean ± SEM. Significant differences between mean values were determined by two-way ANOVA with Tukey multiple comparisons test.
Fig. 5
Fig. 5
Effects of MR on hepatic FGF21 signaling pathway in db/db mice (A) Serum FGF21 levels (n = 5–8); (B) mRNA levels of Fgf21, β-Klotho, Fgfr1, Gcn2, Atf4, and Pparα in the liver (n = 5); (C) Representative images of FGF21 immunohistochemistry staining of liver (Scale bar = 50 μm); (D) Quantification of FGF21 mean fluorescence intensity by ImageJ software (n = 9 from 3 slices per group); (E) Representative Western blot of FGF21 protein levels in the liver; (F) Quantification of the Western blot of FGF21 protein levels relative to β-actin in the liver (n = 6); (G) Cortex FGF21 levels (n = 6–8); (H) mRNA levels of Fgf21, β-Klotho, and Fgfr1 in the cortex (n = 5). Data were presented as mean ± SEM. Significant differences between mean values were determined by two-way ANOVA with Tukey multiple comparisons test.
Fig. 6
Fig. 6
The role of brain FGFR1 in MR mitigating cognitive impairment in db/db mice (A) Schematic diagram of a phased protocol for animal experiments; (B) Insulin tolerance test (n = 7–11); (C) Area under the curve in insulin tolerance test (n = 7–11); (D) HOMA-IR (n = 7–11); (E) Escape latency on fifth test day (n = 7–11); (F) Representative trajectory images for each group on the fifth test day of Barnes maze; (G) Representative trajectory images for each group on the third test day of the Novel object recognition; (H) Escape latency changes in four training days (n = 7–11); (I) Preference index on third test day (n = 7–11); (J) Discrimination index on third test day (n = 7–11). Data were presented as mean ± SEM. ∗p < 0.05, ∗∗p < 0.01, compared with the db/db + Sh-NC + ND group, #p < 0.05, ##p < 0.01 compared with the db/db + Sh-NC + MR group. Significant differences between mean values were determined by one-way ANOVA with Tukey multiple comparisons test.
Fig. 7
Fig. 7
The role of brain FGFR1 in MR mitigating synaptic damage, neuroinflammation, and oxidative stress in db/db mice (A) Representative Western blot of PSD-95, Syn, and β-actin protein levels in the hippocampus; (B) Quantification of the Western blot of PSD-95 protein levels relative to β-actin in the hippocampus (n = 6); (C) Quantification of the Western blot of Syn protein levels relative to β-actin in the hippocampus (n = 6); (D) mRNA levels of Tnf-α, IL-6, IL-1β, iNOS, and IL-10 in the hippocampus (n = 5); (E) mRNA levels of Sod1, Sod2, and Nox4 in the hippocampus (n = 5). Data were presented as mean ± SEM. Significant differences between mean values were determined by one-way ANOVA with Tukey multiple comparisons test.
Fig. 8
Fig. 8
The role of brain FGFR1 in modulating the AMPK/GLUT4 signaling pathway in response to MR (A) mRNA levels of Fgfr1 in the hippocampus (n = 5); (B) mRNA levels of Glut1, Glut4 in the hippocampus (n = 5); (C) Quantification of NEUN positive and GLUT4 positive cells in the hippocampus by ImageJ software (n = 9 from 3 slices per group); (D) Representative images of NEUN and GLUT4 immunofluorescence staining of hippocampal CA1 region (Scale bar = 50 μm); (E) Representative Western blot of FGFR1, p-AMPKα, AMPKα, GLUT4, and β-actin protein levels in the hippocampus; (F) Quantification of the Western blot of FGFR1 protein levels relative to β-actin in the hippocampus (n = 6); (G) Quantification of the Western blot of p-AMPKα protein levels relative to AMPKα in the hippocampus (n = 6); (H) Quantification of the Western blot of GLUT4 protein levels relative to β-actin in the hippocampus (n = 6). Data were presented as mean ± SEM. Significant differences between mean values were determined by one-way ANOVA with Tukey multiple comparisons test.

References

    1. Zheng Y., Ley S.H., Hu F.B. Global aetiology and epidemiology of type 2 diabetes mellitus and its complications. Nat. Rev. Endocrinol. 2018;14:88–98. doi: 10.1038/nrendo.2017.151. - DOI - PubMed
    1. Biessels G.J., Staekenborg S., Brunner E., Brayne C., Scheltens P. Risk of dementia in diabetes mellitus: a systematic review. Lancet Neurol. 2006;5:64–74. doi: 10.1016/s1474-4422(05)70284-2. - DOI - PubMed
    1. M S.S., C D.N. Influence of quercetin, naringenin and berberine on glucose transporters and insulin signalling molecules in brain of streptozotocin-induced diabetic rats. Biomed. Pharmacother. 2017;94:605–611. doi: 10.1016/j.biopha.2017.07.142. - DOI - PubMed
    1. Watt C., Sanchez-Rangel E., Hwang J.J. Glycemic variability and CNS inflammation: reviewing the connection. Nutrients. 2020;12 doi: 10.3390/nu12123906. - DOI - PMC - PubMed
    1. Kahn S.E., Cooper M.E., Del Prato S. Pathophysiology and treatment of type 2 diabetes: perspectives on the past, present, and future. Lancet. 2014;383:1068–1083. doi: 10.1016/s0140-6736(13)62154-6. - DOI - PMC - PubMed

Publication types

LinkOut - more resources