Multicenter Study
. 2024 Nov:109:105373.
doi: 10.1016/j.ebiom.2024.105373. Epub 2024 Oct 8.

Predictive genomic and transcriptomic analysis on endoscopic ultrasound-guided fine needle aspiration materials from primary pancreatic adenocarcinoma: a prospective multicentre study

Collaborators, Affiliations
Multicenter Study

Predictive genomic and transcriptomic analysis on endoscopic ultrasound-guided fine needle aspiration materials from primary pancreatic adenocarcinoma: a prospective multicentre study

Rémy Nicolle et al. EBioMedicine. 2024 Nov.

Abstract

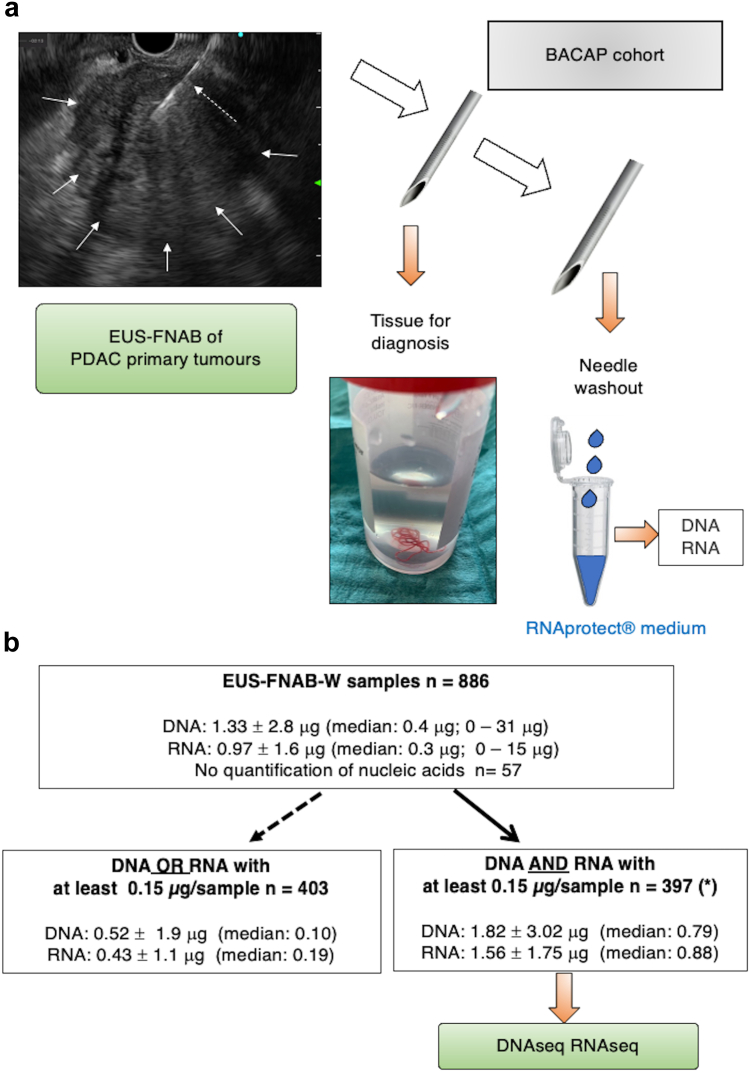
Background: We apply endoscopic ultrasound-guided fine needle aspiration biopsy to cytopathologically diagnose and sample nucleic acids from primary tumours regardless of the disease stage.

Methods: 397 patients with proven pancreatic adenocarcinoma were included and followed up in a multicentre prospective study. DNA and mRNA were extracted from materials of primary tumours obtained by endoscopic ultrasound-guided fine needle aspiration biopsy and analysed using targeted deep sequencing and RNAseq respectively.

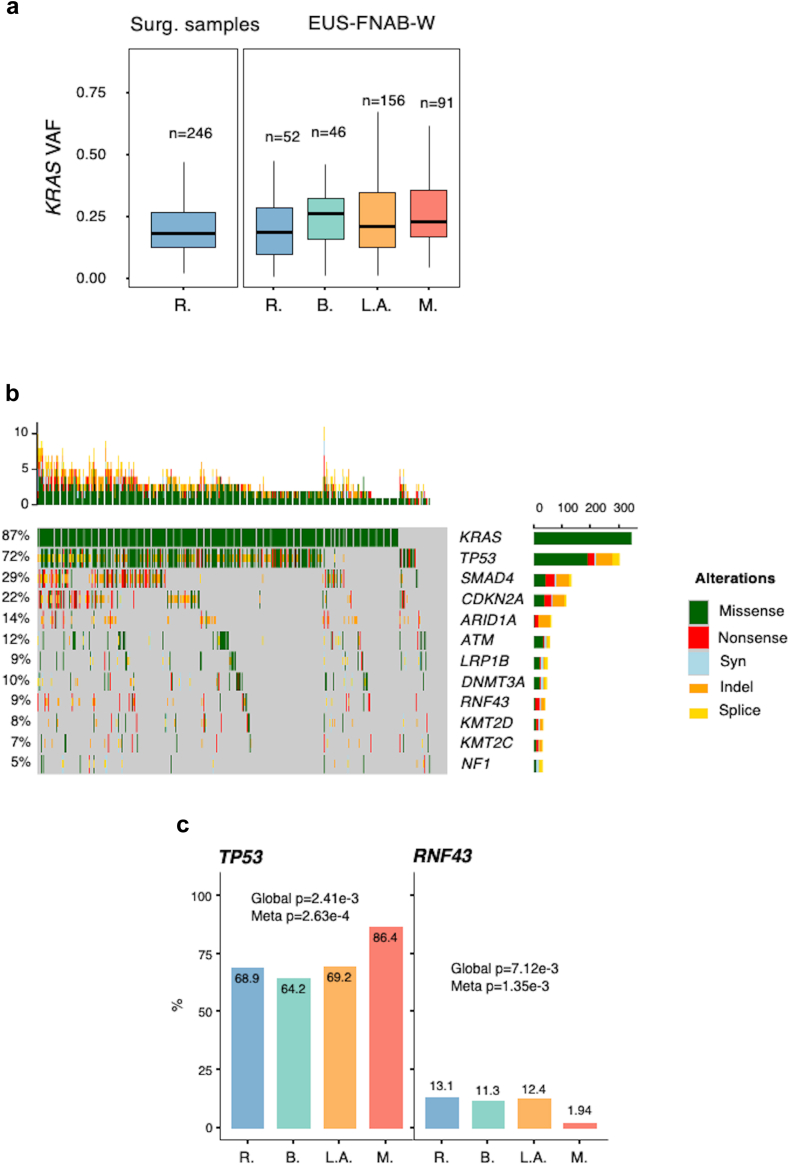
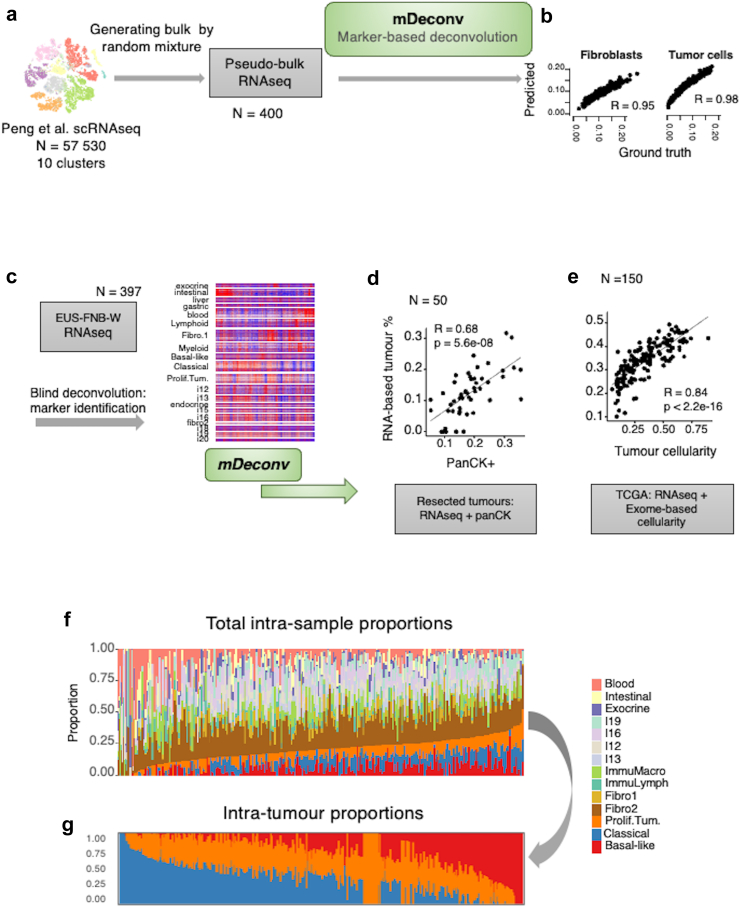
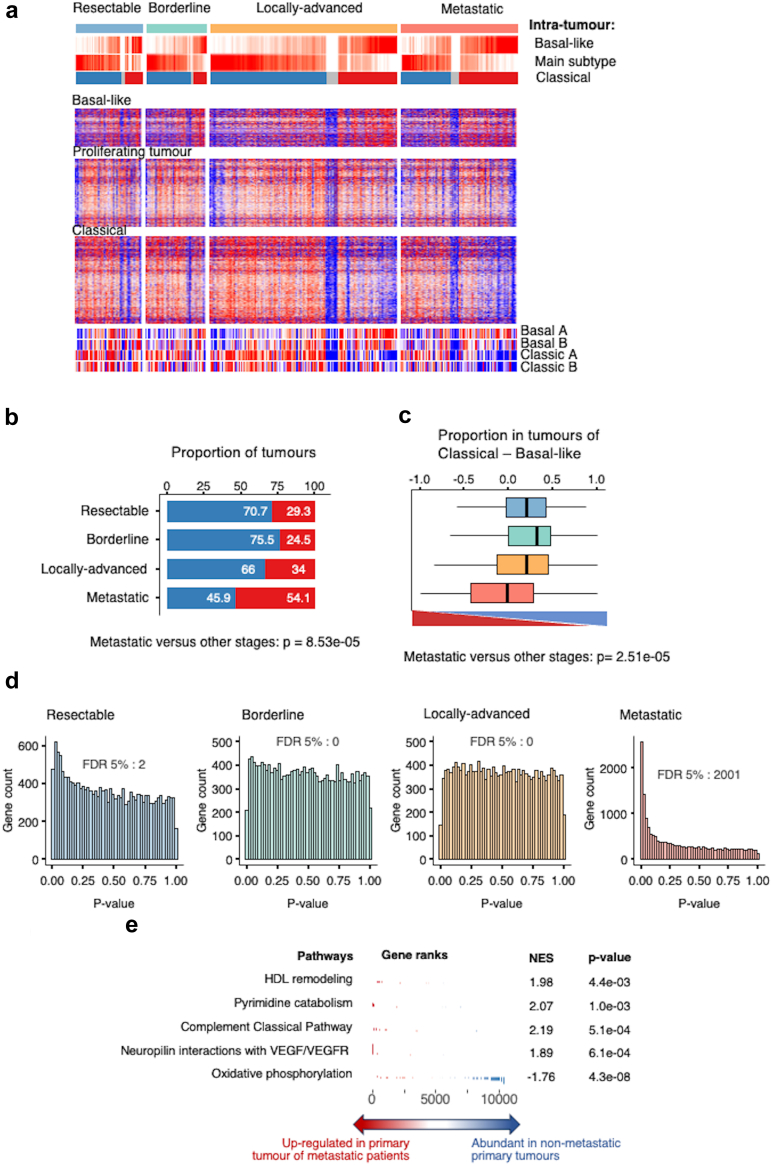
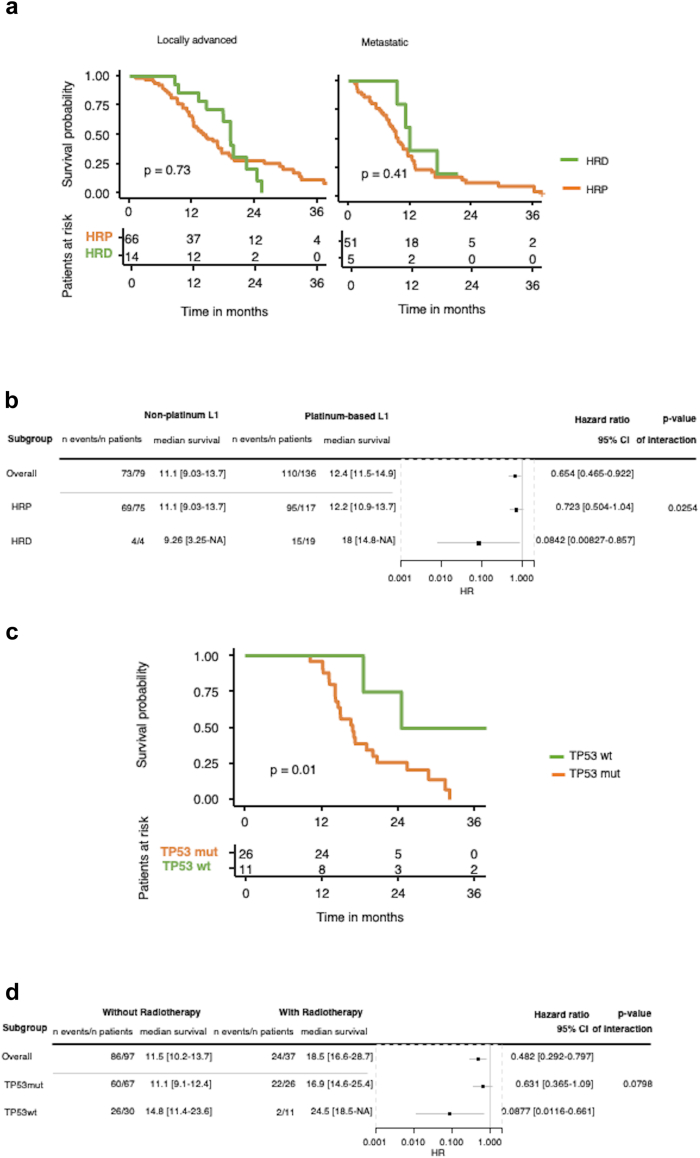
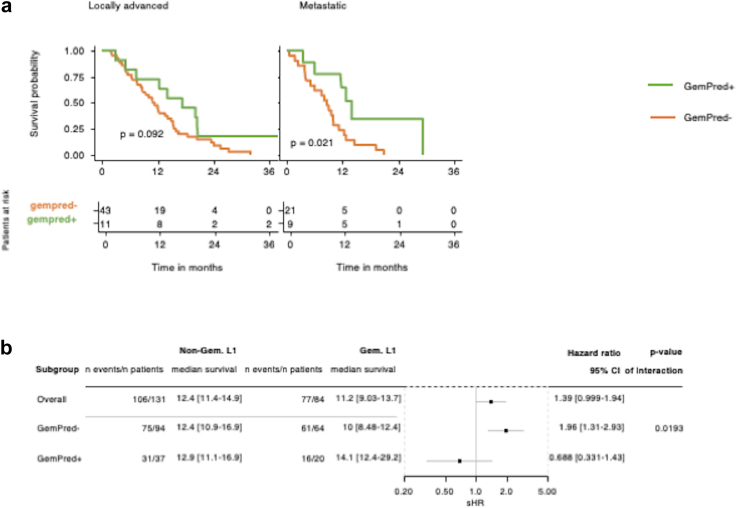
Findings: The variant allele frequency of the KRAS mutation was used to evaluate the tumour cellularity, ranging from 15 to 20% in all cells, regardless of the tumour stage. The molecular profile of metastatic primary tumours significantly differed from other types of tumours, more frequently having TP53 mutations (p = 0.0002), less frequently having RNF43 mutations, and possessing more basal-like mRNA component (p = 0.001). Molecular markers associated with improved overall survival were: mutations in homologous recombination deficiency genes in patients who received first-line platinum-based chemotherapy (p = 0.025) and wild-type TP53 gene in patients with locally advanced tumours who received radio-chemotherapy (p = 0.01). The GemPred transcriptomic profile was associated with a significantly better overall survival in patients with locally advanced or metastatic pancreatic cancer who received a gemcitabine-based first-line treatment (p = 0.019).

Interpretation: The combination of genomic and transcriptomic analyses of primary pancreatic tumours enables us to distinguish metastatic tumours from other tumour types. Our molecular strategy may assist in predicting overall survival outcomes for platinum or gemcitabine-based chemotherapies, as well as radio-chemotherapy.

Funding: Institut National Du Cancer (BCB INCa_7294), CHU of Toulouse, Inserm and Ligue Nationale Contre le Cancer (CIT program).

Keywords: Pancreatic cancer; Predictive medicine; RNA sequencing; Targeted DNA deep sequencing; Translational medicine.


Conflict of interest statement

Declaration of interests Nelson Dusetti is co-owner and inventor for the patent (PCT/EP2022/065222.462) dedicated to predictive medicine for pancreatic cancer. None of the other authors has competing interest in relation to the present work. Investigators implicated in the BACAP consortia received a financial compensation for patient inclusion and data collection from Toulouse Hospital as the sponsor of BACAP cohort funded by a grant from INCa.

Figures

Fig. 1
Fig. 1
Procedure of nucleic acid sampling during endoscopic ultrasound-guided fine needle aspiration biopsy of pancreatic adenocarcinoma primary tumour and subsequent quantification. a: Schematic representation of the BACAP protocol for RNA and DNA sequencing from EUS-FNAB-W (endoscopic ultrasound-guided fine needle aspiration biopsy wash) materials. The tissue is reserved for anatomopathological diagnostics. Thereafter, the needle is washed (by flushing with air) and kept in RNAprotect Cell Reagent® before pellet isolation and storage at −80 °C until subsequent extraction of both DNA and total RNA and then DNA and RNA sequencing, respectively. In the upper left part: EUS view of a PDAC tumour (white arrows) and the needle within the tumour (dashed white arrow). b: Detail of distribution of EUS-FNAB-W samples and quantification of nucleic acids: for each sample, DNA and total RNA were dissolved in 40 and 20 μL, respectively. Total quantification is given for each sub-group (mean ± SD; median and extremes in parenthesis). Among the 886 samples from the BACAP cohort, nucleic acids (DNA and RNA) were not detectable in 57 samples. From the remaining 829 samples, we selected 426 EUS-FNAB-W samples upon a threshold of both DNA and RNA of at least 0.15 μg per sample. Final analyses were performed on 397 samples as 29 samples were in duplicate. For the 403 remaining samples, either DNA or RNA did not reach a threshold of 0.15 μg.
Fig. 2
Fig. 2
Landscape of DNA mutations from EUS-FNAB-W. a: Distributions of the Variant Allele Frequency (VAF) of KRAS mutations in a retrospective series of punched surgical samples (left panel) and in each disease stage of EUS-FNAB-W from the BACAP protocol (right panel). VAF analysis was performed in a total of 345 patients (86.9% of cases). b: Oncoplot of the main mutations found by EUS-FNAB-W of the BACAP protocol. DNA sequencing was performed in a total of 390 patients (98.2% of cases). c: Proportion of patients presenting mutations in TP53 and RNF43 genes in each disease stage (R: resected and/or resectable; B: borderline; L.A.: locally advanced; M: metastatic). (Fisher’s exact test).
Fig. 3
Fig. 3
RNAseq deconvolution. a: Schematic diagram of the deconvolution method mDeconv on a synthetic dataset. Ten cell types obtained from the clustering of 57,530 single cell RNA-seq were randomly sampled and summed to generate 400 synthetic pseudo-bulk RNA-seq. mDeconv was applied blindly to the synthetic dataset and proportions were estimated from the pseudo-bulk RNA-seq. b: Spearman’s correlations are shown, comparing estimated and true mixture proportions for each of the cell types (fibroblasts and tumour cells). c: Schematic diagram of the application of mDeconv on the BACAP EUS-FNAB-W RNA-seq, identifying 20 independent component-based marker sets. d: Application of mDeconv on a dataset of 50 resected tumours with RNA-seq and corresponding pan-cytokeratin-positive area (panCK+). Scatter plot shows the correlation between the panCK+ and the sum of the estimated proportions of the three RNA-seq-based tumour components. e: Application of mDeconv on the TCGA dataset (150 resected primary tumours). Scatter plot shows the correlation between the exome-based and the RNA-seq estimations of tumour proportions. f: Intra-sample proportions of all the relevant RNA components and g: of tumour components only. The results are from the samples from all the 397 patients.
Fig. 4
Fig. 4
RNAseq landscape by disease stage. a: Heatmap of the 392 patients with known disease stage. Patients are arranged according to the difference between the classical and basal-like intra-tumour proportions. Individual gene expression levels from each of the three tumour components are shown. b: Proportion of tumours of each subtype, defined by the main one between basal-like (red) and classical (blue), at each disease stage. Fisher’s exact test indicated that basal-like component is significantly expressed within metastatic primary tumours versus other stages. c: Distribution of the difference between the classical and basal-like intra-tumour proportions in each disease stage (Blue: resectable; green: borderline; orange: locally advanced; light red: metastatic) (bottom of the figure: triangle red “basal-Like”; triangle blue “classical”). The Kruskal–Wallis test was significant with p = 0.00019 and a significant difference between metastatic subgroup versus other stages regarding the presence of “basal-like” component (Mann–Whitney test). d: Mann–Whitney test p-value histograms comparing the expression of 18,220 genes between each disease stage against the rest. The number of genes with an FDR <5% is shown at the bottom. e: Gene set enrichment analysis of the differential gene expression between primary tumour samples from metastatic versus non-metastatic patients.
Fig. 5
Fig. 5
DNA mutational profile and response to treatment. a: Kaplan–Meier curve for patients with locally advanced (left) or metastatic (right) pancreatic cancer who received a platinum-based regimen as first-line treatment (L1), stratified by the mutation status of genes involved in homologous repair (HRD: mutated; HRP: wild type). b: Forest plot of the interaction between platinum-based L1 and HR status among patients with advanced diseases (HRD: mutated; HRP: wild-type) (cox proportional hazards regression model). c: Kaplan–Meier curve for patients with locally advanced pancreatic adenocarcinoma who received a radio-chemotherapy stratified by TP53 mutation status. d: Forest plot of the interaction between radio-chemotherapy and TP53 mutations. All Forest plots and Cox proportional hazards regressions are stratified by disease stage and performance status. (HRD: homologous repair deficient genes; HRP: homologous recombination proficient genes). List of the HR genes is as follow: BRCA2, BRCA1, PALB2, BARD1, BLM, BRIP1, CDK12, CHEK1, CHEK2, FANCC, FANCD2, FANCE, FANCF, FANCI, FANCL, FANCM, MRE11, NBN, RAD51, RAD51B, RAD51C, RAD51D, RAD52, RAD54L, RPA1.
Fig. 6
Fig. 6
Transcriptomic profile and response to treatment. a: Kaplan–Meier curve for patients with locally advanced (left) or metastatic (right) pancreatic cancer who received a gemcitabine-based regimen as first-line treatment (L1), stratified by the transcriptome-based GemPred signature. b: Forest plot of the interaction between gemcitabine-based L1 and GemPred among all patients with advanced diseases (i.e., locally advanced plus metastatic). The Forest plot and Cox proportional hazards regression is stratified by disease stage and performance status.
Supplementary Fig. S1
Supplementary Figure 1: Survival curves of the 397 patients with pancreatic cancer included in the sequenced series of DNA and RNA on endoscopic ultrasound-guided fine needle aspiration biopsy wash of material from primary tumours. a: Progression-free survival. b: Overall survival.

References

    1. Ferlay J., Partensky C., Bray F. More deaths from pancreatic cancer than breast cancer in the EU by 2017. Acta Oncol. 2016;55:1158–1160. - PubMed
    1. Hu Z.I., O’Reilly E.M. Therapeutic developments in pancreatic cancer. Nat Rev Gastroenterol Hepatol. 2024;21:7–24. - PubMed
    1. Neoptolemos J.P., Kleeff J., Michl P., Costello E., Greenhalf W., Palmer D.H. Therapeutic developments in pancreatic cancer: current and future perspectives. Nat Rev Gastroenterol Hepatol. 2018;15:333–348. - PubMed
    1. Kindler H.L., Hammel P., Reni M., et al. Overall survival results from the polo trial: a phase III study of active maintenance olaparib versus placebo for germline BRCA-mutated metastatic pancreatic cancer. J Clin Oncol. 2022;40:3929–3939. - PMC - PubMed
    1. O’Reilly E.M., Lee J.W., Zalupski M., et al. Randomized, multicenter, phase II trial of gemcitabine and cisplatin with or without veliparib in patients with pancreas adenocarcinoma and a germline BRCA/PALB2 mutation. J Clin Oncol. 2020;38:1378–1388. - PMC - PubMed

Publication types

MeSH terms

Substances