. 2024 Oct 15;5(10):101754.
doi: 10.1016/j.xcrm.2024.101754. Epub 2024 Oct 8.

Activated sympathetic nerve post stroke downregulates Toll-like receptor 5 and disrupts the gut mucosal barrier

Affiliations

Activated sympathetic nerve post stroke downregulates Toll-like receptor 5 and disrupts the gut mucosal barrier

Huidi Wang et al. Cell Rep Med. .

Abstract

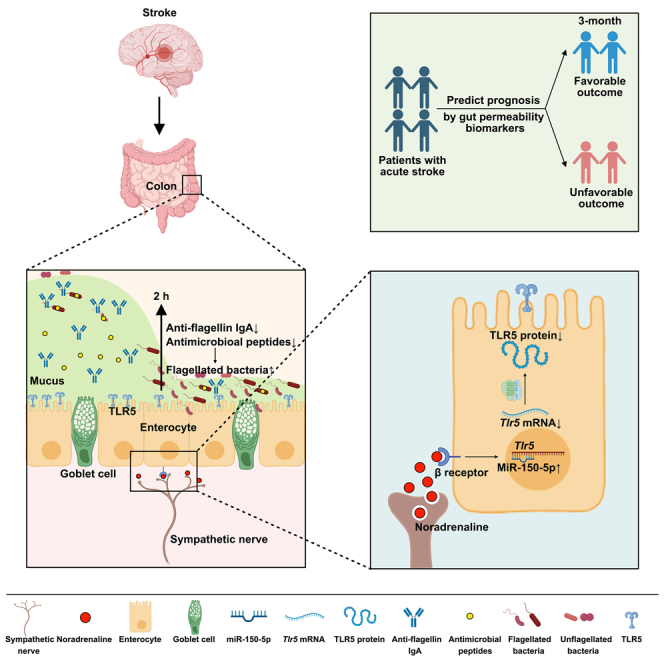
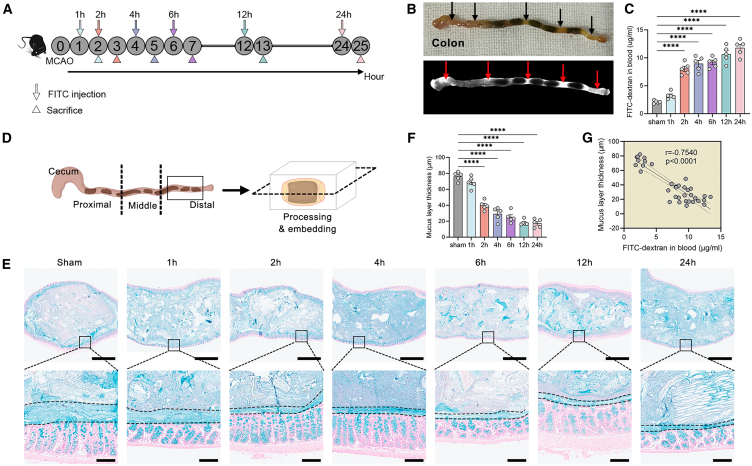
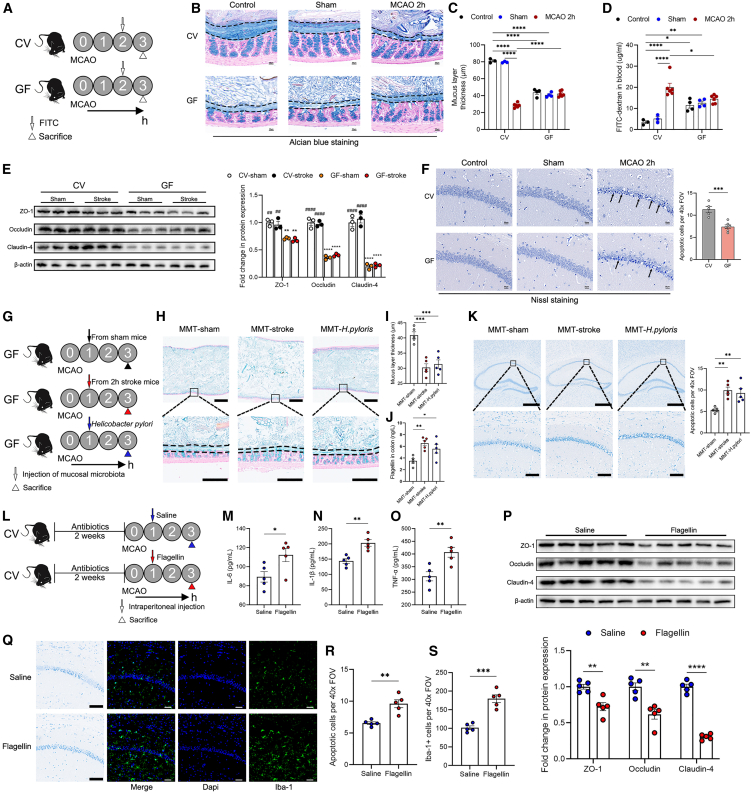
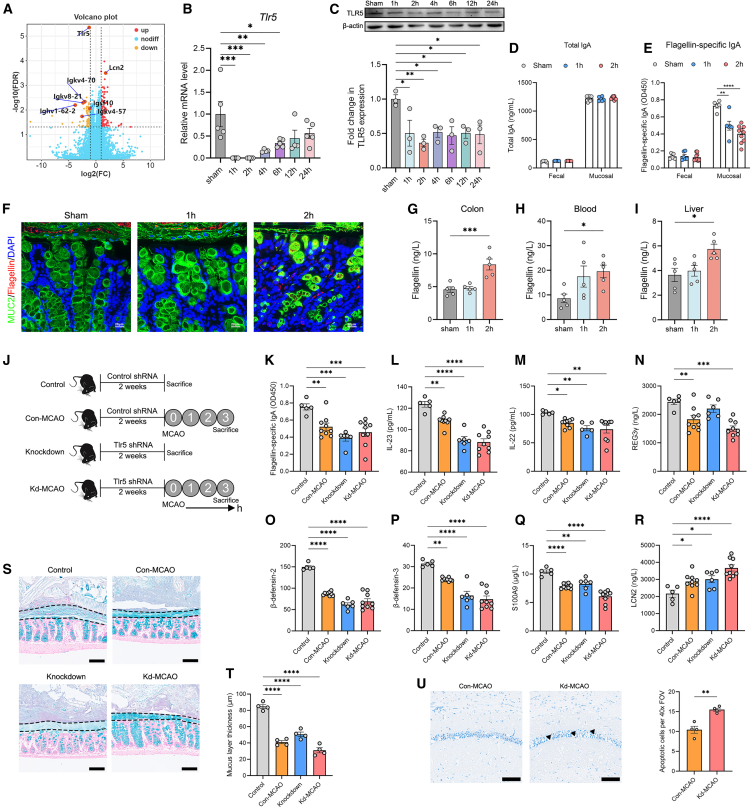
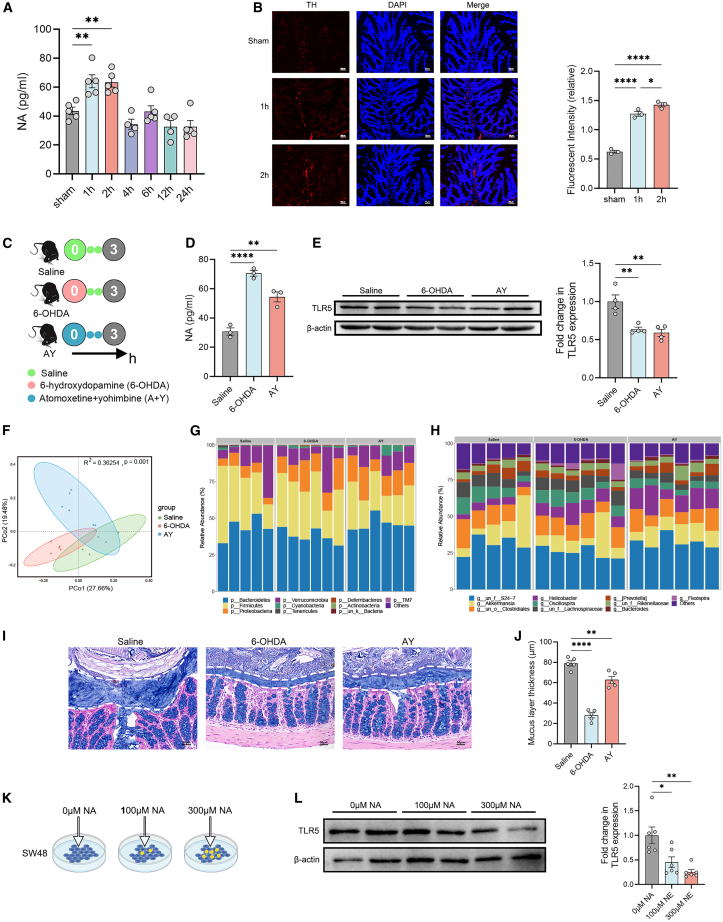
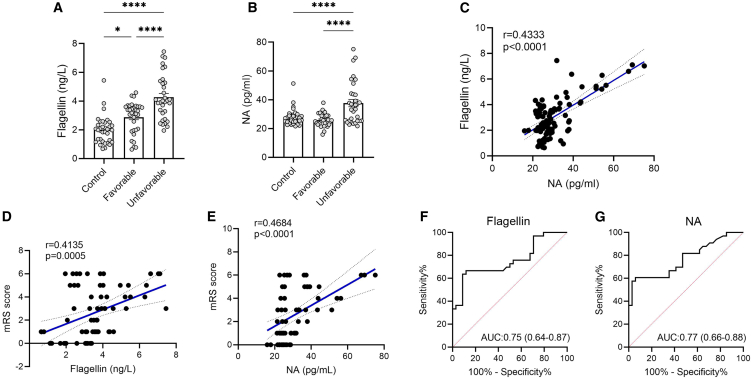
The gut permeability significantly increases after ischemic stroke, partly due to disrupted mucosal barrier, but the mechanism remains elusive. Here, we found that the mucus disruption starts at 2 h post stroke, whereas goblet cell functions remain intact. Meanwhile, the flagellated bacteria Helicobacter thrives and penetrates in the mucus layer. Elimination of the mucosal microbiota or transplantation of Helicobacter in germ-free mice reveals an important role of the mucosal microbiota in mucus disruption. The bacterial invasion is due to downregulated Toll-like receptor 5 (TLR5) and its downstream products flagellin-specific IgA and antimicrobial peptides. Knockdown of intestinal TLR5 increases the abundance of flagellated bacteria and exacerbates mucus injury. Intestinal TLR5 is downregulated by the activation of sympathetic nerve. Serum noradrenaline level is positively associated with flagellin level in patients with stroke and patients' prognosis. These findings reveal a neural pathway in which the sympathetic nerve disrupts the mucosal barrier, providing potential therapeutic targets for stroke injury.

Keywords: Toll-like receptor 5; flagellated bacteria; intestinal barrier; ischemic stroke; mucus layer; sympathetic nerve.


Conflict of interest statement

Declaration of interests The authors declare no competing interests.

Figures

None
Graphical abstract
Figure 1
Figure 1
The disruption of the mucosal barrier contributes to the increased gut permeability after stroke (A) Experimental design. Mice were subjected to cerebral ischemia/reperfusion injury by middle cerebral artery occlusion (MCAO). Fluorescein isothiocyanate (FITC)-labeled dextran was injected to proximal colon of mice at different time points after stroke and its concentration in the blood was measured 1 h after administration. (B) Gross picture of colon and fluorescence image. (C) Concentrations of FITC-dextran in the blood (n = 5). (D) Schematic diagram of tissue sampling, processing, and slicing. (E) Alcian blue-stained sections of the colon with pellet (the mucus layer is defined by the black dashed lines). Scale bars, 1 mm (top); 100 μm (bottom). (F) Thickness of the mucus layer (n = 5). (G) Spearman’s correlations between thickness of the mucus layer and FITC-dextran in the blood. Data were represented as mean ± SEM. Statistical comparison was performed by one-way ANOVA with Dunnett’s multiple comparisons test (C and F). ns, not significant, ∗p < 0.05, ∗∗∗∗p < 0.0001. Please see also Figures S1–S5.
Figure 2
Figure 2
The mucosal microbiota contributes to the disruption of the mucus layer and exacerbation of brain injury (A) Experimental design. Conventional (CV) and germ-free (GF) mice were subjected to MCAO and administrated with FITC at 2 h after cerebral reperfusion, and were sacrificed 1 h after administration. (B and C) Alcian blue-stained sections of the colon with pellet (the mucus layer is defined by the black dashed lines) and measurement of the thickness of the mucus layer (n = 3–6). Scale bars, 30 μm. (D) Concentrations of FITC-dextran in the blood (n = 3–6). (E) Expressions of tight junction proteins in the colonic tissue of mice (n = 3). (F) Nissl staining of apoptotic neurons in the CA1 region of the hippocampus and measurement (n = 5). The black arrows indicate apoptotic neurons with condensed nucleus, concentrated cytoplasm, and disarrangement of cells. Scale bars, 20 μm. (G) Experimental design. Mucosal microbiota samples were collected from sham and 2-h mice. GF mice were subjected to mucosal microbiota transplantation (MMT) by injecting the mucosal microbiota to the proximal colon at 1 h after MCAO, with a group of mice receiving Helicobacter pylori. Mice were sacrificed at 3 h after MCAO. (H and I) Alcian blue-stained sections of the colon with pellet (the mucus layer is defined by the black dashed lines) and measurement of the thickness of the mucus layer (n = 5). Scale bars, 1 mm (top); 250 μm (bottom). (J) Concentrations of flagellin in the colon (n = 5). (K) Nissl staining of apoptotic neurons in the CA1 region of the hippocampus and measurement (n = 5). Scale bars, 500 μm (top); 100 μm (bottom). (L) Experimental design. After antibiotics treatment for 2 weeks, mice were intraperitoneally injected with saline or flagellin at 1 h after cerebral reperfusion, and were sacrificed at 3 h after MCAO. (M–O) Levels of IL-6, IL-1β, and TNF-α in the blood (n = 5). (P) Expressions of tight junction proteins in the brain (n = 5). (Q–S) Nissl staining of apoptotic neurons and immunostaining of Iba-1+ microglia in the CA1 region of the hippocampus and measurement (n = 5). Scale bars, 100 μm (Nissl staining); 50 μm (immunostaining). Data were represented as mean ± SEM. Statistical comparison was performed by two-tailed unpaired Student’s t test (F, M–P, R, and S), two-way ANOVA with Turkey’s multiple comparisons test (C and D) or one-way ANOVA with Dunnett’s multiple comparisons test (E, I–K). ∗p < 0.05, ∗∗p < 0.01, ∗∗∗p < 0.001, ∗∗∗∗p < 0.0001, ##p < 0.01, ####p < 0.0001 versus GF-sham. Please see also Figures S6–S9.
Figure 3
Figure 3
TLR5 is downregulated in the intestine with decreased levels of flagellin-specific IgA and antimicrobial peptides (A) Volcano plot of transcripts from RNA sequencing of the colon of sham versus 2-h group mice. Orange dots were downregulated genes and red dots were upregulated genes in the 2-h group (n = 6) compared with the sham group (n = 6). (B) The gene expression of Tlr5 in the colon (n = 4–5). (C) The protein expression of TLR5 in the colon (n = 3). (D and E) The levels of total IgA and flagellin-specific IgA in the luminal content and mucosal layer of the colon (n = 5–10). (F) Double immunostaining of MUC2 and flagellin in the colon. Red arrows indicate the flagellated bacteria. Scale bars, 20 μm. (G–I) Measurements of flagellin concentrations in the colon, blood, and liver (n = 5). (J) Experimental design. Mice were injected with AAV2/9-U6-tlr5 shRNA-CMV-EGFP-WPRES (knockdown group) to knock down TLR5; control mice were injected with AAV2/9-U6-NC shRNA-CMV-EGFP-WPRES (control group) once a week for 2 weeks, after which mice were subjected to MCAO and sacrificed. (K–R) The levels of (L) IL-23 and (M) IL-22 in the colon and levels of (K) flagellin-specific IgA, (N) regenerating islet-derived protein 3γ (REG3γ), (O) β-defensin-2, (P) β-defensin-3, (Q) S100A9, and (R) lipocalin-2 (LCN2) in the mucus. (S and T) Alcian blue-stained sections of the colon with pellet (the mucus layer is defined by the black dashed lines) and measurement of the thickness of the mucus layer (n = 4). Scale bars, 100 μm. (U) Nissl staining of apoptotic neurons in the CA1 region of the hippocampus and measurement (n = 4). The triangles indicate apoptotic neurons with condensed nucleus, concentrated cytoplasm, and disarrangement of cells. Scale bars, 100 μm. Data were represented as mean ± SEM. Statistical comparison was performed by two-tailed unpaired Student’s t test (U), or one-way ANOVA with Dunnett’s multiple comparisons test. ∗p < 0.05, ∗∗p < 0.01, ∗∗∗p < 0.001, ∗∗∗∗p < 0.0001. Please see also Figures S11–S13.
Figure 4
Figure 4
Noradrenaline released by intestinal sympathetic nerve downregulates the expression of TLR5 (A) Measurements of noradrenaline (NA) concentration in the colon tissue of mice (n = 4–5). (B) Immunostaining of tyrosine hydroxylase (TH)+ sympathetic NA fibers in the colon of mice (n = 3). Scale bars, 30 μm. (C) Experimental design. Mice were intraperitoneal injected with 6-hydroxydopamine (6-OHDA) followed by two consecutive injection of saline every hour. Another group of mice was intraperitoneally injected with atomoxetine and yohimbine (A + Y) every hour for three consecutive times. The control mice were intraperitoneally injected with saline. (D) Measurement of NA concentration in the colon tissue of mice (n = 3). (E) Expression of TLR5 in the colon of mice after treatment (n = 3). (F) PCoA of the mucosal microbiota composition based on Bray-Curtis distance in mice (n = 5–6). (G and H) Relative abundance of mucosal microbiota from individual samples at the (G) phylum level and (H) genus level. (I and J) Alcian blue staining of colonic tissue with pellet and measurement of the thickness of the mucus layer (n = 5). Scale bar, 30 μm. (K) Experimental design. SW48 cells that originated from the colon were supplemented with different concentrations of NA, and the expressions of TLR5 were analyzed after 2 h of treatment. (L) Expression of TLR5 in SW48 cell cultures (n = 6). Data were represented as mean ± SEM. Statistical comparison was performed by one-way ANOVA with Dunnett’s multiple comparisons test. ∗p < 0.05, ∗∗p < 0.01, ∗∗∗p < 0.001, ∗∗∗∗p < 0.0001. Please see also Figures S14–S17.
Figure 5
Figure 5
Serum biomarkers for gut permeability are associated with prognosis in patients (A and B) Measurements of serum flagellin and NA concentrations in controls (N = 34), patients with ischemic stroke with a favorable outcome (N = 34), and those with an unfavorable outcome (N = 33). (C) Spearman’s correlations between serum flagellin level and NA concentrations. (D and E) Spearman’s correlations between serum flagellin, NA concentrations, and modified Rankin Scale (mRS) score. (F and G) The ROC curve of serum flagellin and NA at acute stage of stroke as predictors for prognosis at 3 months. Data were represented as mean ± SEM. Statistical comparison was performed by one-way ANOVA with Dunnett’s multiple comparisons test. ∗p < 0.05, ∗∗∗∗p < 0.0001. Please see also Figures S18 and S19.

References

    1. GBD 2019 Stroke Collaborators Global, regional, and national burden of stroke and its risk factors, 1990-2019: a systematic analysis for the Global Burden of Disease Study 2019. Lancet Neurol. 2021;20:795–820. doi: 10.1016/s1474-4422(21)00252-0. - DOI - PMC - PubMed
    1. Feigin V.L., Owolabi M.O., World Stroke Organization–Lancet Neurology Commission Stroke Collaboration Group Pragmatic solutions to reduce the global burden of stroke: a World Stroke Organization-Lancet Neurology Commission. Lancet Neurol. 2023;22:1160–1206. doi: 10.1016/s1474-4422(23)00277-6. - DOI - PMC - PubMed
    1. Saini V., Guada L., Yavagal D.R. Global Epidemiology of Stroke and Access to Acute Ischemic Stroke Interventions. Neurology. 2021;97 doi: 10.1212/wnl.0000000000012781. S6–s16. - DOI - PubMed
    1. Hankey G.J. Stroke. Lancet. 2017;389:641–654. doi: 10.1016/s0140-6736(16)30962-x. - DOI - PubMed
    1. Chamorro Á., Dirnagl U., Urra X., Planas A.M. Neuroprotection in acute stroke: targeting excitotoxicity, oxidative and nitrosative stress, and inflammation. Lancet Neurol. 2016;15:869–881. doi: 10.1016/s1474-4422(16)00114-9. - DOI - PubMed

LinkOut - more resources