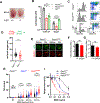
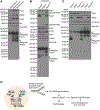
. 2024 Oct 17;84(20):3916-3931.e7.
doi: 10.1016/j.molcel.2024.09.020. Epub 2024 Oct 8.

Inactive Parp2 causes Tp53-dependent lethal anemia by blocking replication-associated nick ligation in erythroblasts

Affiliations

Inactive Parp2 causes Tp53-dependent lethal anemia by blocking replication-associated nick ligation in erythroblasts

Xiaohui Lin et al. Mol Cell. .

Abstract

Poly (ADP-ribose) polymerase (PARP) 1 and 2 enzymatic inhibitors (PARPi) are promising cancer treatments. But recently, their use has been hindered by unexplained severe anemia and treatment-related leukemia. In addition to enzymatic inhibition, PARPi also trap PARP1 and 2 at DNA lesions. Here we report that, unlike Parp2-/- mice, which develop normally, mice expressing catalytically inactive Parp2 (E534A and Parp2EA/EA) succumb to Tp53- and Chk2-dependent erythropoietic failure in utero, mirroring Lig1-/- mice. While DNA damage mainly activates PARP1, we demonstrate that DNA replication activates PARP2 robustly. PARP2 is selectively recruited and activated by 5'-phosphorylated nicks (5'p-nicks), including those between Okazaki fragments, resolved by ligase 1 (Lig1) and Lig3. Inactive PARP2, but not its active form or absence, impedes Lig1- and Lig3-mediated ligation, causing dose-dependent replication fork collapse, which is detrimental to erythroblasts with ultra-fast forks. This PARylation-dependent structural function of PARP2 at 5'p-nicks explains the detrimental effects of PARP2 inactivation on erythropoiesis, shedding light on PARPi-induced anemia and the selection for TP53/CHK2 loss.

Keywords: 5′p-nicks; Lig1; PARP inhibition; PARP inhibitor; PARP2; anemia; erythropoiesis; hematological toxicity.


Conflict of interest statement

Declaration of interests D.M. is a scientific editor for Molecular Cell and therefore was not involved in the peer review or the decision-making process of this manuscript.

Figures

Figure 1.
Figure 1.. Parp2EA/EA mice are embryonic lethal with severe fetal liver erythropoiesis defects.
(A) Upper: Genotype from Parp2+/EA intercrossing. Lower: images of E13.5 Parp2+/+, Parp2+/EA, Parp2EA/EA and Parp2−/− embryos. (B) FL cellularity of Parp2+/+, Parp2−/− and Parp2EA/EA embryos. (C) The counts of TER119+ and B220+ FL cells in Parp2+/+, Parp2−/− and Parp2EA/EA embryos. (D) Flow cytometry analyses of E13.5 Parp2+/+, Parp2−/−, and Parp2EA/EA FLs. The histograms show TER119+ cells %. CD71 and TER119 staining determine the stage of erythropoiesis of B220-Thy1.2-Gr-1-CD11b- live cells. S0, CD71-TER119Low; S1, CD71+TER119Low; S2, CD71+TER119Mid; S3, CD71+TER119High. CD44 and TER119 staining were followed by CD44 and FSC gating to determine the erythropoiesis differentiation stages of B220-Thy1.2-Gr-1-CD11b-TER119+ live cells. I, TER119MidCD44High; (II-IV), were gated based on the progressive decrease of CD44 and FSC from TER119High cells. (E) The absolute number of S0-S3 cells in the FL of E13.5 Parp2+/+, Parp2−/− and Parp2EA/EA embryos. (F) Genotype distribution from Parp2+/EA and Parp2+/− crossing. (G) The absolute counts of red blood cells, myeloid, and B cells in the BM from Parp2+/+, Parp2+/−, Parp2−/−, and Parp2-/EA mice. (H) Red blood cell count, (I) White blood cell count and (J) Mean corpuscular volume (MCV) in peripheral blood from Parp2+/+, Parp2+/−, Parp2−/−, and Parp2-/EA mice. The means ± SEM are shown for all bar graphs. See also Figures S2 and S3.
Figure 2.
Figure 2.. Parp2-E534A blocks cell cycle progression in FL cells.
(A) Flow cytometry analysis of the cell cycle of S0-S3 cells from E13.5 Parp2+/+, Parp2−/− and Parp2EA/EA FLs. Dot plots show the percentage of G0/G1, S, and G2/M cells, and the histograms show BrdU levels in mid-7AAD of S3 cells. (B) Quantification of S phase (BrdU+) cell percentage in S0-S3 FLs. Each dot represents an individual embryo. (C) Relative median fluorescence intensity (MFI) of BrdU in S3 S phase cells from E13.5 Parp2+/+, Parp2−/−, and Parp2EA/EA FLs. (D) Quantification of the S/G1 ratio and (E) G2/M % among S0-S3 cells from E13.5 Parp2+/+, Parp2−/−, and Parp2EA/EA FLs. The means ± SEM are shown for all the bar graphs. See also Figure S3.
Figure 3.
Figure 3.. Loss of Tp53 or Chk2 rescues the lethal anemia in Parp2EA/EA mice.
(A) Genotype from Parp2+/EA; Chk2+/− intercrossing and Parp2+/EA; p53+/− intercrossing. (B) Images of E13.5 Parp2+/+, Parp2EA/EA, Chk2−/−, Parp2EA/EA;Chk2−/−, Tp53−/− and Parp2EA/EA;Tp53−/− embryos. (C) TER119+ cell counts from the E13.5 Parp2+/+, Parp2EA/EA, Parp2EA/EA;Chk2−/− and Parp2EA/EA;Tp53−/− FLs. (D) Left: flow cytometry analyses of E13.5 Parp2+/+, Parp2EA/EA, Parp2EA/EA; Chk2−/− and Parp2EA/EA; Tp53−/− FLs cells. The histograms show the TER119+ % among live cells, and the dot plots show S0-S3 cell % in FL. Right: The cell cycle analyses of Parp2+/+, Parp2EA/EA, Parp2EA/EA; Chk2−/− and Parp2EA/EA; Tp53−/− FL S3 cells. Dot plots show G0/G1%, S%, and G2/M% and the histograms show the distribution of BrdU in mid-7AAD of S3 cells. (E) Relative median BrdU intensity of S3 S-phase cells from E13.5 Parp2+/+, Parp2EA/EA, Parp2EA/EA; Chk2−/− and Parp2EA/EA; Tp53−/− FLs. The means ± SEM are shown for all the bar graphs. See also Figure S3.
Figure 4.
Figure 4.. Parp2-E534A induces replication-dependent genomic instability in FL cells.
(A) The fork length (IdU track) of in vitro cultured E13.5 Parp2+/EA and Parp2EA/EA FL cells. (25 µM CldU for 10 min, then 200 µM IdU for 20 min). At least 100 fibers per sample were quantified. (B) The alkaline comet tail moments in E13.5 Parp2+/+, Parp2−/− and Parp2EA/EA FLs. At least 75 cells per sample were quantified. (C) The alkaline comet tail moment in E13.5 Parp2+/+ and Parp2EA/EA FLs with 1hr BrdU pulse-label. The tail moments of BrdU+ or BrdU- FL cells were quantified separately. (D) BrdU comet tail moment measuring nascent DNA on cultured E13.5 Parp2+/EA, Parp2EA/EA, Chk2−/− and Parp2EA/EA; Chk2−/− FL cells (pulse-labeled with 100 µM BrdU for 30 min and chase for 1.5 h chase and scored after anti-BrdU staining). (E) Neutral comet tail moments of E13.5 Parp2+/+, Parp2−/− and Parp2EA/EA FL cells. At least 100 fibers per sample were quantified. (F) Flow cytometry analysis and (G) quantification of γH2AX+ cells of E13.5 Parp2+/+, Parp2EA/EA, Chk2−/− and Parp2EA/EA; Chk2−/− FL cells. For the bar and scatter dot graphs, the means ± SEM were shown. See also Figure S4.
Figure 5.
Figure 5.. Inactive PARP2 impairs DNA replication by blocking LIG1-mediated nick ligation.
(A) The gel image (left) and quantification (right) of in vitro LIG1 mediated nick-ligation +/− purified PARP2 WT or E545A +/− NAD+. About 0.5 pmol of nicked DNA substrate was preincubated with or without 2 pmol of PARP2 before exposure to 0.25 pmol of DNA LIG1. The average and standard errors of the three reactions were shown. (B) Proliferation of Parp2+/+, Parp2EA/EA, Chk2−/− and Parp2EA/EA; Chk2−/− primary MEFs measured by MTT assay. (C) IdU track lengths show the replication fork speed in Parp2+/+, Parp2−/−, and Parp2EA/EA primary MEFs (25 µM CldU for 20 min and 200 µM IdU for 1 h). At least 100 fibers per sample were quantified. Independent repeats were shown in fig.S4G (D) Neutral comet tail moments of Parp2+/+, Parp2−/− and Parp2EA/EA primary MEFs. At least 100 fibers per sample were quantified. (E) Representative SMLM images of a Parp2+/+ primary MEF nucleus pulse-labeled with EdU (yellow) for 10 min followed by immunostaining for Pcna (blue), and LIG1 (magenta). Scale bar: Whole nuclei = 2500 nm and inset = 100 nm. (F) Fraction of Pcna clusters associated with Lig1 within a 40 nm radius in Parp2+/+, Parp2−/−, and Parp2EA/EA primary MEFs. Individual data points represent values from a single nucleus determined by DBSCAN/NND analysis. n>30 nuclei were analyzed in three independent biological replicates. For all the scatter dot graphs and bar graphs, the means ± SEM were shown. See also Figure S4.
Figure 6.
Figure 6.. Inactive PARP2 impedes LIG3-mediated DNA ligation.
(A) Images of Lig1+/− and Lig1−/− embryos at E13.5. (B) The TER119+ and B220+ cell counts in E13.5 Parp2+/+, Parp2EA/EA, and Lig1−/− FLs. (C) Flow cytometry analyses of E13.5 Parp2+/+, Parp2EA/EA, and Lig1−/− FL cells. The histograms show TER119+% among live cells, and the dot plots show S0-S3 RBC% in FLs. (D) The replication fork length (IdU track) of cultured E13.5 Lig1+/+ and Lig1−/− FLs (25 µM CldU for 10 min and then 200 µM IdU for 20 min). At least 75 fibers per sample were quantified. (E) Images and (F&G) the maximal relative intensity of EGFP-LIG3 (F) and mRFP-XRCC1 (G) at DNA damage sites (405 nm micro-irradiation). Scale bar=2.5 μm. (H) Alkaline comet tail moments of Parp2+/+, Parp2−/− and Parp2EA/EA iMEFs treated with 0.1 mg/ml MMS for 10, 20, and 30 min. (I) The sensitivity of Parp2+/+, Parp2−/−, and Parp2EA/EA iMEFs to MMS. Cells were treated with MMS for 30 min, washed and incubated in a drug-free medium for 5 days. For all the scatter dot graphs and bar graphs, the means ± SEM were shown. See also Figure S6.
Figure 7.
Figure 7.. Parp2 PARylation is enriched in the fetal liver and reduced by MMS.
(A) Western blot of endogenous Parp1 and Parp2 PARylation in E13.5 fetal body and FL. Fetal body #1 and FL #1 were from the same embryo. Embryos #1 and #2 were littermates. (B) Western blot of endogenous Parp1 and Parp2 PARylation in E13.5 Parp2+/+, Parp2−/−, and Parp2EA/EA FLs. (C) Western blot to analyze the endogenous and MMS-induced (0.1 mg/ml MMS for 1 h) PARylation of Parp1 and Parp2 in Parp2+/+, Parp2−/−, and Parp2EA/EA iMEFs. (D) The working model shows that inactive PARP2 blocks Lig1 and/or Lig3 mediated nick-ligation at lagging strands or during BER/NER to causes replication fork stalling and collapse in erythroblasts, Chk2 and Tp53 activation and erythropoiesis failure.

Update of

References

    1. Barkauskaite E, Jankevicius G, and Ahel I (2015). Structures and Mechanisms of Enzymes Employed in the Synthesis and Degradation of PARP-Dependent Protein ADP-Ribosylation. Mol Cell 58, 935–946. 10.1016/j.molcel.2015.05.007. - DOI - PubMed
    1. Caldecott KW (2022). DNA single-strand break repair and human genetic disease. Trends Cell Biol. 10.1016/j.tcb.2022.04.010. - DOI - PubMed
    1. Farmer H, McCabe N, Lord CJ, Tutt AN, Johnson DA, Richardson TB, Santarosa M, Dillon KJ, Hickson I, Knights C, et al. (2005). Targeting the DNA repair defect in BRCA mutant cells as a therapeutic strategy. Nature 434, 917–921. nature03445 [pii] 10.1038/nature03445. - DOI - PubMed
    1. Bryant HE, Schultz N, Thomas HD, Parker KM, Flower D, Lopez E, Kyle S, Meuth M, Curtin NJ, and Helleday T (2005). Specific killing of BRCA2-deficient tumours with inhibitors of poly(ADP-ribose) polymerase. Nature 434, 913–917. nature03443 [pii] 10.1038/nature03443. - DOI - PubMed
    1. LaFargue CJ, Dal Molin GZ, Sood AK, and Coleman RL (2019). Exploring and comparing adverse events between PARP inhibitors. Lancet Oncol 20, e15–e28. 10.1016/S1470-2045(18)30786-1. - DOI - PMC - PubMed

MeSH terms