. 2024 Dec:124:111454.
doi: 10.1016/j.cellsig.2024.111454. Epub 2024 Oct 9.

Induction, amplification, and propagation of diabetic retinopathy-associated inflammatory cytokines between human retinal microvascular endothelial and Müller cells and in the mouse retina

Affiliations

Induction, amplification, and propagation of diabetic retinopathy-associated inflammatory cytokines between human retinal microvascular endothelial and Müller cells and in the mouse retina

Dolly Ann Padovani-Claudio et al. Cell Signal. 2024 Dec.

Abstract

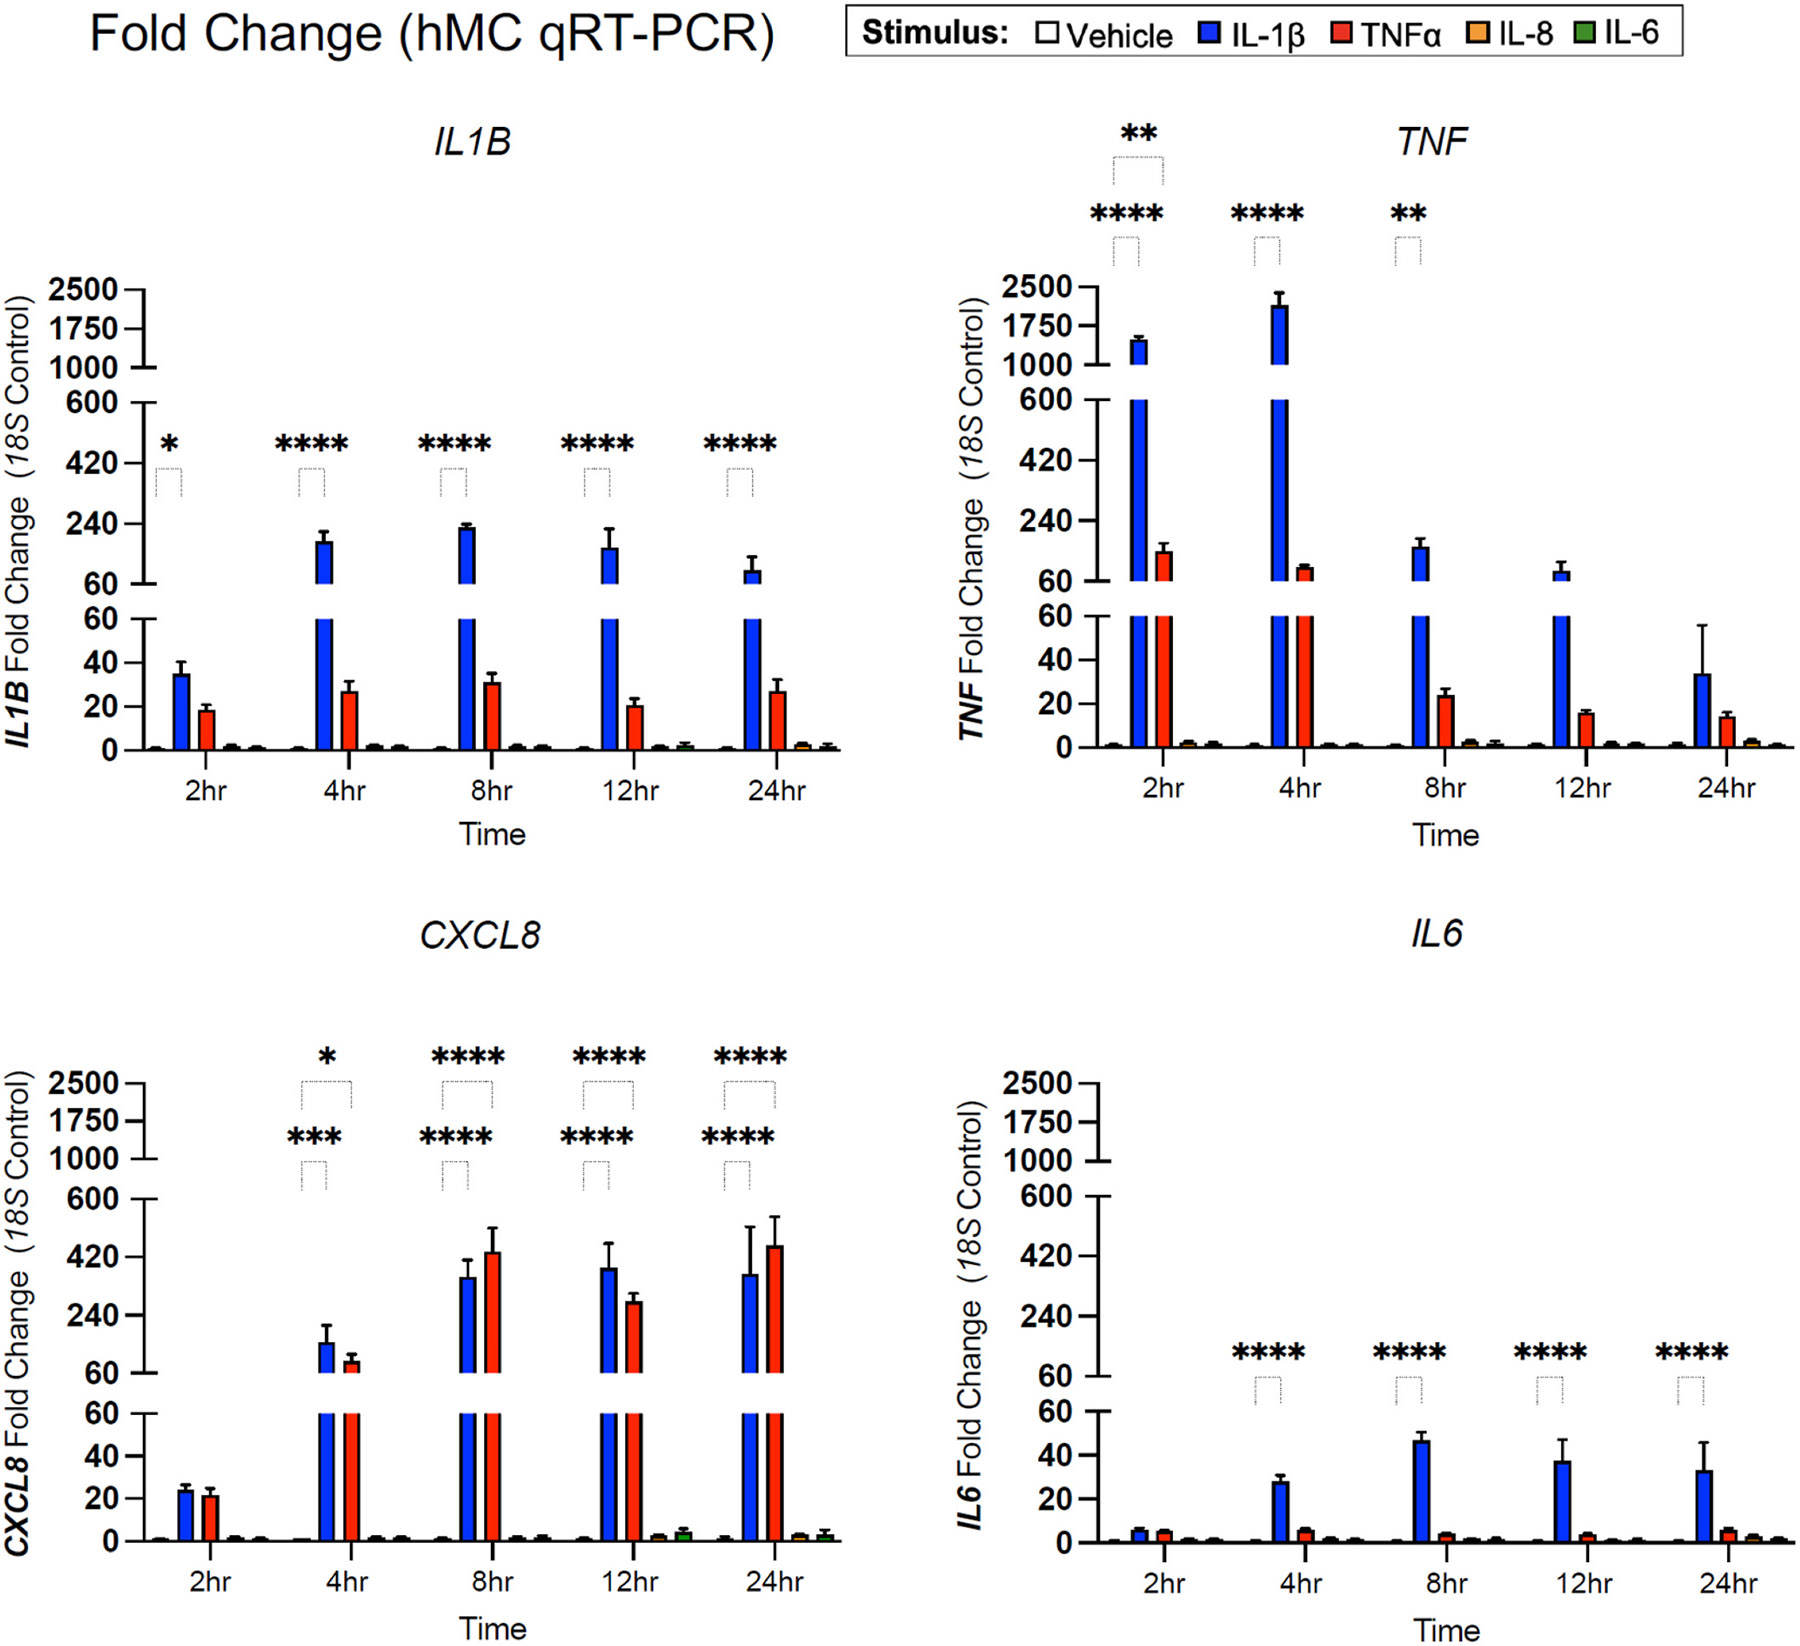
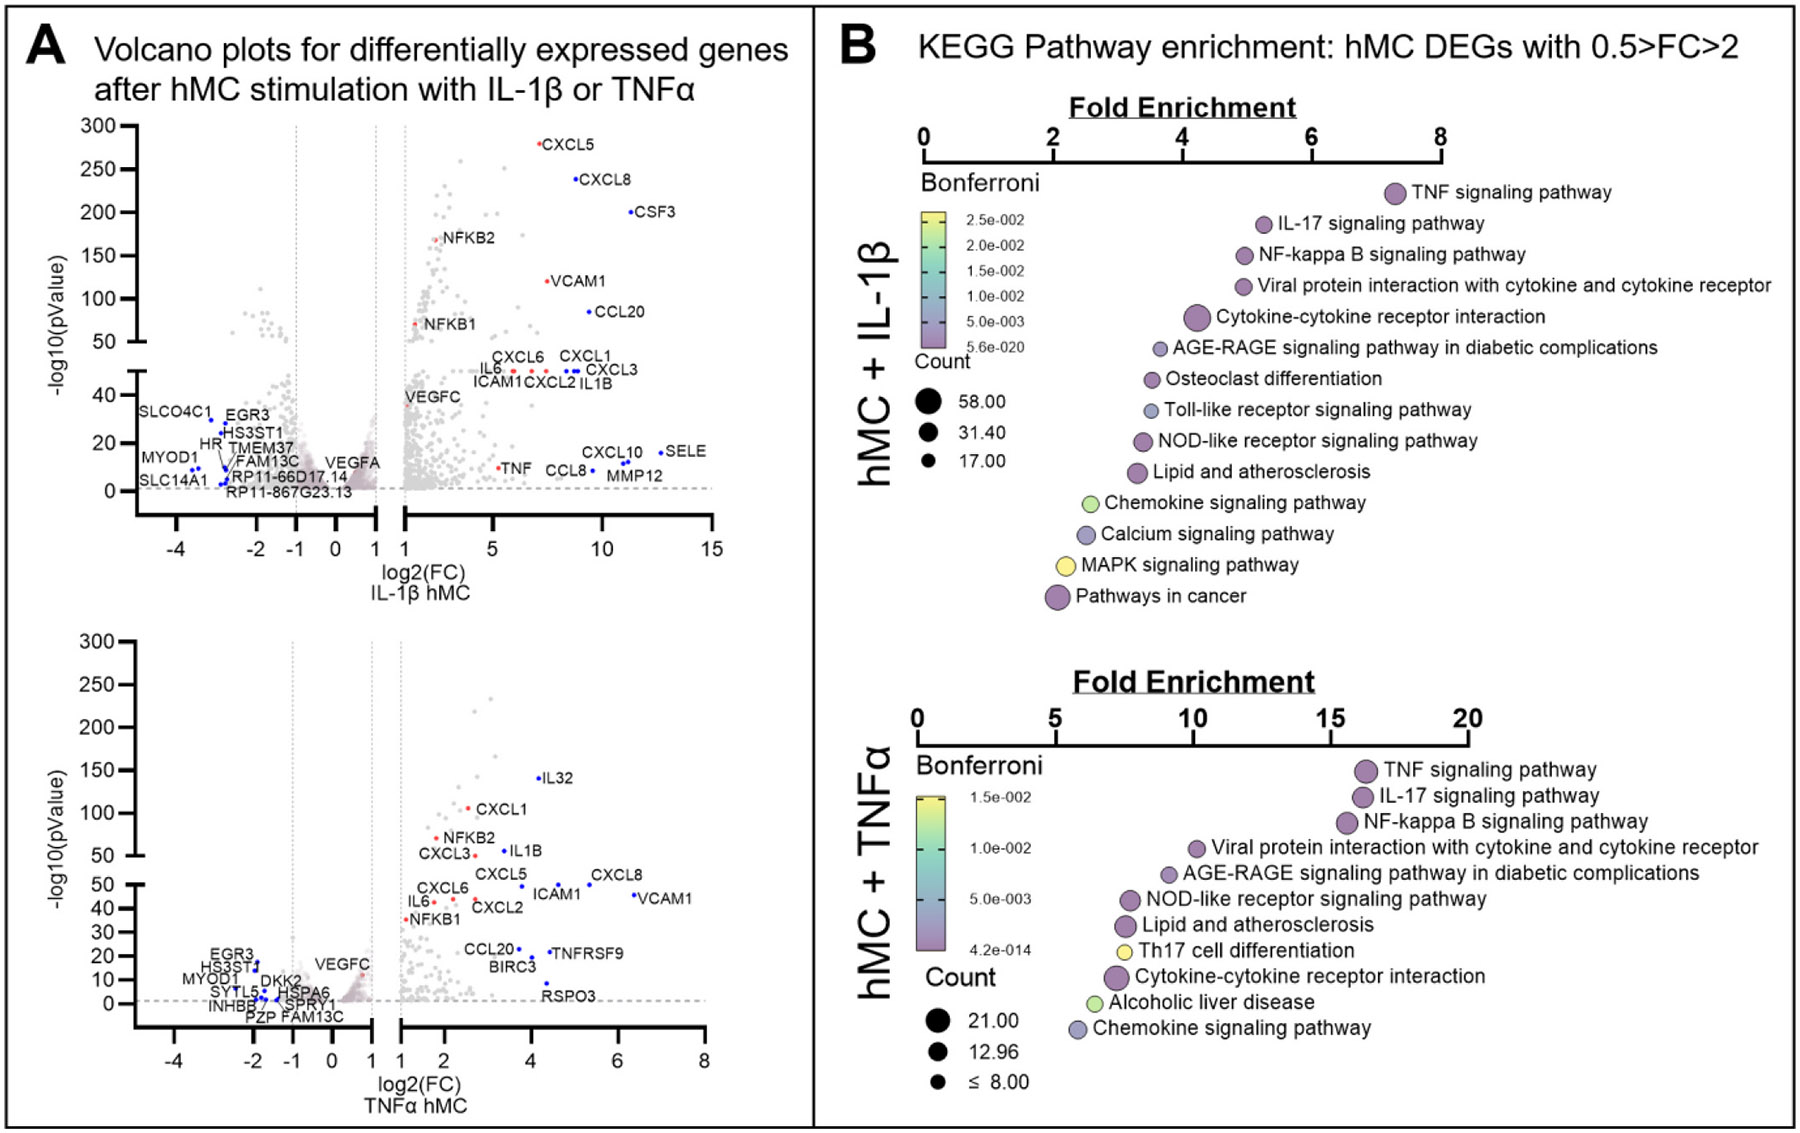
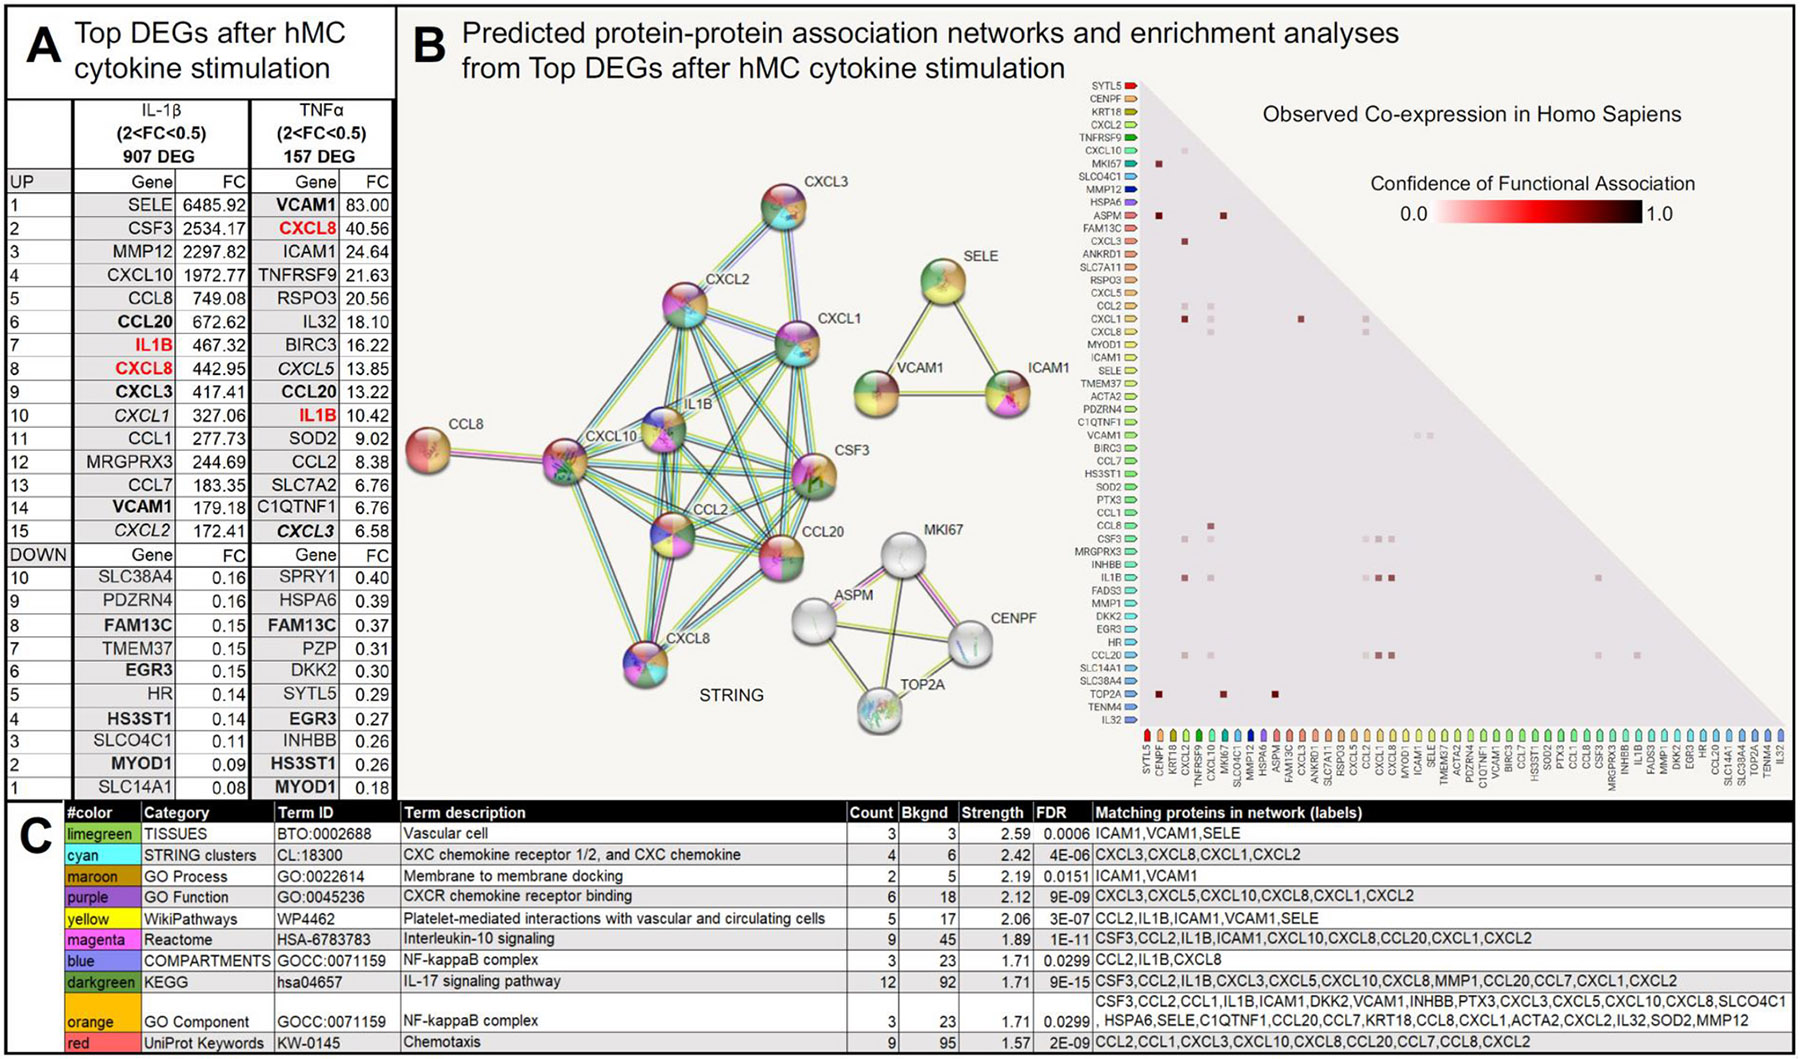
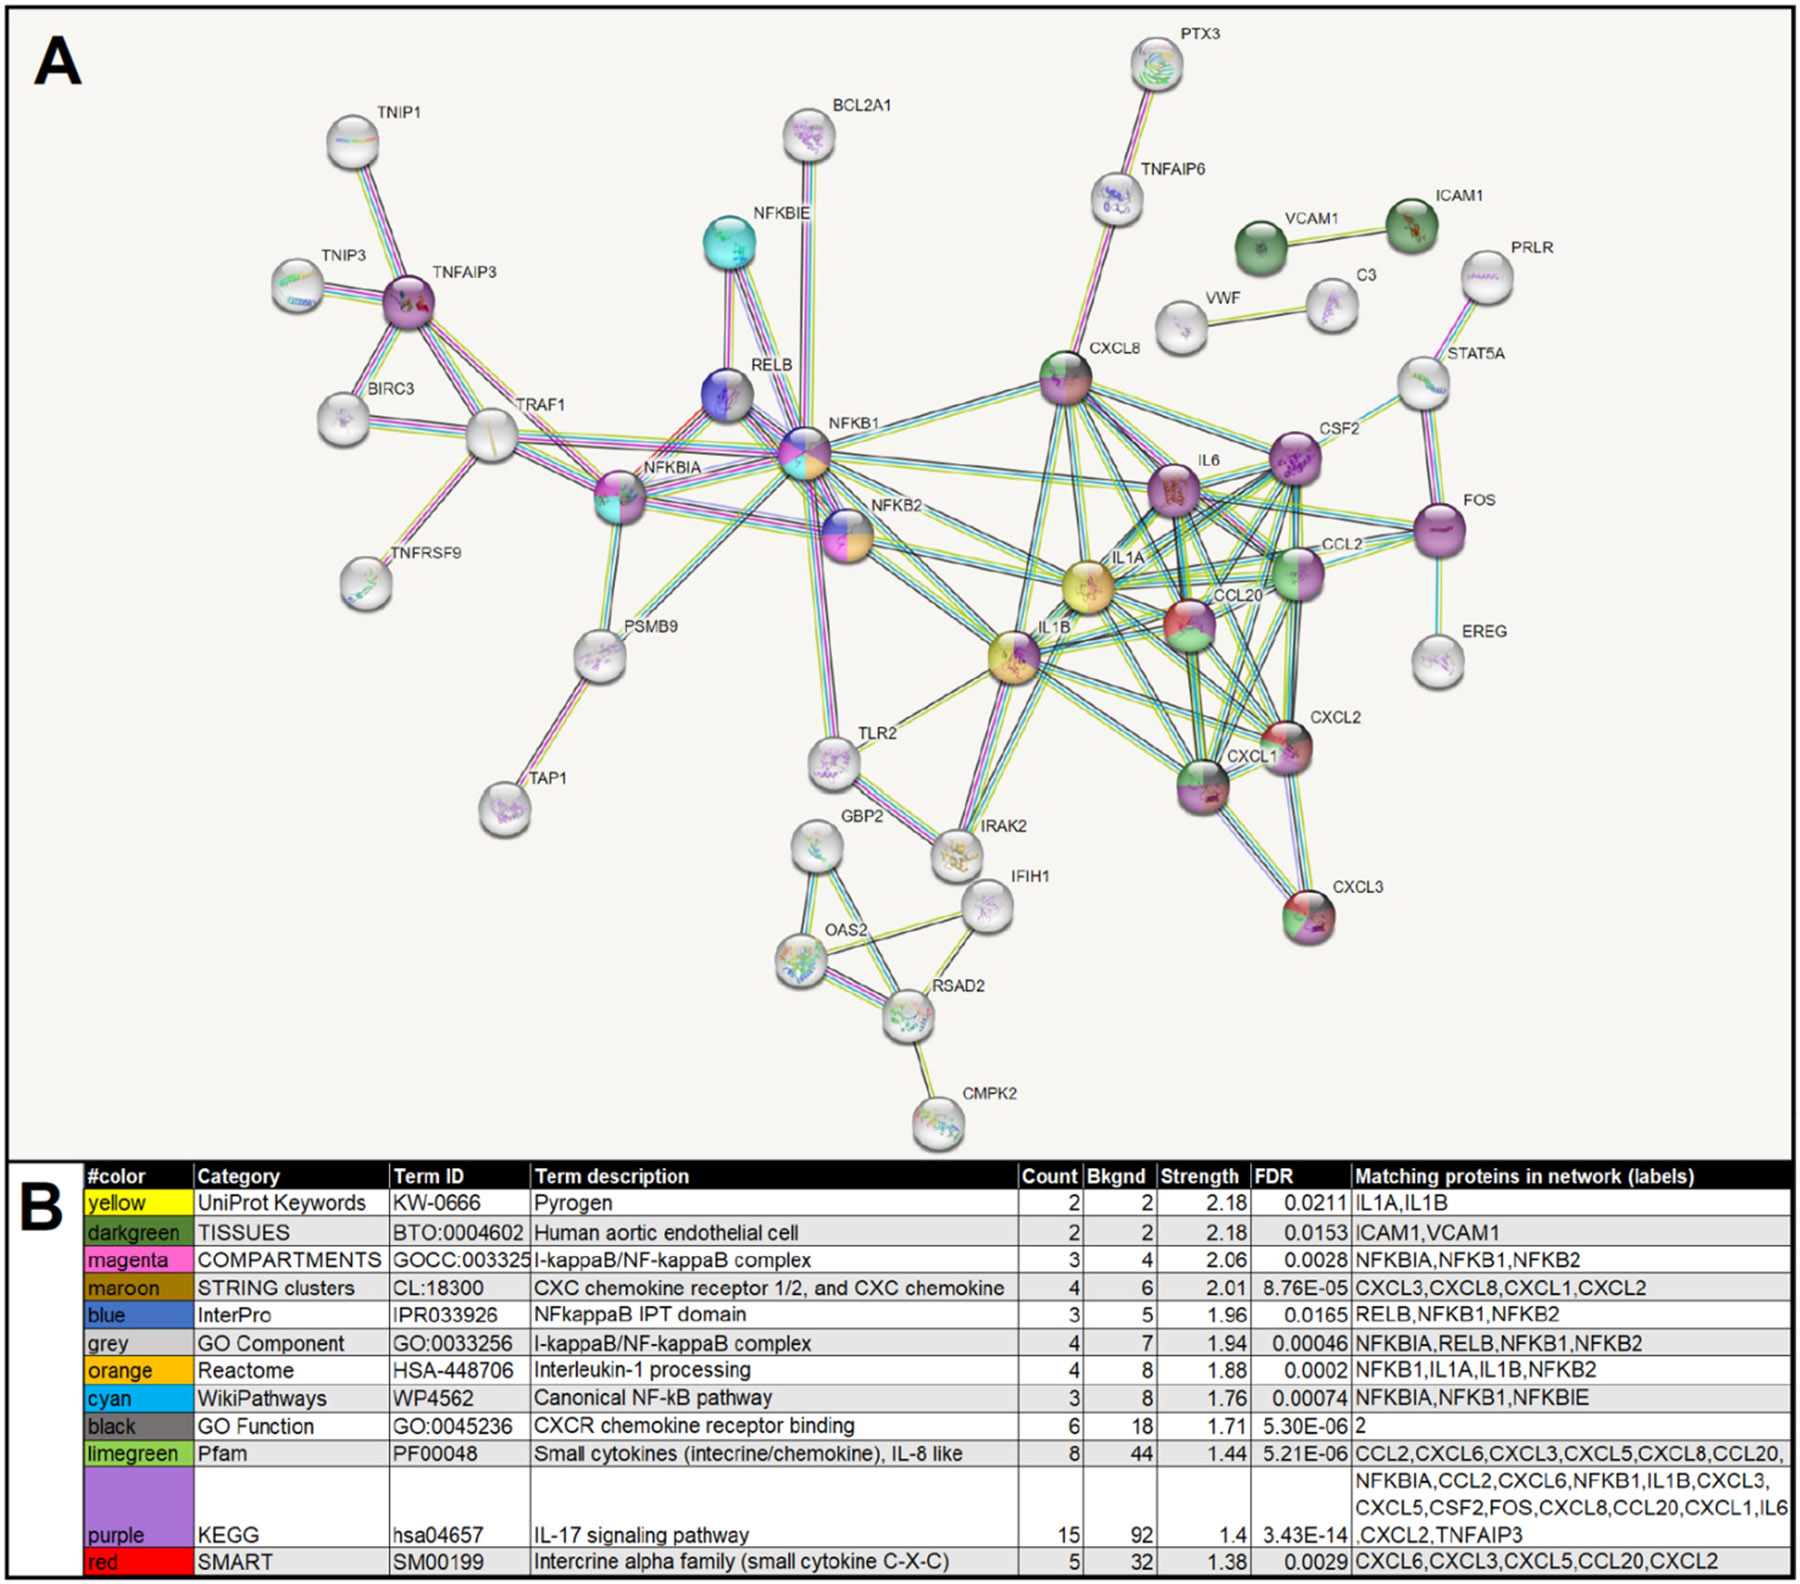
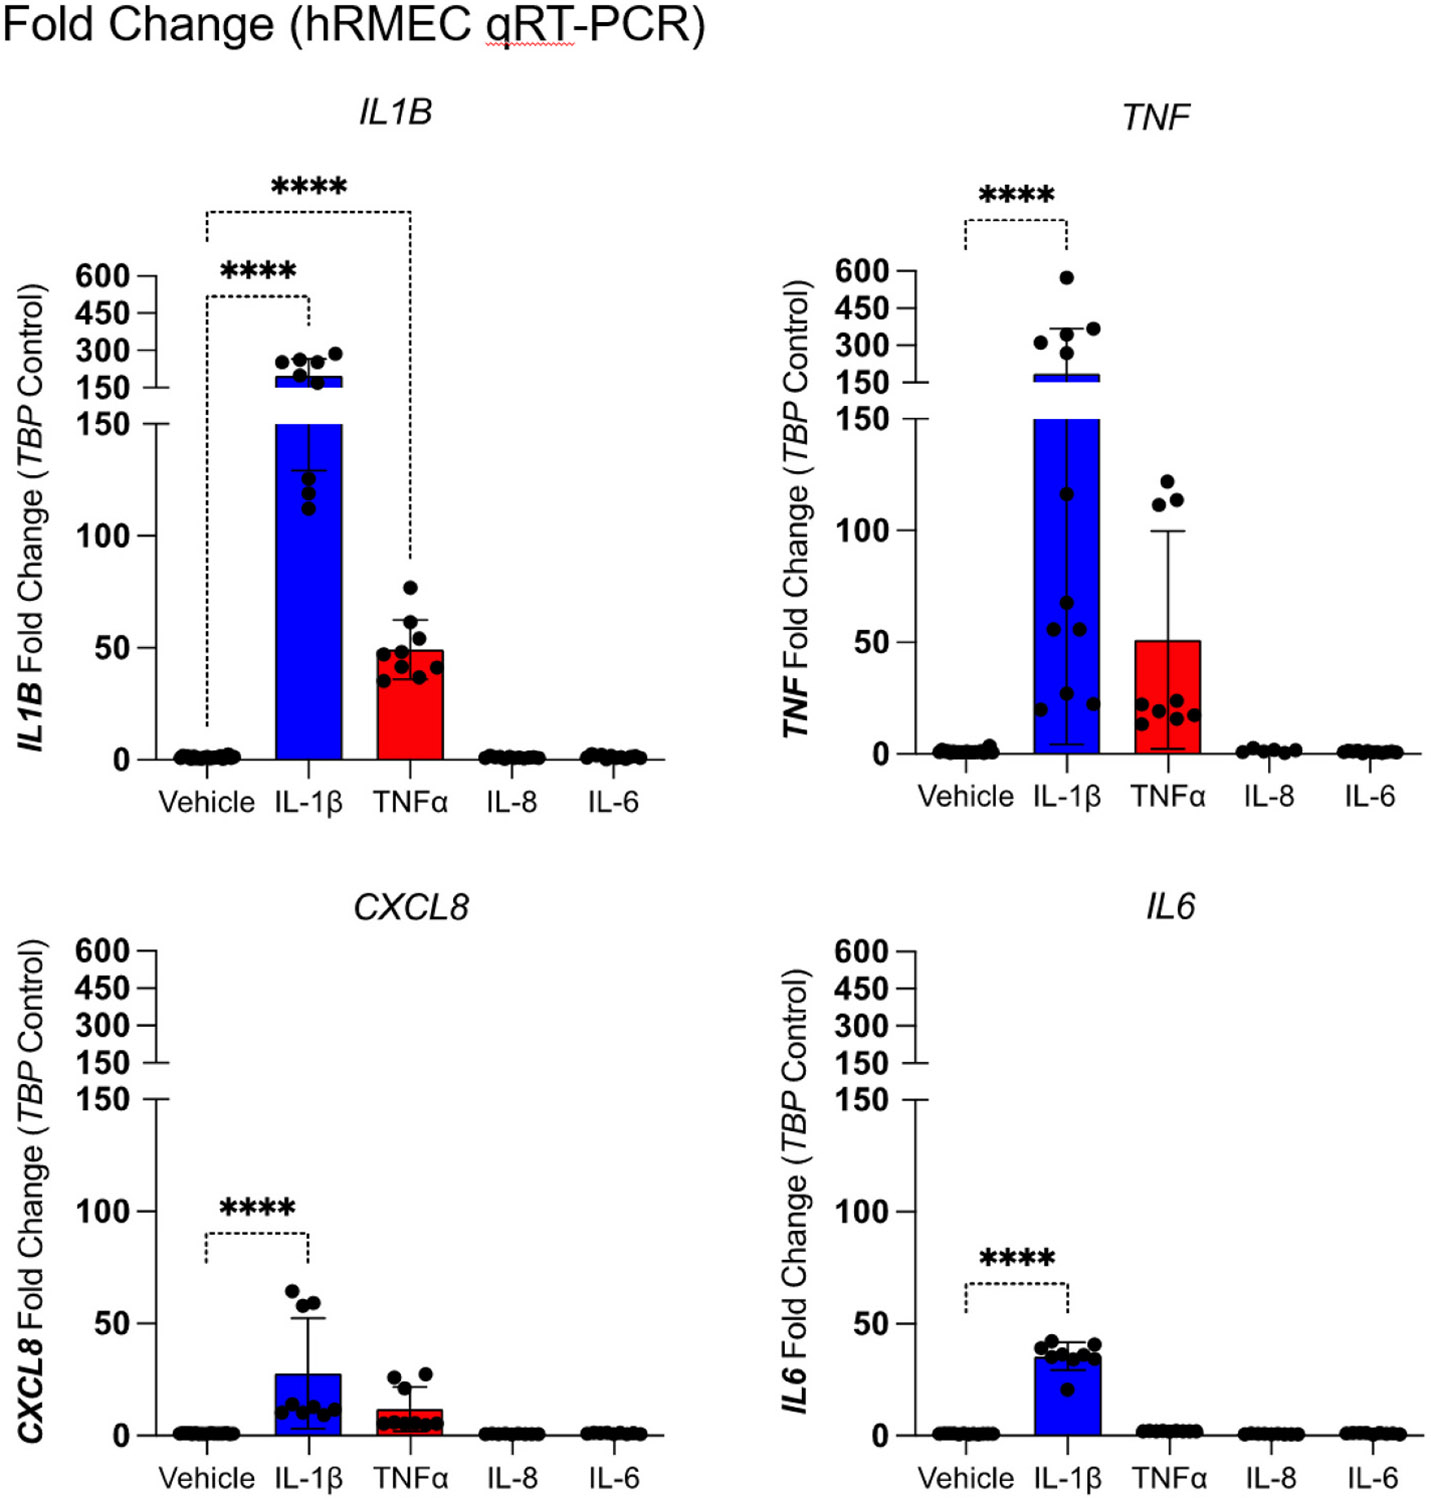
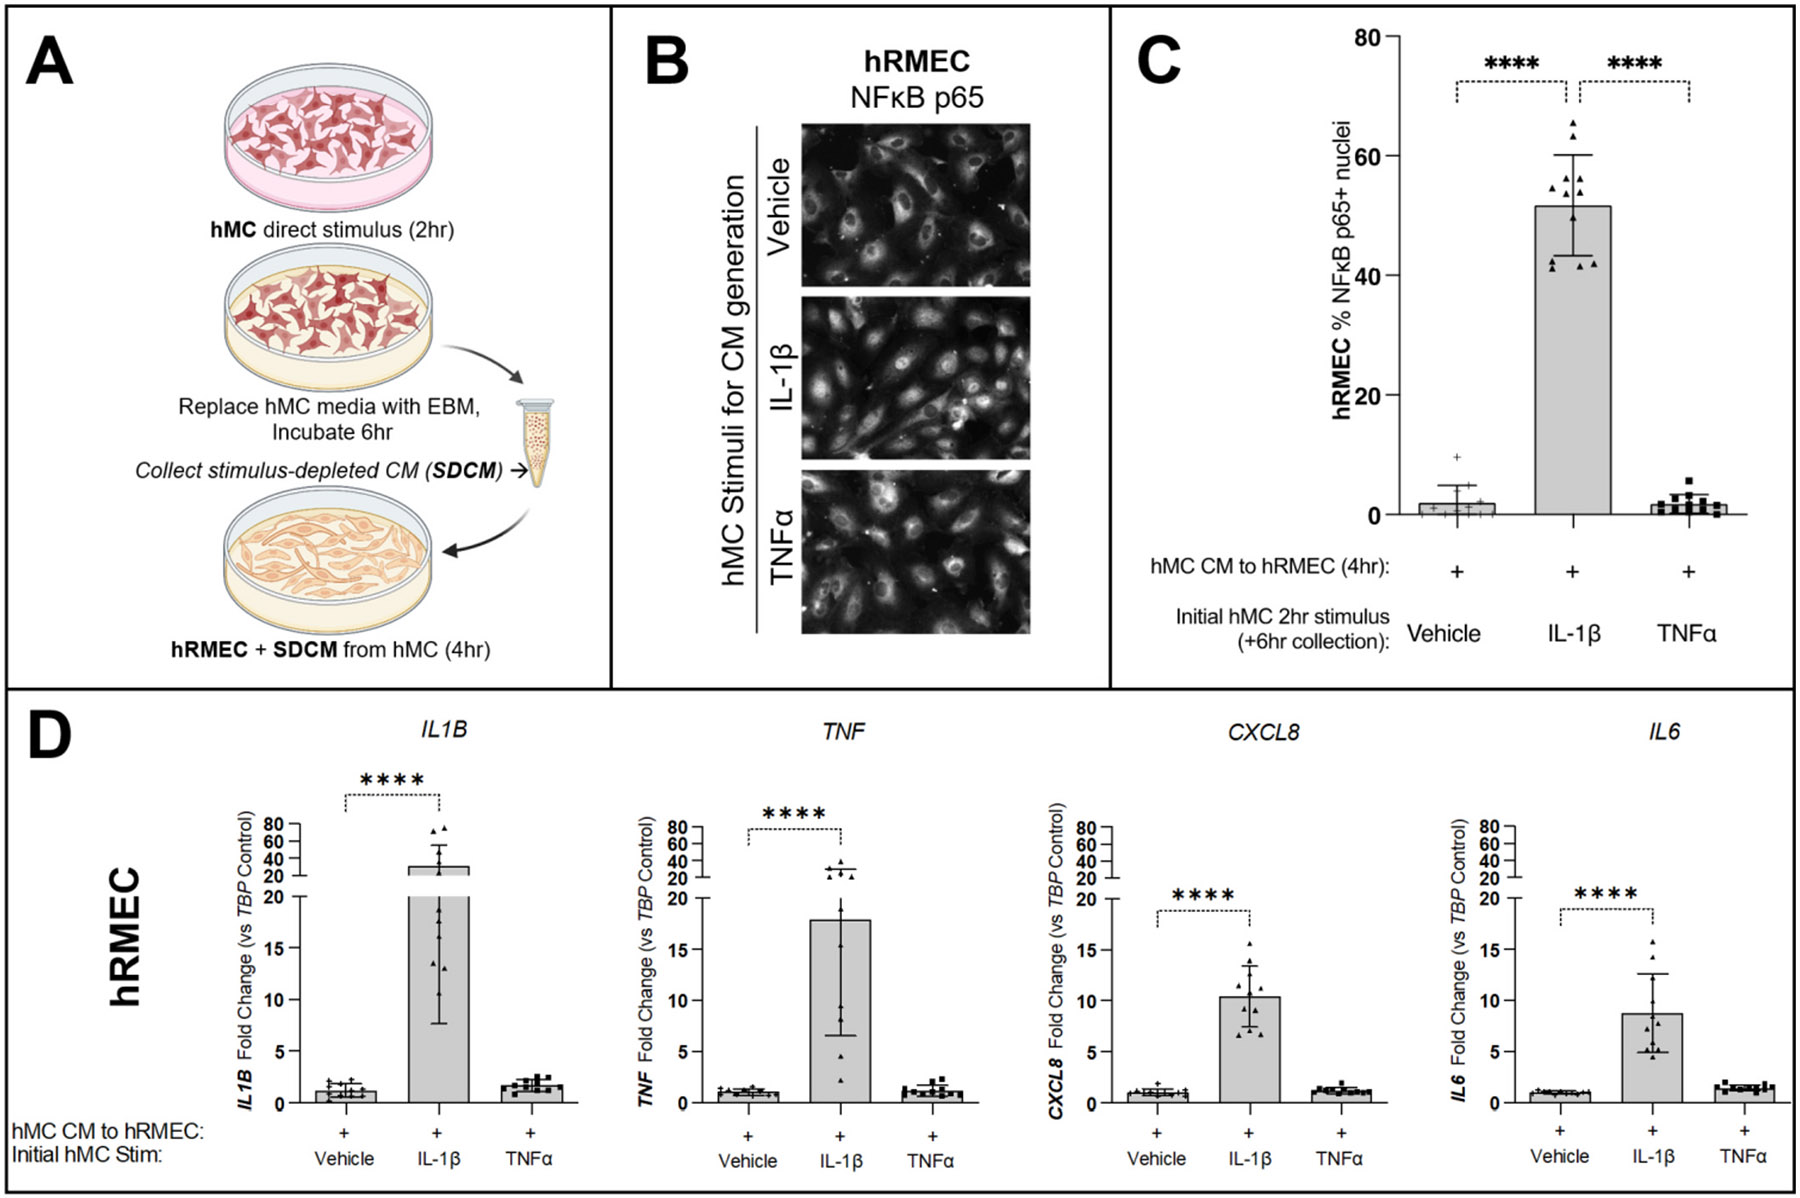
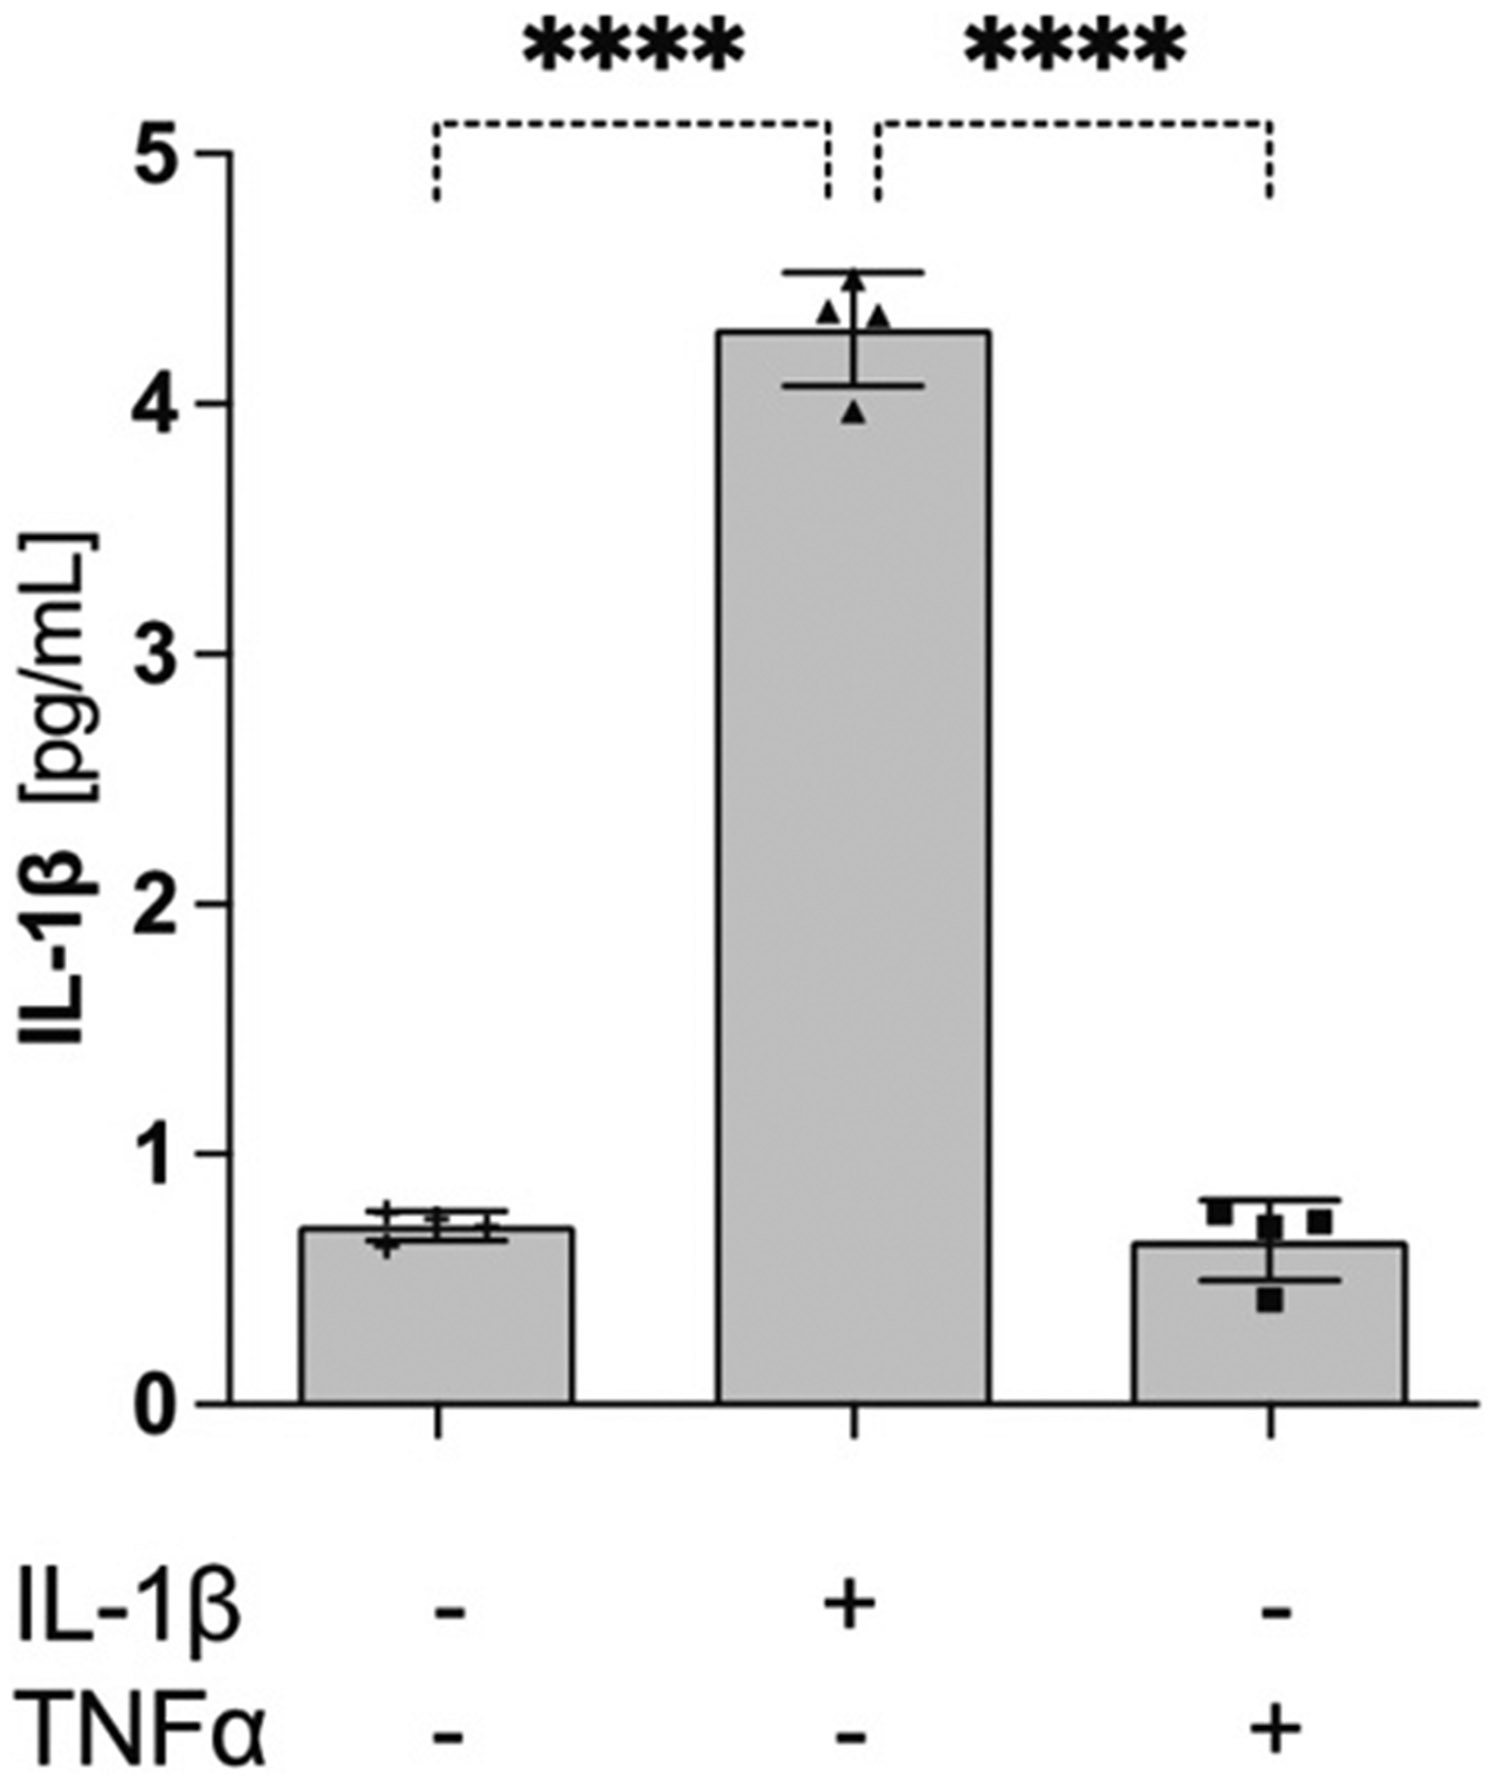
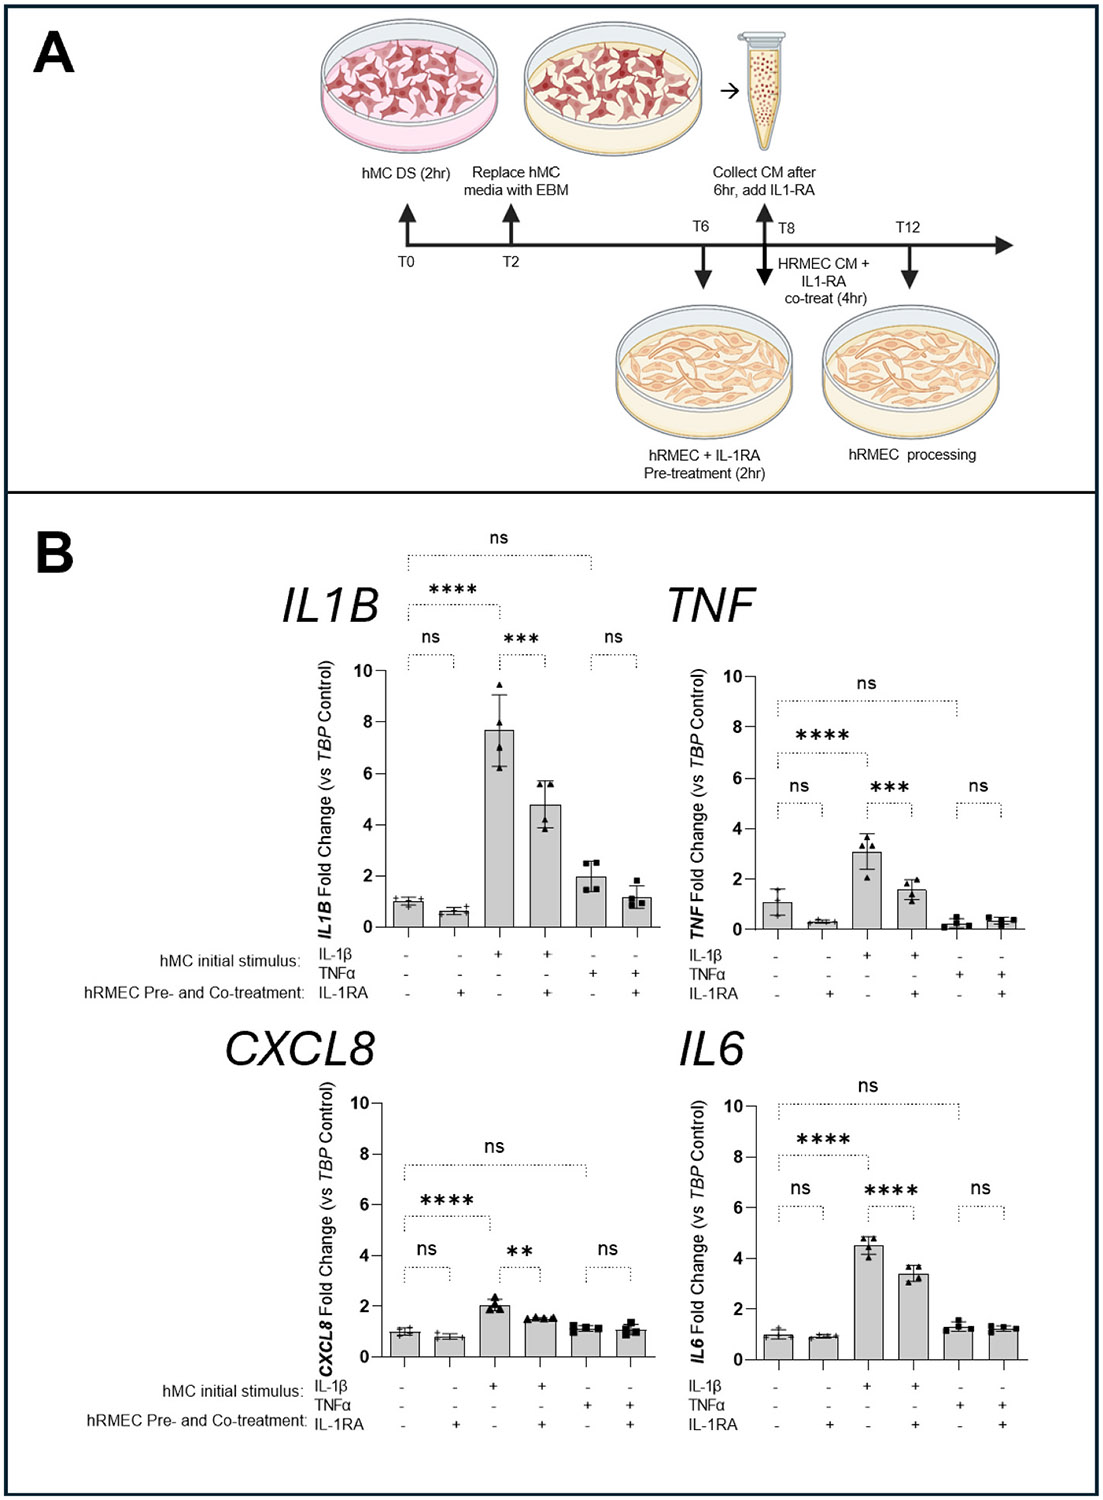
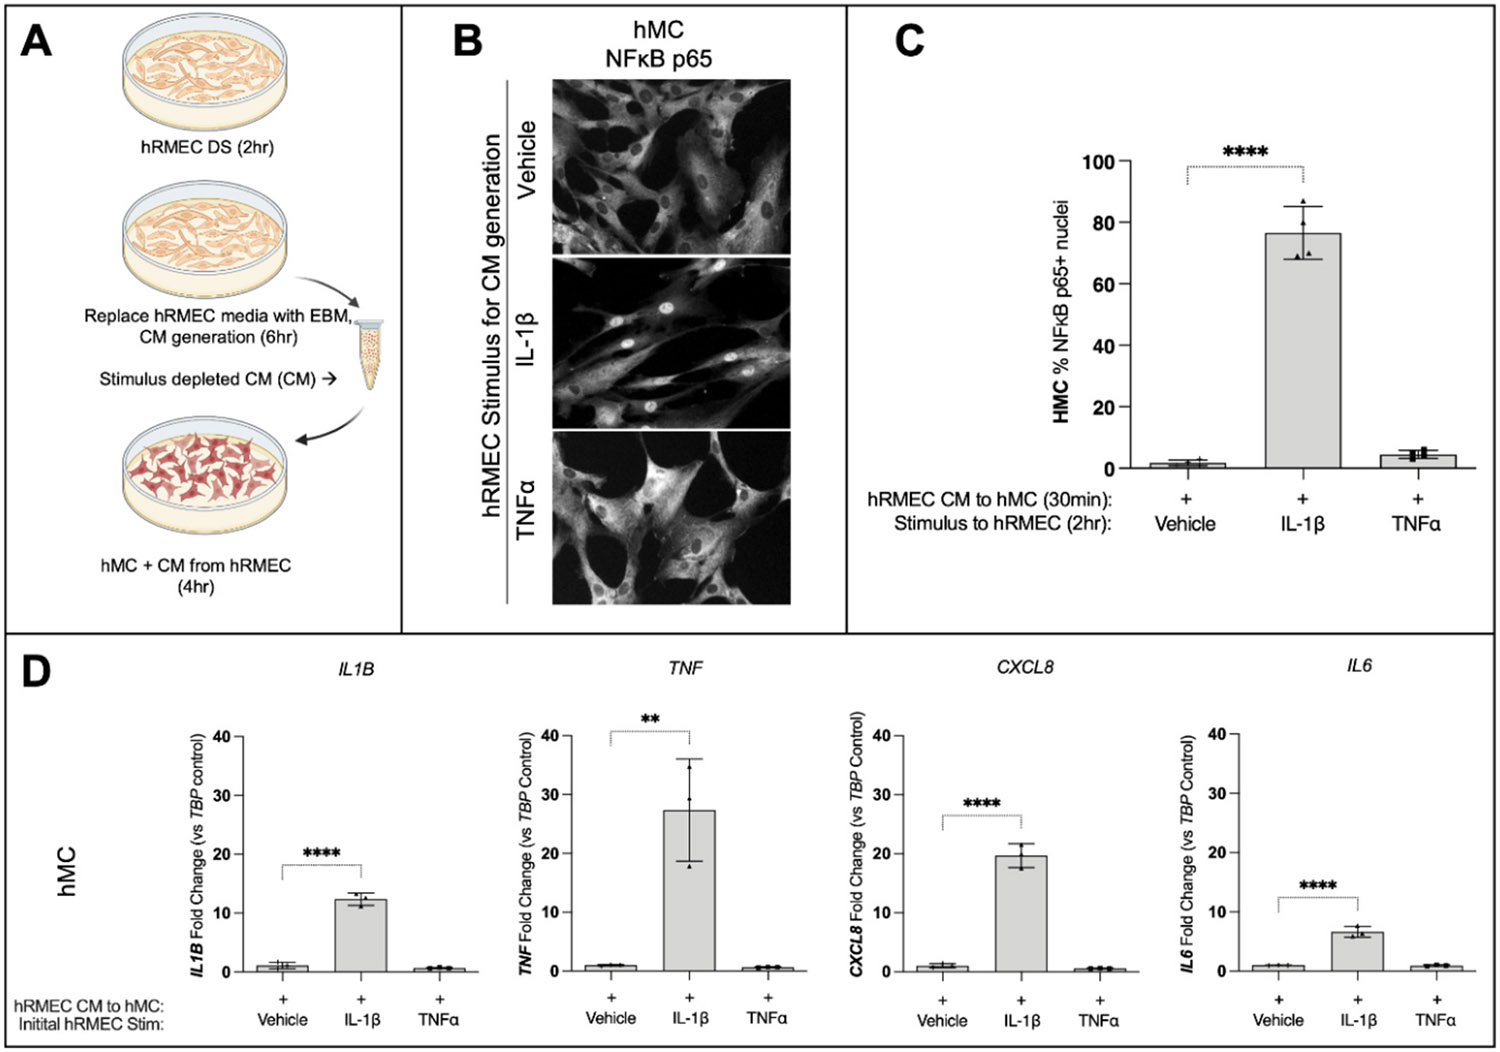
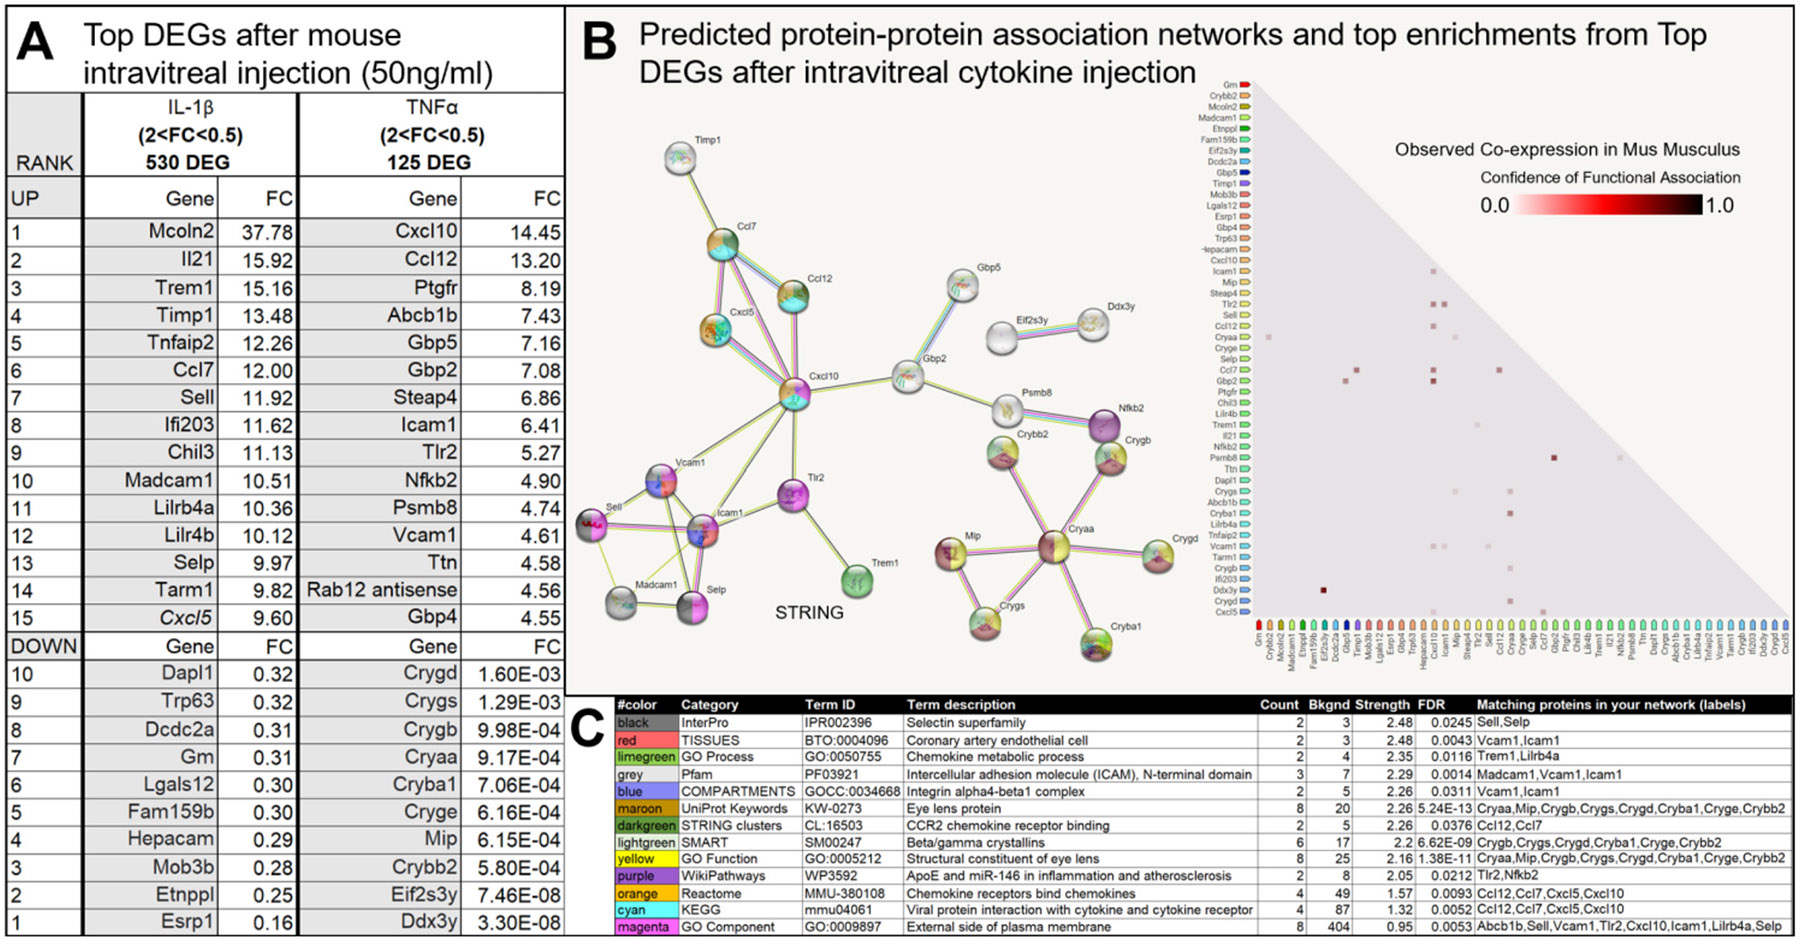
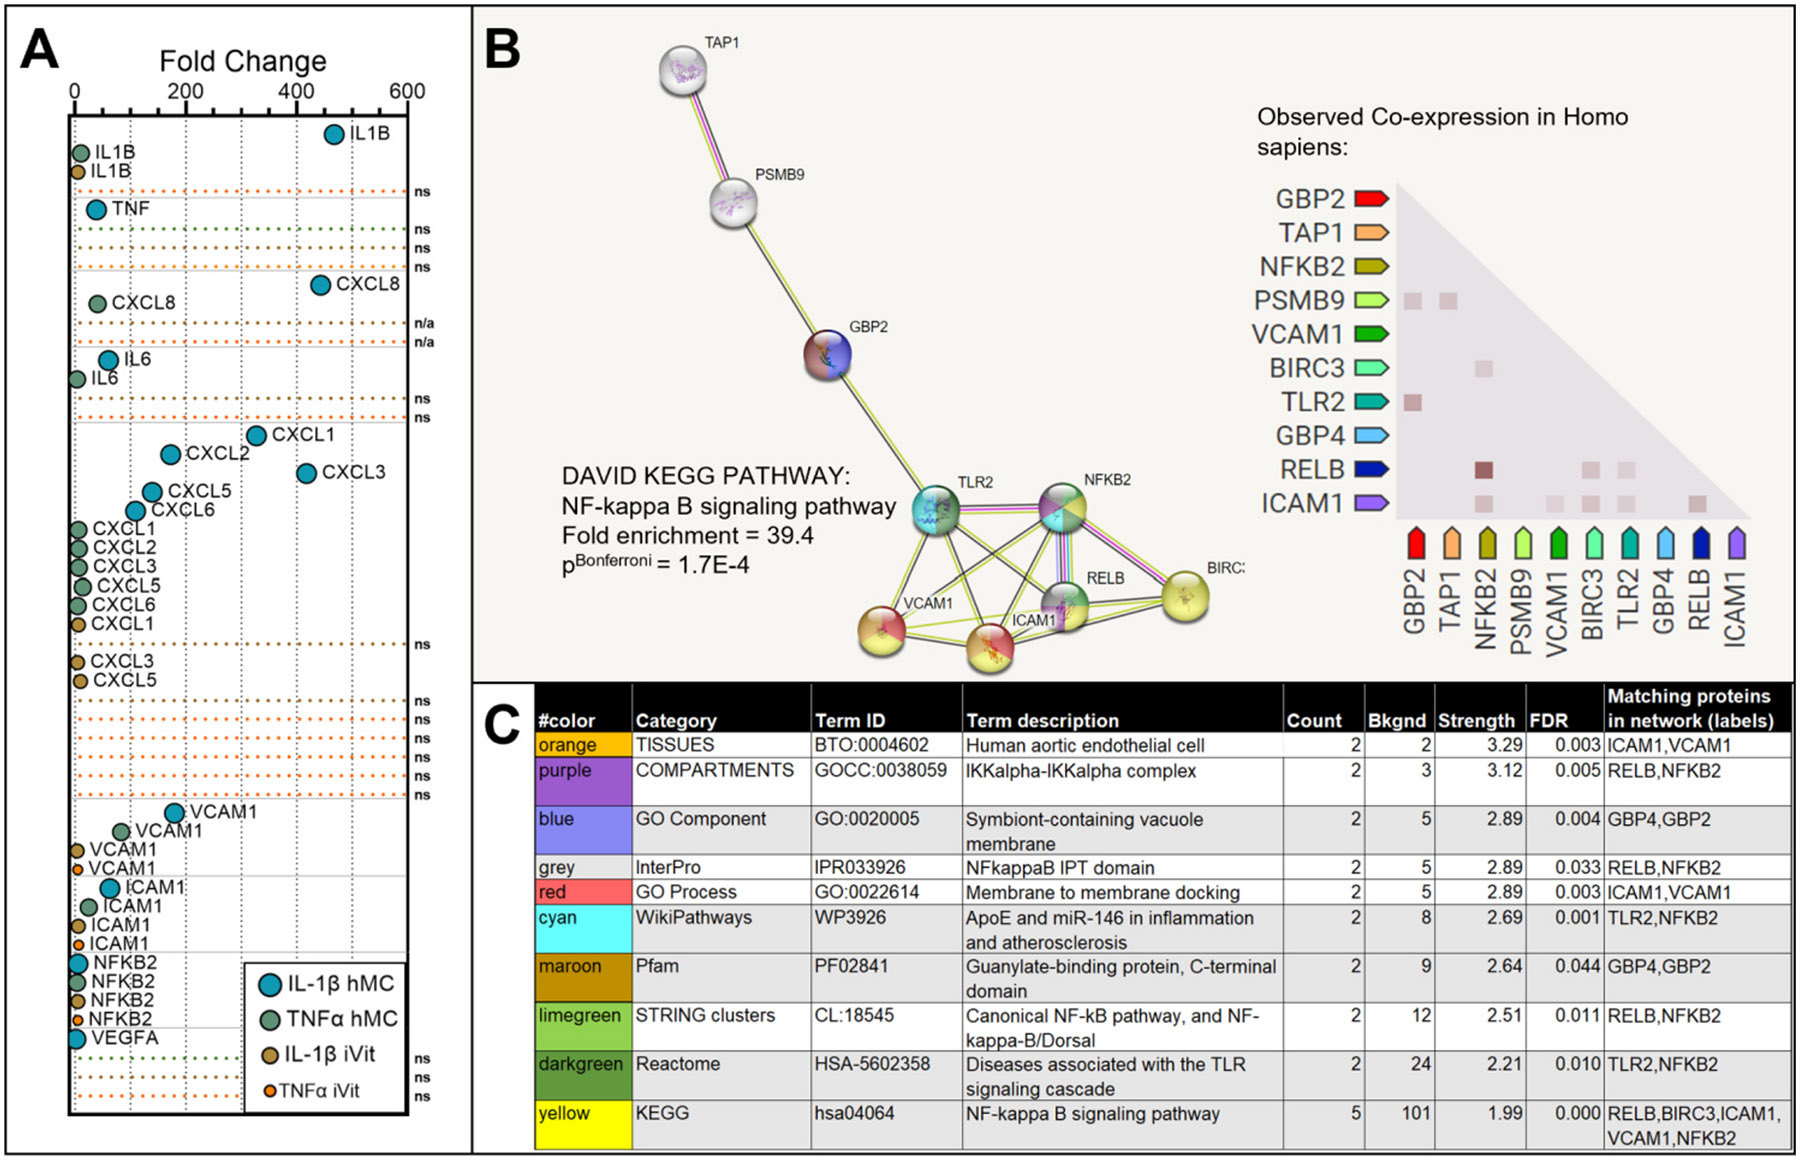
Ocular levels of IL-1β, TNFα, IL-8, and IL-6 correlate with progression of diabetic retinopathy (DR). Müller cells (MC), which are crucial to maintaining retinal homeostasis, are targets and sources of these cytokines. We explored the relative capacities of these four DR-associated cytokines to amplify inflammatory signal expression both in and between human MC (hMC) and retinal microvascular endothelial cells (hRMEC) and in the mouse retina. Of the four cytokines, IL-1β was the most potent stimulus of transcriptomic alterations in hMC and hRMEC in vitro, as well as in the mouse retina after intravitreal injection in vivo. Stimulation with IL-1β significantly induced expression of all four transcripts in hMC and hRMEC. TNFα significantly induced expression of some, but not all, of the four transcripts in each cell, while neither IL-8 nor IL-6 showed significant induction in either cell. Similarly, conditioned media (CM) derived from hMC or hRMEC treated with IL-1β, but not TNFα, upregulated inflammatory cytokine transcripts in the reciprocal cell type. hRMEC responses to hMC-derived CM were dependent on IL-1R activation. In addition, we observed a correlation between cytokine expression changes following direct and CM stimulation and NFκB-p65 nuclear translocation in both hMC and hRMEC. Finally, in mice, intravitreal injections of IL-1β, but not TNFα, induced retinal expression of Il1b and CXCL8 homologues Cxcl1, Cxcl2, Cxcl3, and Cxcl5, encoding pro-angiogenic chemokines. Our results suggest that expression of IL-1β, TNFα, IL-8, and IL-6 may be initiated, propagated, and sustained by autocrine and paracrine signals in hRMEC and hMC through a process involving IL-1β and NFκB. Targeting these signals may help thwart inflammatory amplification, preventing progression to vision-threatening stages and preserving sight.

Keywords: Chemokines; Conditioned media; Diabetic retinopathy; IL-1β; Inflammation; NFκB.


Conflict of interest statement

Declaration of competing interest There are no financial or non-financial competing interests declared by any author.

Figures

Fig. 1.
Fig. 1.. Cytokine mRNA expression changes by qRT-PCR in cytokine-stimulated human Müller cells.
hMC were stimulated with vehicle (white bars) or with 1 ng/mL human recombinant IL-1β (blue bars), TNFα (red bars), IL-8 (orange bars), or IL-6 (green bars) for 2, 4,8, 12 and 24 h. X-axis: treatment time; Y-axis: target gene expression levels relative to the housekeeping gene 18S. Data presented as mean ± SD. n = 3. **** = p < 0.0001, *** = p < 0.0005, ** = p < 0.005, * = p < 0.05. Discontinuous y-axis indicates changes in scale.
Fig. 2.
Fig. 2.. Changes in RNA-seq expression of select DR-relevant transcripts in cytokine-stimulated hMC.
Human Müller cells were stimulated with vehicle or with 1 ng/mL human recombinant IL-1β (blue circles), or TNFα (orange circles) for 8 h. Transcripts of interest with significant alterations in response to cytokine stimulation included those encoding IL-1β, TNFα, IL-8/CXCL8, and IL-6 (top), proangiogenic homologues of CXCL8 (CXCR2 ligands, middle), and cell adhesion molecules (VCAM and ICAM), NFκB, and VEGF (bottom). Upregulation of all transcripts was higher after hMC were stimulated with IL-1β vs. TNFα. Red lines denote undetectable transcripts.
Fig. 3.
Fig. 3.. RNA-Seq DEGs and enriched pathways in IL-1β- or TNFα-stimulated hMC.
Human Müller cells were stimulated with vehicle or with 1 ng/mL human recombinant IL-1β, TNFα, IL-8, or IL-6 for 8 h. A) Volcano plots of DEGs after stimulation with IL-1β (top) or TNFα (bottom). No DEGs were identified after stimulation with IL-8 or IL-6. X-axis: log2 fold change; Y-axis: −log10 p value. B) KEGG pathways significantly enriched by DEG after stimulation with IL-1β (top) or TNFα (bottom).
Fig. 4.
Fig. 4.. Top DEGs and gene/protein associations in IL-1β- or TNFα-stimulated hMC by RNA-Seq.
hMC were stimulated with vehicle or with 1 ng/mL human recombinant IL-1β, TNFα, IL-8, or IL-6 for 8 h. A) Top 15 upregulated and top 10 downregulated DEGs (“top DEGs”) after stimulation with IL-1β (left) or TNFα (right). No DEGs were identified after stimulation with IL-8 or IL-6. Top DEGs in common between IL-1β- and TNFα-stimulated hMC are indicated by bold font, transcripts encoding our cytokines of primary interest are indicated by red font, and members of the CXC chemokine family are indicated by italic font. B) STRING predicted protein-protein association network (nodes color coded to table in C) and confidence matrix of predicted human protein-protein association between top DEGs after stimulation with IL-1β or TNFα. C) Top STRING enrichment by category of top DEGs after stimulation with IL-1β or TNFα.
Fig. 5.
Fig. 5.. Predicted protein-protein associations from DEGs found in common in hMC after stimulation with IL-1β and TNFα.
hMC were stimulated with vehicle or with 1 ng/mL human recombinant IL-1β, TNFα, IL-8, or IL-6 for 8 h. A) STRING predicted protein-protein association network of common DEGs after stimulation with IL-1β and TNFα (nodes color coded to table in B). Again, no DEGs were identified after stimulation with IL-8 or IL-6. B) Top STRING enrichment by category of common DEGs after stimulation with IL-1β and TNFα.
Fig. 6.
Fig. 6.. Cytokine qRT-PCR expression changes in cytokine-stimulated hRMEC.
Human retinal microvascular endothelial cells were stimulated with vehicle or with 1 ng/mL recombinant human IL-1β, TNFα, IL-8, or IL-6 (X-axis) for 4 h. Y-axis: target gene expression levels relative to the housekeeping gene TBP. Data presented as mean ± SD. n (IL1B) = 9–21; n (TNF) = 6–20; n (CXCL8) = 9–18; n (IL6) = 9–12. **** = p < 0.0001. Discontinuous y-axis indicates change in scale.
Fig. 7.
Fig. 7.. NFκB nuclear translocation in IL-1β- or TNFα-stimulated hMC and hRMEC.
hMC and hRMEC were stimulated with vehicle or with 1 ng/mL human recombinant IL-1β, TNFα, IL-8, or IL-6 for 30 mins. A) Representative images of NFκB p65 immunocytochemistry on hMC (top) and hRMEC (bottom) after cytokine stimulation. B) Percent of NFκB p65+ nuclei in hMC (left) and hRMEC (right) after cytokine stimulation. Data presented as mean ± SD. n (hMC) = 4; n (hRMEC) = 12. **** = p < 0.0001.
Fig. 8.
Fig. 8.. NFκB-dependent nuclear translocation and cytokine expression in IL-1β- or TNFα- stimulated hMC and hRMEC.
A) hMC (left) and hRMEC (right) were pre-treated with vehicle or 5 μM IKK2i-VI for 30 mins, then vehicle or 1 ng/mL human recombinant IL-1β or TNFα were added for an additional 30 mins. Percent of NFκB p65+ nuclei in hMC (left) and hRMEC (right). n = 4. B) hMC (top) and hRMEC (bottom) were pre-treated with vehicle or 5 μM IKK2i-VI for 30 mins, then vehicle or 1 ng/mL human recombinant IL-1β or TNFα were added for an additional 4 h. Y-axis: target gene expression levels relative to the housekeeping gene TBP. n = 3–6. Data presented as mean ± SD. **** = p < 0.0001, ** = p < 0.005, ns = p > 0.05. Discontinuous y-axis indicates change in scale.
Fig. 9.
Fig. 9.. NFκB-dependent nuclear translocation and cytokine expression in hRMEC treated with CM from cytokine-stimulated hMC.
A) Illustration of CM generation from cytokine-stimulated hMC and its transfer to hRMEC. B) hRMEC were treated with CM from vehicle-, IL-1β-, or TNFα-stimulated hMC for 30 mins. Representative images of NFκB p65 immunocytochemistry in hRMEC after stimulation with CM. C) Percent of NFκB p65+ nuclei in hRMEC after stimulation with CM. n = 12. D) hRMEC were treated with CM from vehicle-, IL-1β-, or TNFα-stimulated hMC for 4 h. Y-axis: target gene expression levels relative to the housekeeping gene TBP. n = 10–12. Data presented as mean ± SD. **** = p < 0.0001. Discontinuous y-axis indicates change in scale.
Fig. 10.
Fig. 10.. IL-1β levels in CM from IL-1β-stimulated and TNFα-stimulated hMC.
hMC were stimulated with vehicle or with 1 ng/mL human recombinant IL-1β or TNFα for 2 h to generate CM. ELISA was used to quantify protein levels. Y-axis: IL-1β protein concentration. Data presented as mean ± SD. n = 4. **** = p < 0.0001.
Fig. 11.
Fig. 11.. IL-1β-dependent cytokine expression in hRMEC treated with CM from cytokine-stimulated hMC.
A) Illustration of CM generation from cytokine-stimulated hMC, its transfer to hRMEC, and IL-1RA treatment of hRMEC. B) hRMEC were pre-treated with vehicle or 10 ng/mL IL-1RA for 2 h, then CM from vehicle-, IL-1β-, or TNFα-stimulated hMC was added for an additional 4 h. Y-axis: target gene expression levels relative to the housekeeping gene TBP. n = 3–4. Data presented as mean ± SD. **** = p < 0.0001.
Fig. 12.
Fig. 12.. Cytokine expression in hMC treated with CM from cytokine-stimulated hRMEC.
A) Illustration of CM generation from cytokine-stimulated hRMEC and its transfer to hMC. B) hMC were treated with CM from vehicle-, IL-1β-, or TNFα-stimulated hRMEC for 30 mins. Representative images of NFκB p65 immunocytochemistry in hRMEC after stimulation with CM. C) Percent of NFκB p65+ nuclei in hRMEC after stimulation with CM. D) hMC were treated with CM from vehicle-, IL-1β-, or TNFα-stimulated hRMEC for 4 h. Y-axis: target gene expression levels relative to the housekeeping gene TBP. n = 4. Data presented as mean ± SD. **** = p < 0.0001.
Fig. 13.
Fig. 13.. DEGs and enriched pathways in retinal tissue after intravitreal IL-1β- or TNFα-injections in mice.
Mice received intravitreal injections of vehicle or of 50 ng/mL mouse-recombinant IL-1β or TNFα, with retinas collected 6 h post-injection. A) Volcano plots of DEGs after injection of IL-1β (top) or TNFα (bottom). X-axis: log2 fold change; Y-axis: −log10 p value. B) KEGG pathways significantly enriched by DEG after injection of IL-1β (top) or TNFα (bottom). Discontinuous y-axis indicates change in scale.
Fig. 14.
Fig. 14.. Top DEGs and gene/protein associations in retinal tissue from IL-1β- or TNFα-injected mice.
Mice received intravitreal injections of vehicle or of 50 ng/mL mouse-recombinant IL-1β or TNFα, with retinas collected 6 h post-injection. A) Top 15 upregulated and top 10 downregulated DEGs (“top DEGs”) after injection of IL-1β (left) or TNFα (right). B) STRING predicted protein-protein association network (nodes color coded to table in C) and confidence matrix of predicted mouse protein-protein association between top DEGs after injection of IL-1β or TNFα. C) Top STRING enrichment by category of top DEGs after injection of IL-1β or TNFα.
Fig. 15.
Fig. 15.. Select DR-relevant transcripts and predicted protein-protein associations from DEGs common to cytokine-treated hMC and mouse retina.
hMC (Fig. 2) and mice (Fig. 13) were treated as described previously. A) Transcripts of interest with significant alterations in response to cytokine stimulation included those encoding IL-1β, TNFα, IL-8 (and its mouse homologues), and IL-6 (top), proangiogenic homologues of CXCL8 (CXCR2 ligands, middle), and cell adhesion molecules (VCAM and ICAM), VEGF, and NFκB (bottom). B) STRING predicted protein-protein association network (nodes color coded to table in C) and confidence matrix of predicted human protein-protein association of DEGs common to IL-1β- and TNFα-treated hMC and mouse retina. C) Top STRING enrichment by category using the same subset of DEGs as described for B.

References

    1. Abcouwer SF, Angiogenic factors and cytokines in diabetic retinopathy, J. Clin. Cell Immunol Suppl 1 (2013), 10.4172/2155-9899. - DOI - PMC - PubMed
    1. Sharma D, Zachary I, Jia H, Mechanisms of acquired resistance to anti-VEGF therapy for Neovascular eye diseases, Invest. Ophthalmol. Vis. Sci 64 (2023) 28, 10.1167/iovs.64.5.28. - DOI - PMC - PubMed
    1. Feng S, et al. , Levels of inflammatory cytokines IL-1beta, IL-6, IL-8, IL-17A, and TNF-alpha in aqueous humour of patients with diabetic retinopathy, J. Diabetes Res 2018 (2018) 8546423, 10.1155/2018/8546423. - DOI - PMC - PubMed
    1. Joussen AM, et al. , Nonsteroidal anti-inflammatory drugs prevent early diabetic retinopathy via TNF-alpha suppression, FASEB J. 16 (2002) 438–440, 10.1096/fj.01-0707fje. - DOI - PubMed
    1. Powers MR, Davies MH, Eubanks JP, Increased expression of chemokine KC, an interleukin-8 homologue, in a model of oxygen-induced retinopathy, Curr. Eye Res 30 (2005) 299–307, 10.1080/02713680590923276. - DOI - PubMed

Publication types

MeSH terms

LinkOut - more resources