

Rainfall events and daily mortality across 645 global locations: two stage time series analysis
- PMID: 39384295
- PMCID: PMC12036573
- DOI: 10.1136/bmj-2024-080944
Rainfall events and daily mortality across 645 global locations: two stage time series analysis
Abstract
Objective: To examine the associations between characteristics of daily rainfall (intensity, duration, and frequency) and all cause, cardiovascular, and respiratory mortality.
Design: Two stage time series analysis.
Setting: 645 locations across 34 countries or regions.
Population: Daily mortality data, comprising a total of 109 954 744 all cause, 31 164 161 cardiovascular, and 11 817 278 respiratory deaths from 1980 to 2020.
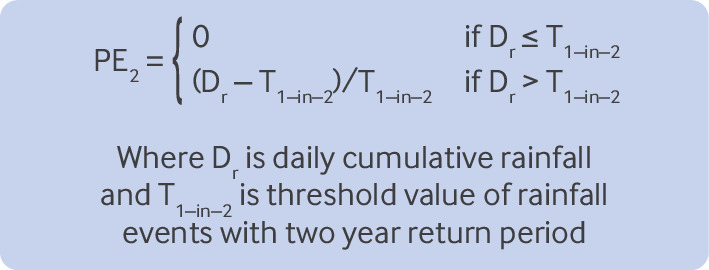
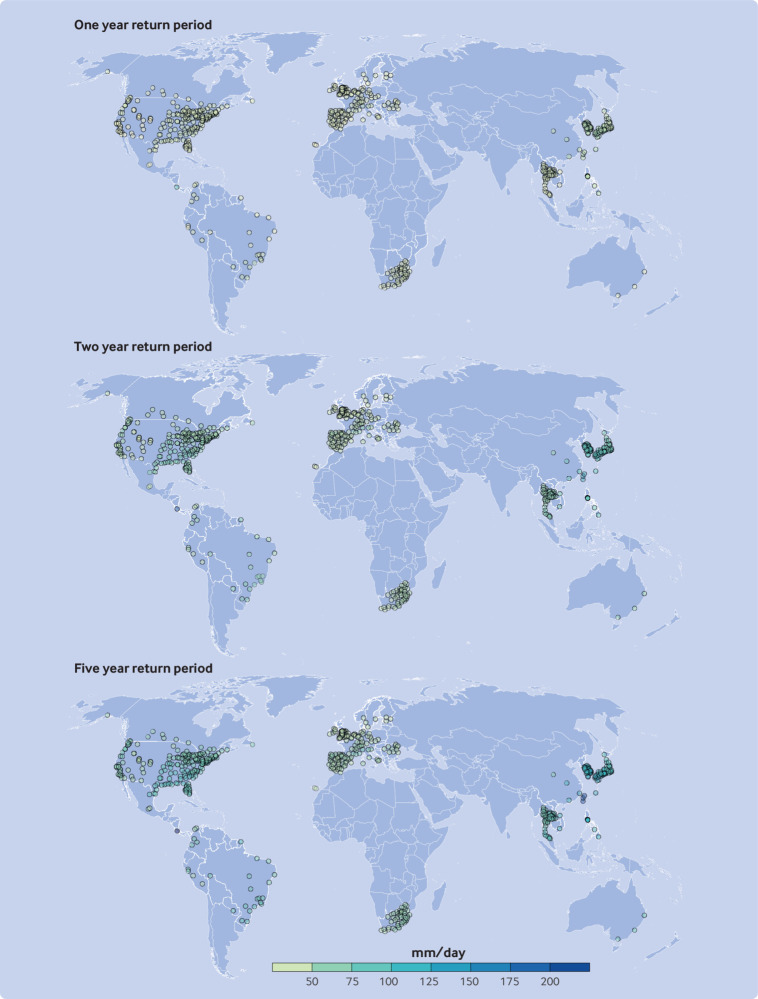
Main outcome measure: Association between daily mortality and rainfall events with return periods (the expected average time between occurrences of an extreme event of a certain magnitude) of one year, two years, and five years, with a 14 day lag period. A continuous relative intensity index was used to generate intensity-response curves to estimate mortality risks at a global scale.
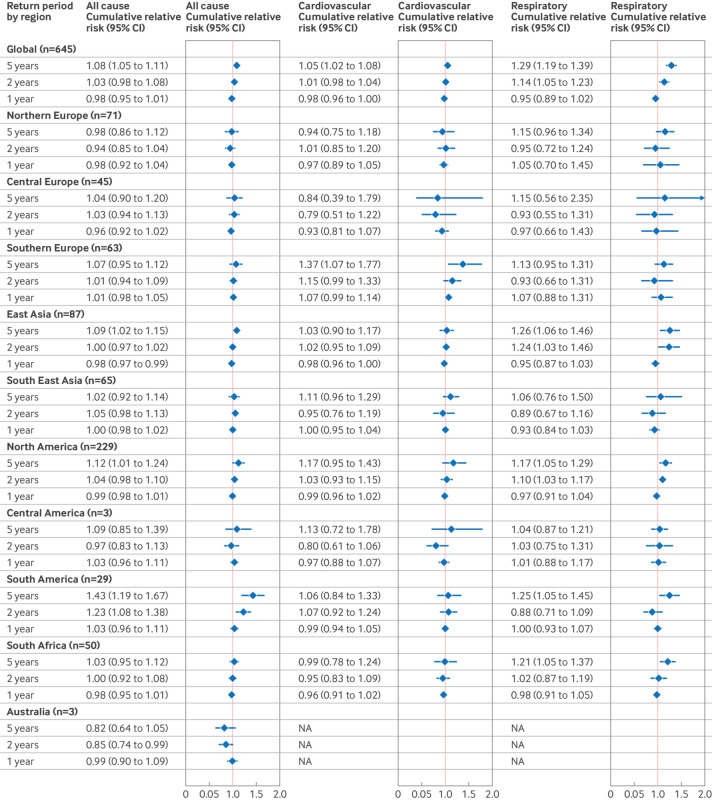
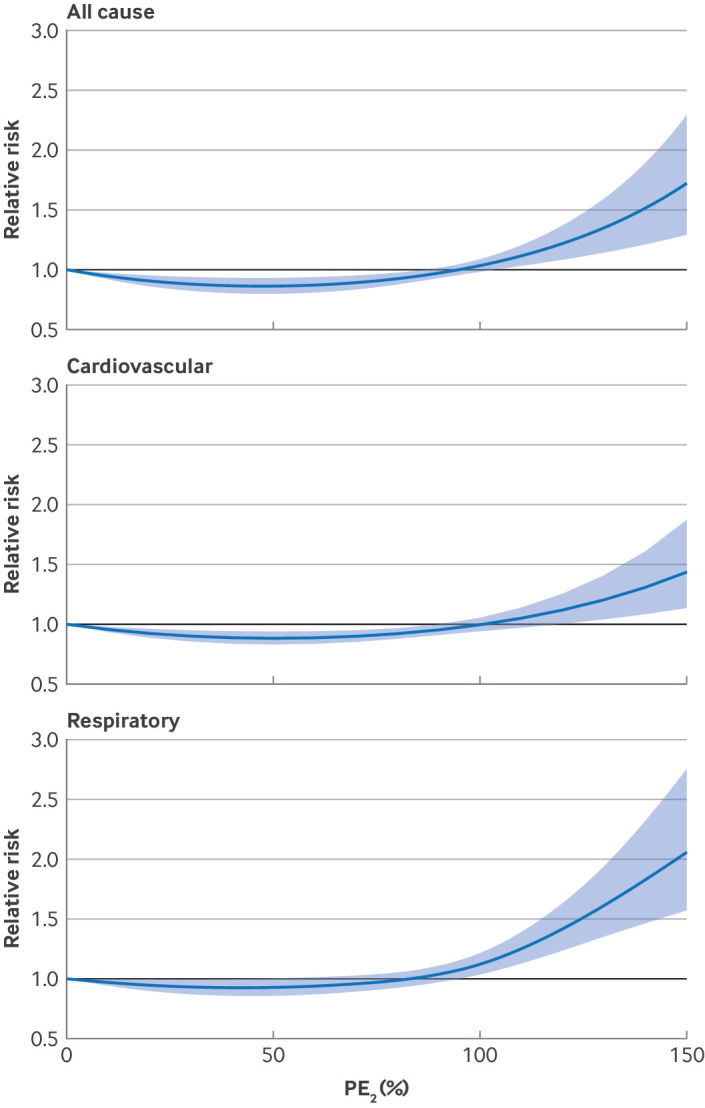
Results: During the study period, a total of 50 913 rainfall events with a one year return period, 8362 events with a two year return period, and 3301 events with a five year return period were identified. A day of extreme rainfall with a five year return period was significantly associated with increased daily all cause, cardiovascular, and respiratory mortality, with cumulative relative risks across 0-14 lag days of 1.08 (95% confidence interval 1.05 to 1.11), 1.05 (1.02 to 1.08), and 1.29 (1.19 to 1.39), respectively. Rainfall events with a two year return period were associated with respiratory mortality only, whereas no significant associations were found for events with a one year return period. Non-linear analysis revealed protective effects (relative risk <1) with moderate-heavy rainfall events, shifting to adverse effects (relative risk >1) with extreme intensities. Additionally, mortality risks from extreme rainfall events appeared to be modified by climate type, baseline variability in rainfall, and vegetation coverage, whereas the moderating effects of population density and income level were not significant. Locations with lower variability of baseline rainfall or scarce vegetation coverage showed higher risks.
Conclusion: Daily rainfall intensity is associated with varying health effects, with extreme events linked to an increasing relative risk for all cause, cardiovascular, and respiratory mortality. The observed associations varied with local climate and urban infrastructure.
© Author(s) (or their employer(s)) 2019. Re-use permitted under CC BY-NC. No commercial re-use. See rights and permissions. Published by BMJ.
Conflict of interest statement
Competing interests: All authors have completed the ICMJE uniform disclosure form at www.icmje.org/disclosure-of-interest/ and declare: Support from the Alexander von Humboldt Foundation no financial relationships with any organizations that might have an interest in the submitted work in the previous three years; no other relationships or activities that could appear to have influenced the submitted work.
Figures
Comment in
-
Rainfall events and adverse health outcomes.BMJ. 2024 Oct 9;387:q2053. doi: 10.1136/bmj.q2053. BMJ. 2024. PMID: 39384299 No abstract available.
References
-
- Ingole V, Juvekar S, Muralidharan V, Sambhudas S, Rocklöv J. The short-term association of temperature and rainfall with mortality in Vadu Health and Demographic Surveillance System: a population level time series analysis. Glob Health Action 2012;5:44-52. 10.3402/gha.v5i0.19118 - DOI - PMC - PubMed
-
- Peirce AM, Espira LM, Larson PS. Climate change related catastrophic rainfall events and non-communicable respiratory disease: a systematic review of the literature. Climate (Basel) 2022;10:101 10.3390/cli10070101. - DOI