. 2024 Oct;23(10):e14254.
doi: 10.1111/acel.14254. Epub 2024 Jun 22.

Cellular senescence by loss of Men1 in osteoblasts is critical for age-related osteoporosis

Affiliations

Cellular senescence by loss of Men1 in osteoblasts is critical for age-related osteoporosis

Yuichiro Ukon et al. Aging Cell. 2024 Oct.

Abstract

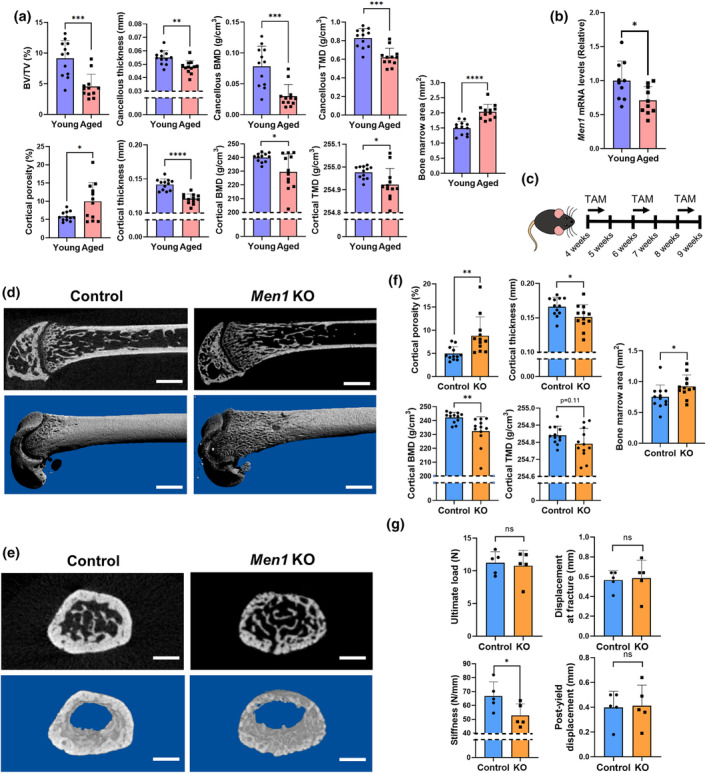
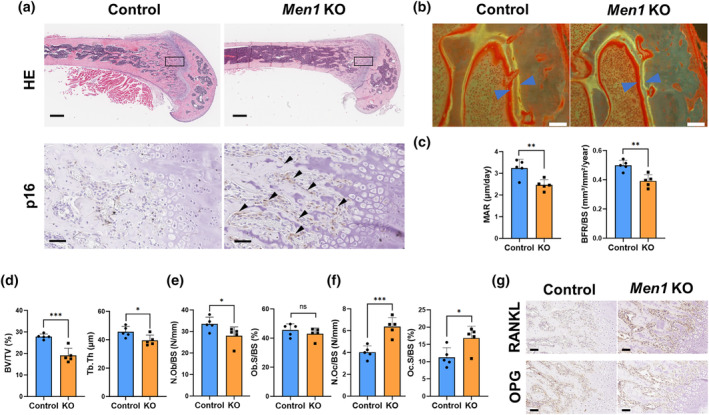
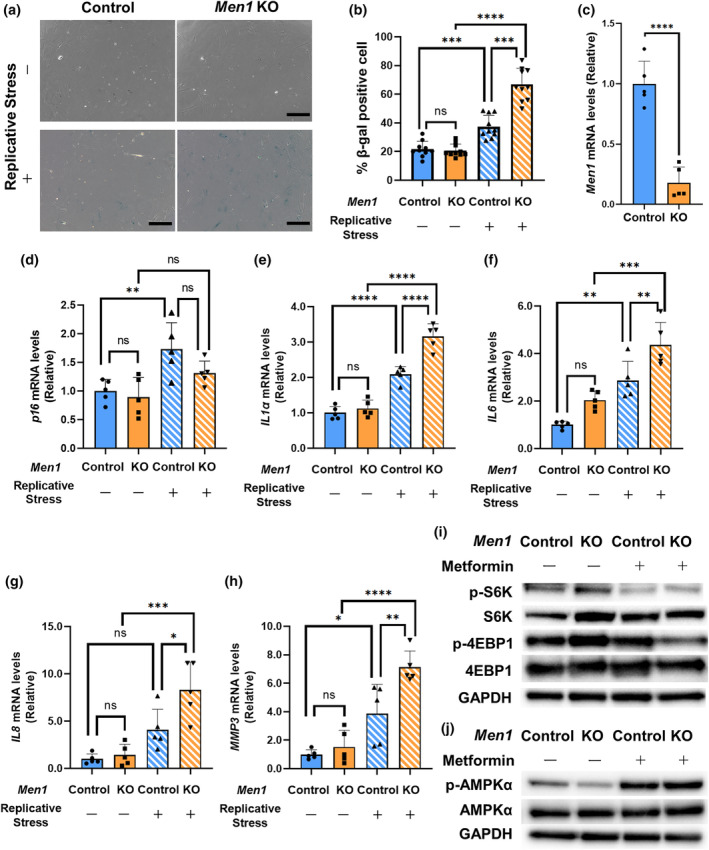
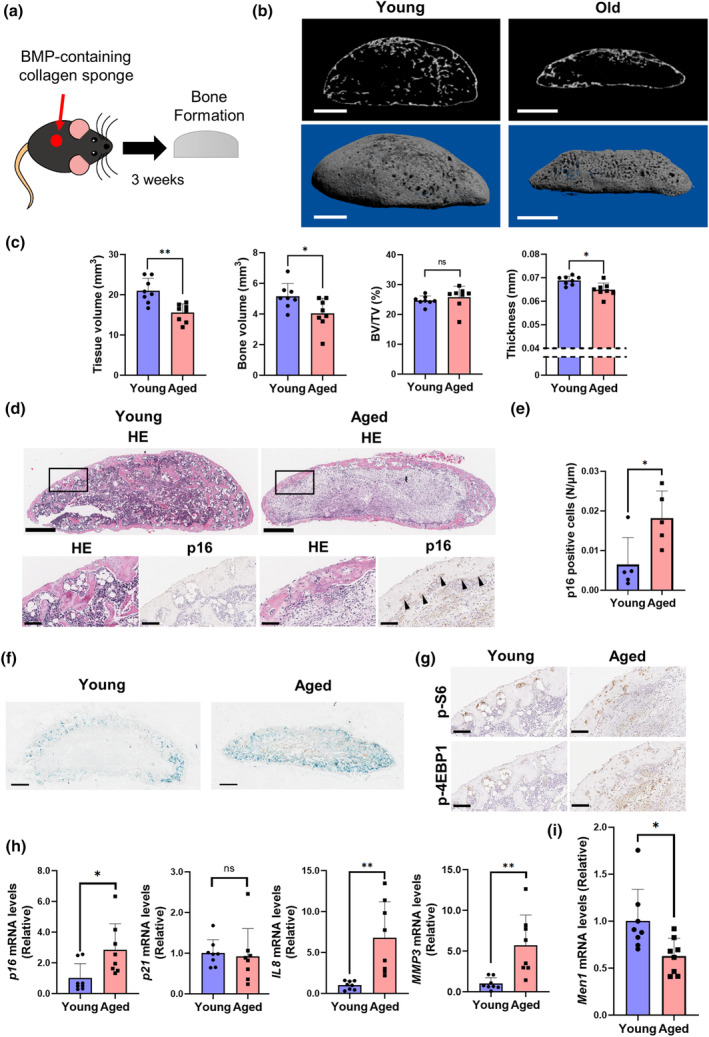
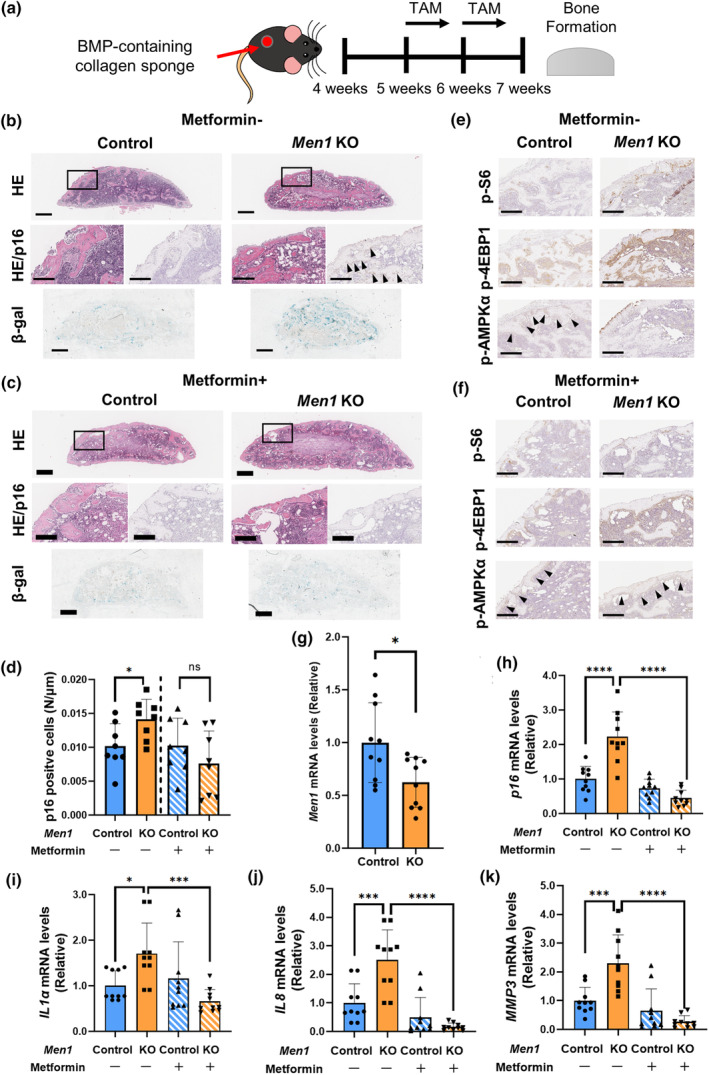
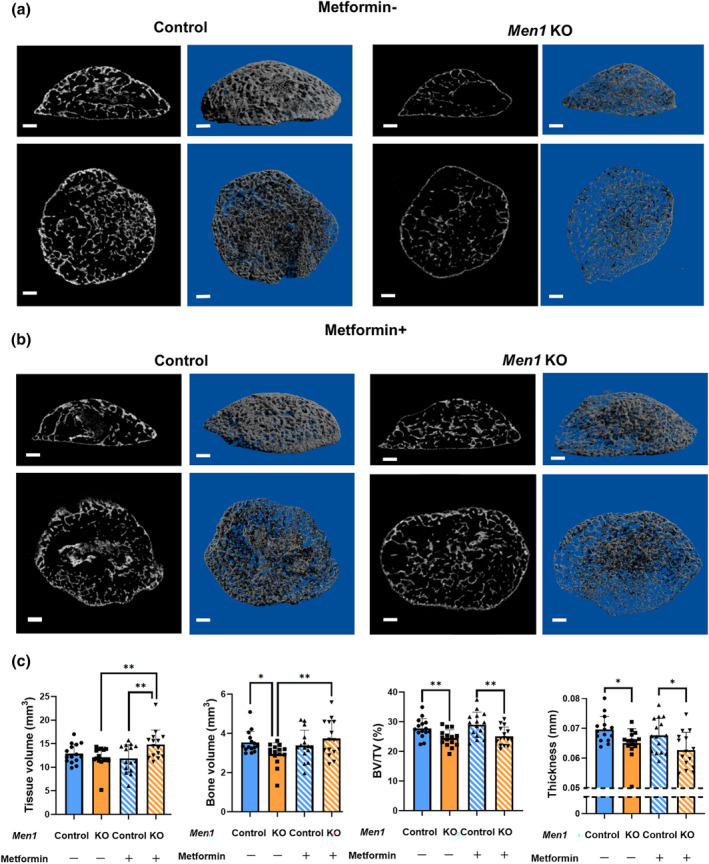
Recent evidence suggests an association between age-related osteoporosis and cellular senescence in the bone; however, the specific bone cells that play a critical role in age-related osteoporosis and the mechanism remain unknown. Results revealed that age-related osteoporosis is characterized by the loss of osteoblast Men1. Osteoblast-specific inducible knockout of Men1 caused structural changes in the mice bones, matching the phenotypes in patients with age-related osteoporosis. Histomorphometrically, Men1-knockout mice femurs decreased osteoblastic activity and increased osteoclastic activity, hallmarks of age-related osteoporosis. Loss of Men1 induces cellular senescence via mTORC1 activation and AMPK suppression, rescued by metformin treatment. In bone morphogenetic protein-indued bone model, loss of Men1 leads to accumulation of senescent cells and osteoporotic bone formation, which are ameliorated by metformin. Our results indicate that cellular senescence in osteoblasts plays a critical role in age-related osteoporosis and that osteoblast-specific inducible Men1-knockout mice offer a promising model for developing therapeutics for age-related osteoporosis.

Keywords: AMPK; Men1; cellular senescence; mTORC1; osteoporosis.


Conflict of interest statement

The authors declare that they have no conflict of interest.

Figures

FIGURE 1
FIGURE 1
Structural analysis of bones in the trunk. (a) Micro‐computed tomography (μCT) analysis of the femur of wild‐type 2‐month‐old (young, n = 12) and 24‐month‐old (aged, n = 12) mice, including bone volume (BV)/tissue volume (TV), cancellous thickness, cancellous bone mineral density (BMD), cancellous tissue mineral density (TMD), cortical porosity, cortical thickness, cortical BMD, cortical TMD, and bone marrow area. (b) Relative Men1 mRNA levels to young mice in the spine bone. Young mice (n = 10), aged mice (n = 10). (c) Experimental design for deleting the Men1 gene of osteoblasts. Men1 flox/flox mice (Control) and Men1 flox/flox; Col1a1‐cre/ERT2 mice (Men1 KO) received tamoxifen (TAM) treatment at 10 mg/kg/day for 4 days at 4, 6, and 8 weeks of age. Mice were euthanized and analyzed at 9 weeks of age. (d) Representative μCT sagittal images of the Control and Men1 KO femur from 9‐week‐old mice. Upper: two‐dimensional image; lower: three‐dimensional reconstructed image. Scale bars, 1 mm. (e) Representative μCT axial images of the Control and Men1 KO femur from 9‐week‐old‐ mice at 1.5 mm proximal to the distal growth plate. Upper: two‐dimensional image; lower: three‐dimensional cortical bone image. Scale bars, 1 mm. (f) Micro‐CT analysis of the femur of 9‐week‐old Control (n = 12) and Men1 KO (n = 12) mice, including cortical porosity, cortical thickness, cortical BMD, cortical TMD, and bone marrow area. (g) Result of biomechanical testing in 9‐week‐old Control (n = 5) and Men1 KO (n = 5) mice, including ultimate load, displacement at fracture, stiffness, and post‐yield displacement. Data represent mean ± SD (error bars). *p < 0.05, **p < 0.01, ***p < 0.001, ****p < 0.0001 by two‐tailed Student's t‐test (unpaired). ns, not statistically significant.
FIGURE 2
FIGURE 2
Histological characteristics of Men1‐deficient bones. (a) Representative histological images of the femur bone from 9‐week‐old Men1 flox/flox (Control) mice and Men1 flox/flox; Col1a1‐cre/ERT2 (Men1 KO) mice. Hematoxylin and eosin staining (HE) and p16 immunostaining. Lower panels are enlarged images of the rectangular area of the upper image. Arrows indicate p16‐positive cells. Scale bars, 500 μm (upper) and 50 μm (lower). (b) Representative fluorescent images of the femur from 9‐week‐old Control and Men1 KO mice. Scale bars, 50 μm. Arrows indicate the space between the double‐stained lines. (c) Histomorphometric parameters of bone formation in 9‐week‐old Control (n = 5) and Men1 KO (n = 5) mice, including mineral apposition rate (MAR) and bone formation rate (BFR)/bone surface (BS). (d) Histomorphometric parameters of bone structure in 9‐week‐old Control (n = 5) and Men1 KO (n = 5) mice, including bone volume (BV)/tissue volume (TV) ratio and trabecular thickness (Tb.Th). (e) Histomorphometric parameters of osteoblasts in 9‐week‐old Control (n = 5) and Men1 KO (n = 5) mice, including number of osteoblasts (N.Ob)/BS and osteoblast surface (Ob.S)/BS. (f) Histomorphometric parameters of osteoclasts in 9‐week‐old Control (n = 5) and Men1 KO (n = 5) mice, including number of osteoclasts (N.Oc)/BS and osteoclast surface (Oc.S)/BS. (g) Representative RANKL, OPG immunostaining images of the femur bone from 9‐week‐old Control and Men1 KO mice. Scale bars, 50 μm. Data represent mean ± SD (error bars). *p < 0.05, **p < 0.01, ***p < 0.001 by two‐tailed Student's t‐test (unpaired). ns, not statistically significant.
FIGURE 3
FIGURE 3
Osteoblast senescence induced by Men1 deficiency in vitro. (a) Senescence‐associated galactosidase (SA β‐Gal) staining of osteoblasts from the Men1 flox/flox murine mice calvaria. Osteoblasts were infected with eGFP adenovirus (Ad‐GFP, Control) and Cre recombinase adenovirus (Ad‐Cre‐GFP, Men1 KO). Passage (P) 3 (replicative stress: −) and P6 (Replicative stress: +) cells were used for the experiments. Scale bars, 250 μm. (b) Quantitative evaluation of β‐Gal‐positive cells in Control (n = 10 fields) and Men1 KO (n = 10 fields) mice. (c) Relative mRNA levels of Men1 to Control osteoblasts (Replicative stress: −). Control osteoblasts (Replicative stress: −), n = 5; Men1 KO osteoblasts (Replicative stress: −), n = 5. (d–h) Relative mRNA levels of p16, IL1α, IL6, IL8, and MMP3 to Control osteoblasts (Replicative stress: −). Control osteoblasts (Replicative stress: −) (n = 5), Men1 KO osteoblasts (Replicative stress: −) (n = 5), Control osteoblasts (Replicative stress: +) (n = 5), and Men1 KO osteoblasts (Replicative stress: +) (n = 5). (i) Immunoblotting to evaluate the expression of factors downstream of mTORC1. (j) Immunoblotting of AMPKα in control osteoblasts (Replicative stress: −), Men1 KO osteoblasts (Replicative stress: −), Control osteoblasts (Replicative stress: +), and Men1 KO osteoblasts (Replicative stress: +). Data represent mean ± SD (error bars). *p < 0.05, **p < 0.01, ***p < 0.001, ****p < 0.0001 by two‐tailed Student's t‐test (unpaired) (c), one‐way ANOVA followed by Sidak's test (b, d–h). ns, not statistically significant.
FIGURE 4
FIGURE 4
Senescent bone formation in natural aging. (a) Schema of establishment of the ectopic bone formation model. A BMP‐containing collagen sponge was set underneath the fascia of 2‐month‐old (young) and 24‐month‐old mice (aged) mice. After 3 weeks, the formed ectopic bone was evaluated. (b) Representative μCT sagittal images of the ectopic bone. Scale bars, 1 mm. (c) Micro‐CT analysis of the ectopic bone in young (n = 8) and aged (n = 8) mice, including tissue volume (TV), bone volume (BV), BV/TV, and thickness. (d) Representative histological images of the ectopic bone in young and aged mice. Hematoxylin and eosin staining (HE) and p16 immunostaining. Lower panels are enlarged images of the rectangular area of upper panels. Arrows indicate p16‐positive cells. Scale bars, 500 μm (upper) and 100 μm (lower). (e) Quantitative evaluation of p16‐positive cells in young (n = 5) and aged (n = 5) mice. (f) Representative beta‐galactosidase staining images of the ectopic bone in young and aged mice. Scale bars, 500 μm. (g) Representative histological images of the ectopic bone in young and aged mice. p‐S6 and p‐4EBP1 immunostaining. Scale bars, 100 μm. (h) Relative mRNA levels of p16, p21, IL1α, IL8, and MMP3 to young mice. Young mice (n = 8) and aged mice (n = 8). (i) Relative Men1 mRNA levels to young mice. Young mice (n = 8) and aged mice (n = 8). *p < 0.05, **p < 0.01 by two‐tailed Student's t‐test (unpaired). Data represent mean ± SD (error bars). ns, not statistically significant.
FIGURE 5
FIGURE 5
Characteristics of Men1 knockout bone formation. (a) Schema of the ectopic bone formation model of Men1 flox/flox (Control) and Men1 flox/flox; Col1a1‐cre/ERT2 (Men1 KO) mice. (b) Representative histological images of Control and Men1 KO ectopic bone without metformin administration from 7‐week‐old mice. Hematoxylin and eosin staining (HE), p16 immunostaining, and beta‐galactosidase (β‐Gal) staining. Second (HE, p16) images are enlarged images of the rectangular area of the first (HE) images. Arrows indicate p16‐positive cells. Scale bars, 500 μm (first, third images) and 200 μm (second images). (c) Representative histological images of Control and Men1 KO ectopic bone with metformin administration from 7‐week‐old mice. HE, p16 immunostaining, and β‐Gal staining. Second (HE, p16) images are enlarged images of the rectangular area of the first (HE) images. Scale bars, 500 μm (first, third images) and 200 μm (second images). (d) Quantitative evaluation of p16‐positive cells relative to Control bone (metformin: −) (n = 8) in Control bone (metformin: −) (n = 8), Men1 KO bone (metformin: −) (n = 8), Control bone (metformin: +) (n = 8), and Men1 KO bone (metformin: +) (n = 8) from 7‐week‐old mice. (e) Representative immunostaining images for p‐S6, p‐4EBP1, and p‐AMPKα of Control and Men1 KO ectopic bone without metformin administration from 7‐week‐old mice. Arrows indicate p‐AMPKα positive cells. Scale bars, 200 μm. (f) Representative immunostaining images for p‐S6, p‐4EBP1, and p‐AMPKα of Control and Men1 KO ectopic bone with metformin administration from 7‐week‐old mice. Arrows indicate p‐AMPKα positive cells. Scale bars, 200 μm. (g) Relative mRNA levels of Men1 to Control bone (metformin: −) in Control bone (metformin: −) (n = 10), Men1 KO bone (metformin: −) (n = 10) from 7‐week‐old mice. (h–k) Relative mRNA levels of p16, IL1α, IL8, and MMP3 to Control bone (metformin: −) in Control bone (metformin: −) (n = 10), Men1 KO bone (metformin: −) (n = 10), Control bone (metformin: +) (n = 10), and Men1 KO bone (metformin: +) (n = 10) from 7‐week‐old mice. Data represent mean ± SD (error bars). *p < 0.05, ***p < 0.001, ****p < 0.0001 by two‐tailed Student's t‐test (unpaired) (d, g), one‐way ANOVA followed by Sidak's test (h–k). ns, not statistically significant.
FIGURE 6
FIGURE 6
Miro‐computed tomography (μCT) analysis of ectopic bone with osteoblast senescence. (a) Representative μCT images of the ectopic bone of Men1 flox/flox (Control) and Men1 flox/flox; Col1a1‐cre/ERT2 (Men1 KO) mice without metformin administration from 7‐week‐old mice. Sagittal (upper) and coronal (lower) images. Two‐dimensional images (left) and three‐dimensional reconstructed images (right). Scale bars, 500 μm. (b) Representative μCT images of the ectopic bone of Control and Men1 KO mice with metformin administration from 7‐week‐old mice. Sagittal (upper) and coronal (lower) images. Two‐dimensional images (left) and three‐dimensional reconstructed images (right). Scale bars, 500 μm. (c) Micro‐CT analysis of the ectopic bone in Control (metformin: −) (n = 15), Men1 KO (metformin: −) (n = 15), Control bone (metformin: +) (n = 15), and Men1 KO (metformin: +) (n = 15) mice from 7‐week‐old mice, including tissue volume (TV), bone volume (BV), BV/TV, and thickness. Data represent mean ± SD (error bars). *p < 0.05, **p < 0.01 by one‐way ANOVA followed by Fisher's LDS test.

References

    1. Anisimov, V. N. , Berstein, L. M. , Popovich, I. G. , Zabezhinski, M. A. , Egormin, P. A. , Piskunova, T. S. , Semenchenko, A. V. , Tyndyk, M. L. , Yurova, M. N. , Kovalenko, I. G. , & Poroshina, T. E. (2011). If started early in life, metformin treatment increases life span and postpones tumors in female SHR mice. Aging (Albany NY), 3(2), 148–157. 10.18632/aging.100273 - DOI - PMC - PubMed
    1. Aspray, T. J. , & Hill, T. R. (2019). Osteoporosis and the ageing skeleton. Sub‐Cellular Biochemistry, 91, 453–476. 10.1007/978-981-13-3681-2_16 - DOI - PubMed
    1. Baker, D. J. , Childs, B. G. , Durik, M. , Wijers, M. E. , Sieben, C. J. , Zhong, J. , Saltness, R. A. , Jeganathan, K. B. , Verzosa, G. C. , Pezeshki, A. , Khazaie, K. , Miller, J. D. , & van Deursen, J. M. (2016). Naturally occurring p16Ink4a‐positive cells shorten healthy lifespan. Nature, 530(7589), 184–189. 10.1038/nature16932 - DOI - PMC - PubMed
    1. Bala, Y. , Zebaze, R. , & Seeman, E. (2015). Role of cortical bone in bone fragility. Current Opinion in Rheumatology, 27(4), 406–413. 10.1097/bor.0000000000000183 - DOI - PubMed
    1. Childs, B. G. , Baker, D. J. , Kirkland, J. L. , Campisi, J. , & van Deursen, J. M. (2014). Senescence and apoptosis: Dueling or complementary cell fates? EMBO Reports, 15(11), 1139–1153. 10.15252/embr.201439245 - DOI - PMC - PubMed

LinkOut - more resources