. 2024 Oct 9;15(1):8757.
doi: 10.1038/s41467-024-52675-x.

Annexin A2 promotes proliferative vitreoretinopathy in response to a macrophage inflammatory signal in mice

Affiliations

Annexin A2 promotes proliferative vitreoretinopathy in response to a macrophage inflammatory signal in mice

Min Luo et al. Nat Commun. .

Abstract

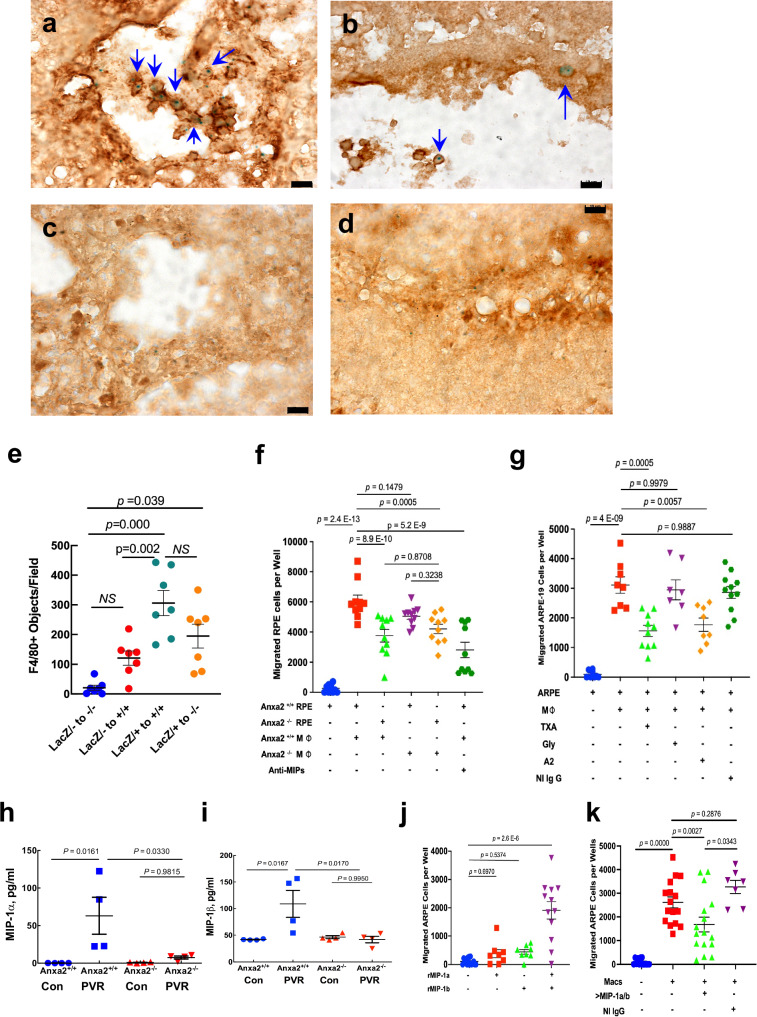
Proliferative vitreoretinopathy is a vision-threatening response to penetrating ocular injury, for which there is no satisfactory treatment. In this disorder, retinal pigment epithelial cells, abandon their attachment to Bruch's membrane on the scleral side of the retina, transform into motile fibroblast-like cells, and migrate through the retinal wound to the vitreal surface of the retina, where they secrete membrane-forming proteins. Annexin A2 is a calcium-regulated protein that, in complex with S100A10, assembles plasmin-forming proteins at cell surfaces. Here, we show that, in proliferative vitreoretinopathy, recruitment of macrophages and directed migration of retinal pigment epithelial cells are annexin A2-dependent, and stimulated by macrophage inflammatory protein-1α/β. These factors induce translocation of annexin A2 to the cell surface, thus enabling retinal pigment epithelial cell migration following injury; our studies reveal further that treatment of mice with intraocular antibody to either annexin A2 or macrophage inflammatory protein dampens the development of proliferative vitreoretinopathy in mice.


Conflict of interest statement

The authors declare no competing interests.

Figures

Fig. 1
Fig. 1. Expression of A2 promotes dispase-induced PVR.
At two ad, four eh, or six (il) weeks after intravitreal injection of dispase (0.9 units, OS), Anxa2+/+ (a, b, e, f, i, j) or Anxa2-/- (c, d, g, h, k, l) mice were sacrificed and the eyes harvested, fixed, and embedded. Representative, five-micron, hematoxylin- and eosin- (H and E) stained sections through the injection site (boxed) are shown. Scale bars for a, c, e, g, i, and k are 200 μm, and for b, d, f, h, j, and l, 20 μm. Figures ad and il are representative of 3 separate experiments. Figures eh are representative of 8 separate experiments. (m, n) Each point represents the average score for 3 sections from a given mouse; 5 or 6 mice were evaluated in each of the six experimental groups. Anxa2+/+ and Anxa2-/- mice are shown in blue and red, respectively at 2, 4, and 6 weeks. Sections were evaluated by 4 trained observers using a standard algorithm (Suppl. Figure 1) to derive mean ± sem scores for PVR histology (m) and RPE migration (n). p values were determined by one-tailed Student’s t test. Source data for m, and n are provided as a Source Data file.
Fig. 2
Fig. 2. Expression of A2 in human epiretinal membranes.
Brightfield (a) and adjacent immunofluorescence (b) images of epiretinal membrane harvested at surgery demonstrate pigment granules, and associated anti-A2 immunoreactive material (red) at the vitreal border. DAPI staining (blue) reveals the highly cellular nature of the membrane. c, d Confocal images of sections through a human epiretinal membrane stained with anti-annexin A2 (red) and either anti-CD68 (c, green), or anti-RPE65 (d, green). Nuclei are stained with DAPI (blue). Lower right insets show cellular co-staining for A2 and either CD68 (c) or RPE65 (d). Figures a-d are representative of 3 separate samples.
Fig. 3
Fig. 3. Immunohistologic evaluation of PVR in Anxa2+/+ and Anxa2-/- mice.
Eyes from Anxa2+/+ and Anxa2-/- mice were harvested 2 weeks after dispase injection, and representative sections (5-μm) deparaffinized and stained with antibodies directed against CD68, A2, or RPE65 in different combinations. Nuclei are stained with DAPI (blue). a, b CD68 (red, rabbit anti-CD68, Abcam AB125212; 1:200)with donkey anti-rabbit Cy3, Jackson ImmunoResearch Laboratories, 711-165-152; 1:300) and A2 (green, goat anti-annexin A2, R&D Systems AF3928; 1:50 with donkey anti-goat Alexa 647, Invitrogen A21447; 1:100) staining in Anxa2+/+ (a) and Anxa2-/- (b) retinas. Cells co-expressing CD68 and A2 are abundant in Anxa2+/+ retinas, but rare in Anxa2-/- retinas. c, d A2 (red, rabbit anti-annexin A2, Cell Signaling 8235S; 1:300 with donkey anti-rabbit Cy3, Jackson ImmunoResearch Laboratories 711-165-152; 1:300) and RPE-65 (green, mouse anti-RPE-65, Novus NB100-355; 1:150 with donkey anti-mouse Alexa 647, Invitrogen A31571; 1:100) staining in Anxa2+/+ (c) and Anxa2-/- (d) retinas. A2 is expressed in RPE-65-positive cells posterior to the retina and within the retina of the dispase-injected Anxa2+/+ eye, whereas RPE-65 expression is confined to the posterior retina in the absence of A2 in the dispase-injected Anxa2-/- eye. e, f Staining for smooth muscle actin (red, mouse anti-SMA, Cy3, Sigma C6198; 1:50) and CD68 (green, rabbit anti-CD68, Abcam AB125212; 1:200 with donkey anti-rabbit Cy5, Jackson ImmunoResearch Laboratories; 711-175-152; 1:100) shows that they are not expressed in the same cells in retinas from either Anxa2+/+ (e) or Anxa2-/- (f) dispase-injected mice. SMA labels blood vessel smooth muscle cells, fibroblasts, and fibroblast-like cells in the damaged retina, whereas CD68, expression in presumptive macrophages and microglial cells, remains separate. In the Anxa2-/- eye, SMA is expressed in blood vessels; CD68-positive cells are rare. g, h Staining for SMA (red, rabbit anti-SMA, Cell Signaling 19245 T; 1:300 with donkey anti-rabbit Cy3, Jackson ImmunoResearch Laboratories 711-165-152; 1:300) and RPE-65 (green, mouse anti-RPE-65, Novus NB100-355; 1:150 with donkey anti-mouse Alexa 647, Invitrogen A31571; 1:100) in Anxa2+/+ (g) and Anxa2-/- (h) dispase-injected eyes. In the Anxa2+/+ retina, cells doubly positive for RPE and SMA are found in the RPE layer and also within the retina. In Anxa2-/- dispase-injected eyes, RPE cells lack SMA expression and do not enter the retina. The inset in g shows SMA-positive cells (red) migrating through the injection site of a dispase-injected Anxa2+/+ eye. Scale bars are 20 μm for a-h and 50 μm for inset in (g). i, j, k Quantification of fluorophore signals based on binary area fraction for CD68, RPE65, and SMA signals, respectively, in Anxa2+/+ (blue) and Anxa2-/- (red) retinal tissue across 14-27. The data in (i) represent analysis of 21 fields from 5 Anxa2-/- mice, and 23 fields from 5 Anxa2+/+ mice. The data in (j) represent analysis of 14 fields from 5 Anxa2-/- mice, and 17 fields from 5 Anxa2+/+ mice. The data in (k) represent analysis of 26 fields from 5 Anxa2-/- mice, and 27 fields from 5 Anxa2+/+ mice. Shown for (i, j, k) are mean values ± SE, with p values determined by one-tailed Student’s t test. Source data for (i, j, and k) are provided as a Source Data file.
Fig. 4
Fig. 4. Role of A2 expression in macrophage-mediated PVR.
Anxa2+/+ (a, c) and Anxa2-/- (b, d) mice underwent bone marrow ablation and rescue with either Anxa2LacZ/+ (a, b) or Anxa2LacZ/- (c, d) bone marrow. At five weeks, mice received intravitreal dispase. Eyes were harvested 1 week later and sections stained for expression of X-gal (blue) and F4/80 (dark brown). Arrows (a, b) indicate doubly-positive cells. Scale bars are 10 μm for ad. Images in a-d are representative of 3 separate experiments. e Frozen, OCT-embedded sections (40x) of retinas from mice transplanted with bone marrow that express lacZ were detected by X-Gal staining and the macrophage marker, rabbit anti-F4/80 (Abcam AB111101; 1:100 with ImmPRESS® HRP Goat Anti-Rabbit IgG Polymer Detection Kit, Peroxidase, Vector Laboratories, MP-7451; Ready-to-Use Kit) and examined independently by 3 masked observers. The enumerated F4/80-positive objects per 40x field were plotted for 7 sections representing 2–4 mice per group. f Murine primary RPE cells (passage 5; 2 × 104 cells/well; Anxa2+/+ or Anxa2-/-) were cultured on 3 μm, laminin-coated Transwell filters positioned above chambers containing Anxa2+/+ or Anxa2-/- bone marrow-derived macrophages (2 × 105 cells/well). At 18 h, residual RPE cells from the upper surface of the filter were removed, and migrated cells estimated as described (Methods). For antibody blocking, polyclonal goat anti-mMIP-1α (1 µg/ml) and monoclonal rat anti-mMIP-1β (1 µg/ml) were added to the lower chamber. Shown are data, combined from 2 separate experiments, for 10 wells/group. (g) THP-1-induced migration of ARPE-19 cells plated atop laminin-coated filters was assessed at 18 h in the presence of mouse anti-human A2 IgG (1 µg/ml), mouse IgG1 control (NI IgG, 1 µg/ml), tranexamic acid (TXA, 2 mM), or glycine (2 mM), as described in f. Shown are data, combined from 2 separate experiments, for 7–11 wells/group. h, i Extracts of retinas (4 retinas/group) from non-injected control mice or those receiving intravitreal dispase were assayed at 24 h for MIP-1α (h) and MIP-1β (i) by ELISA. j ARPE-19 cells atop laminin-coated Transwell filters were stimulated with 250 ng/ml rhMIP-1α and/or 250 ng/ml rhMIP-1β in the lower chamber. Cell migration was quantified as in f. Shown are data, combined from 4 separate experiments, for 8–16 wells/group. k THP-1-induction of ARPE-19 cell migration was evaluated as in f in the presence of goat anti-human MIP-1α/β (1 ug/ml) versus non-immune goat IgG. Shown are data, combined from 4 separate experiments, for 7-16 wells/group. Shown for (e-k) are mean values ± SE, with p values determined by unpaired one-way ANOVA and the post hoc Tukey test. Source data for e-k are provided as a Source File.
Fig. 5
Fig. 5. MIPs induce Src-dependent tyrosine phosphorylation and translocation of A2 to the cell surface.
a ARPE-19 cells were incubated for 18 h with basic medium (Basic), activated THP-1 cell conditioned medium (CM), or THP-1 CM with RPE CM with or without addition of anti-human MIP-1α/β or non-immune IgG. Cell surface A2 (sA2) was labeled using membrane impermeable biotinylation and captured with NeutrAvidin agarose beads. Labeled cell surface proteins were resolved by SDS-PAGE and cell surface (sA2) and total cell lysate A2 (tA2) probed by immunoblot with mouse (BD #610069) or rabbit (Cell Signaling #8235) anti-A2 IgG. b Pixel density of immunoblotted bands from 3-5 separate experiments were quantified and normalized to the unstimulated sample (Basic). c ARPE-19 cells were incubated with basic media with or without recombinant human MIP-1α/β (MIPs, 200 ng/ml each), and with or without the Src kinase inhibitor PP2 or its control PP3 (10 µM, 3 h). Cell lysates were probed for pY23-A2, tA2, pY416 activated Src, total Src (tSrc), and GAPDH, as a loading control. d Pixel density of immunoblotted bands from 3-6 separate experiments were quantified and normalized to the unstimulated sample (Basic). e ARPE-19 cells were incubated with or without recombinant human MIP-1α/β (MIPs, 200 ng/ml each) in the presence or absence of PP2 or PP3, as in (c). f Pixel density of immunoblotted bands from 3–7 separate experiments were quantified and normalized to the unstimulated sample (Basic). Shown for (b, d, f) are mean values ± SE, with p values determined by unpaired one-way ANOVA and the post hoc Tukey test. Source data for (b, d, and f) are provided as a Source File.
Fig. 6
Fig. 6. Effect of anti-annexin A2 IgG pretreatment on dispase-induced PVR.
a, b Wild type C57Bl/6 mice were pretreated with an anterior chamber injection of anti-A2 IgG (1A7 or 2E6), control IgG (1D4), or PBS, two days prior to intravitreal dispase injection. At 2 (a) and 4 (b) weeks, the eyes were harvested, fixed, embedded, sectioned, and stained with H and E. Scale bars for (a and b) are 200 um. PVR histology (c) and RPE migration (d) scores were recorded by trained, masked observers. Shown for (c and d) are mean ± SE, n = 7 animals/group. p values were determined by unpaired one-way ANOVA and the post hoc Tukey test. Source data for (c and d), are provided as a Source File.
Fig. 7
Fig. 7. Effect of anti-MIP-1α and anti-MIP-1β and role of MIPs in PVR in mice.
a, b Wild type C57Bl/6 mice received anterior chamber injections (3 ul) of anti-MIP-1α (30 μg/ml), anti-MIP-1β (30 μg/ml), or a combination of the two 1 day after intravitreal injection of dispase. At 4 weeks, the eyes were harvested, fixed, embedded, sectioned, and stained with H and E. PVR histology (a) and RPE migration (b) scores were recorded by trained, masked observers. Shown are mean ± SE, n = 5–7 animals/group. Each point represents the average score for 2 trained, independent observers for standard sections from each of 3 or 4 mice in each experimental group. Shown for (a and b) are mean values ± SE, with p values determined by unpaired one-way ANOVA and the post hoc Tukey test. ch Working model for MIP-dependent development of PVR in the dispase model in mice. c RPE cells occupy the space between the retina and Bruch’s membrane. d Upon injury, circulating blood monocytes are released into the wound and differentiate into macrophages. e Macrophages elaborate MIP-1α/β, which enables further macrophage migration, disengagement of RPE cells from Bruch’s membrane, and migration of RPE cells through the retinal would to the vitreal surface of the retina. (f) MIP-1α/β signals kinase-mediated tyrosine phosphorylation of A2, thereby promoting its translocation to the surface of RPE cells, allowing cell surface activation of plasmin (PN) from plasminogen (Plg). g Plasmin-bearing, fibroblast-like RPE cells migrate through the retina to the vitreal surface, and (h) secrete scar-forming proteins that induce tractional detachment of the retina. Source data for a and b, are provided as a Source File. Panels c-h were created with permission by adapting Fig. 1 from Chikafumi Chiba (ref. ).

References

    1. Morescalchi, F. et al. Proliferative vitreoretinopathy after eye injuries: an overexpression of growth factors and cytokines leading to a retinal keloid. Mediators Inflamm.2013, 1–12 (2013). - PMC - PubMed
    1. Pennock, S., Haddock, L. J., Eliott, D., Mukai, S. & Kazlauskas, A. Is neutralizing vitreal growth factors a viable strategy to prevent proliferative vitreoretinopathy? Prog. Retin Eye Res. 40, 16–34 (2014). - PubMed
    1. Pastor, J. C., Rodriguez de la Rua, E. & Martin, F. Proliferative vitreoretinopathy: risk factors and pathobiology. Prog. Retinal Eye Res. 21, 127–144 (2002). - PubMed
    1. Kwon, O. W., Song, J. H. & Roh, M. I. Retinal detachment and proliferative vitreoretinopathy. Dev. Ophthalmol.55, 154–162 (2016). - PubMed
    1. Idrees, S., Sridhar, J. & Kuriyan, A. E. Proliferative vitreoretinopathy: a review. Int Ophthalmol. Clin.59, 221–240 (2019). - PMC - PubMed

Publication types

LinkOut - more resources