. 2024 Oct 9;9(1):281.
doi: 10.1038/s41392-024-01978-y.

AXIN1 boosts antiviral response through IRF3 stabilization and induced phase separation

Affiliations

AXIN1 boosts antiviral response through IRF3 stabilization and induced phase separation

Dan-Ling Dai et al. Signal Transduct Target Ther. .

Abstract

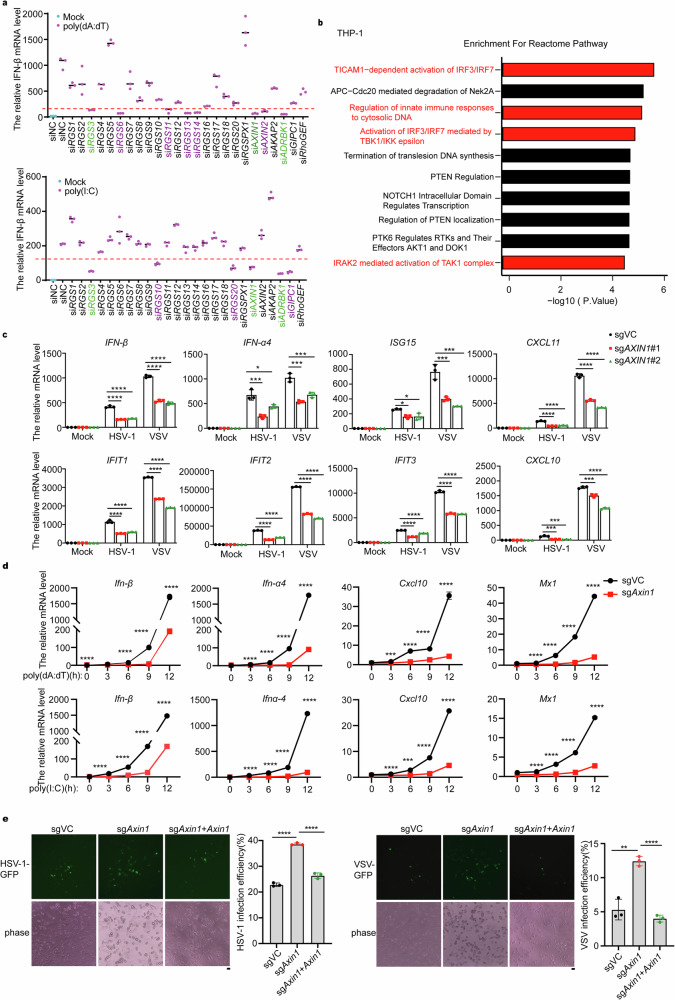
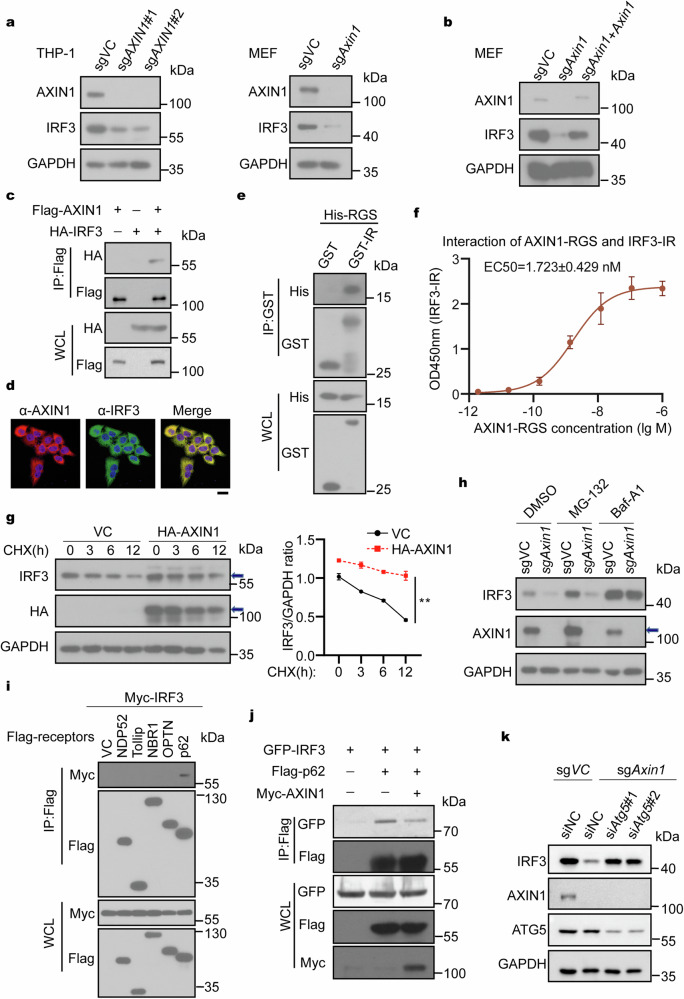
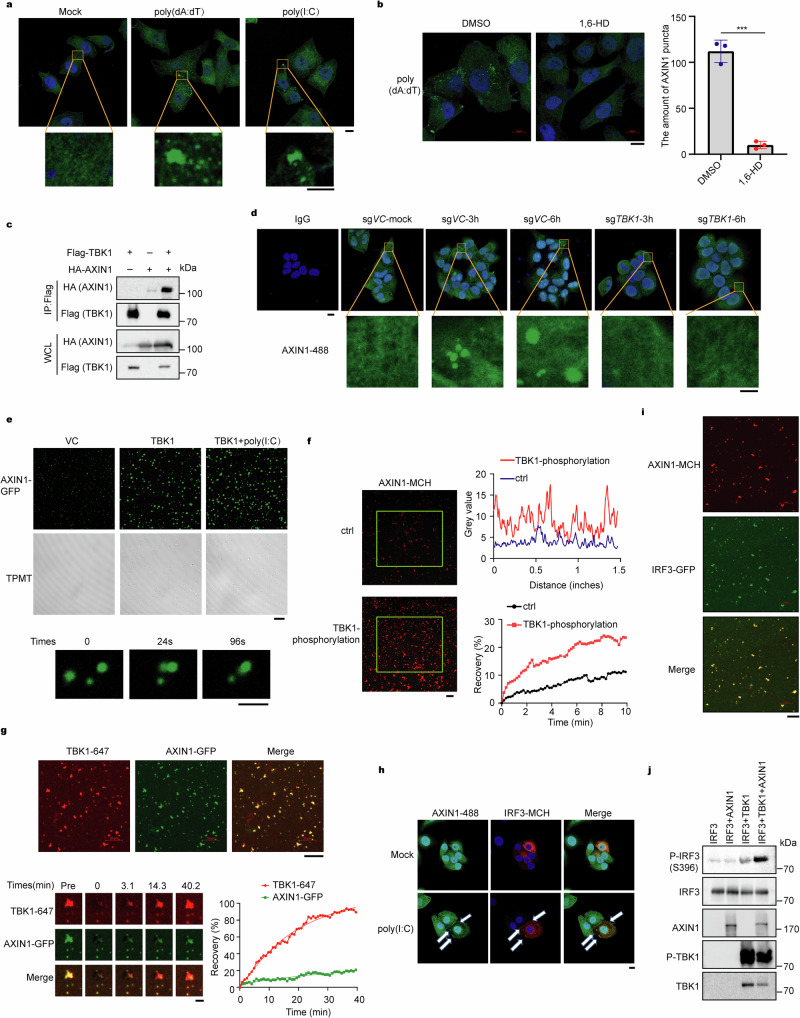
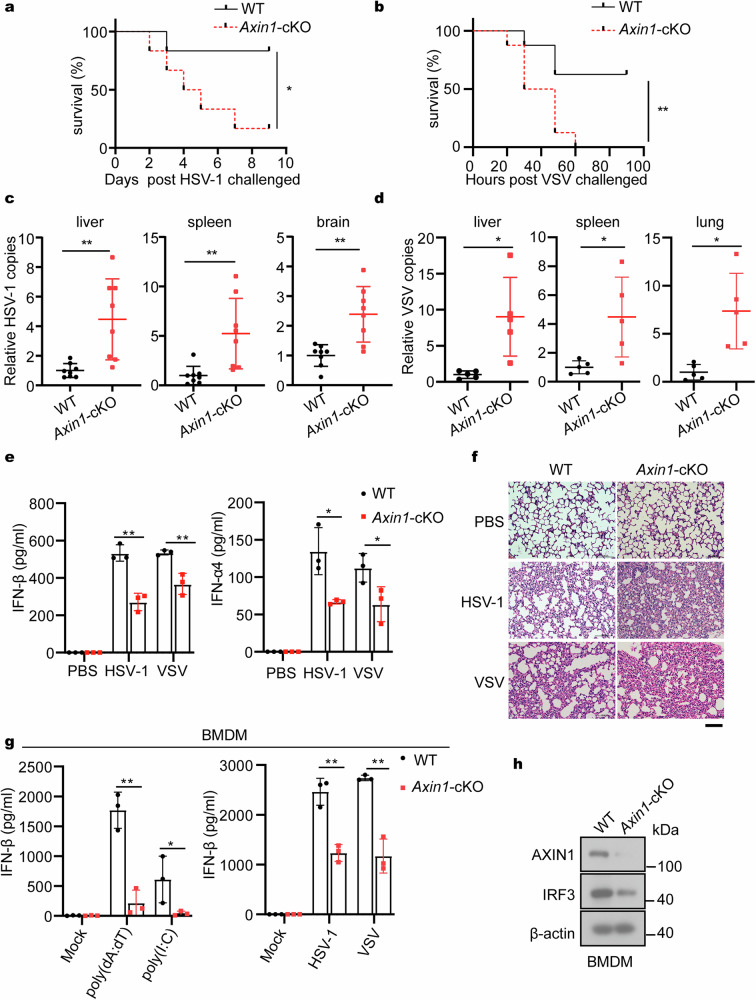
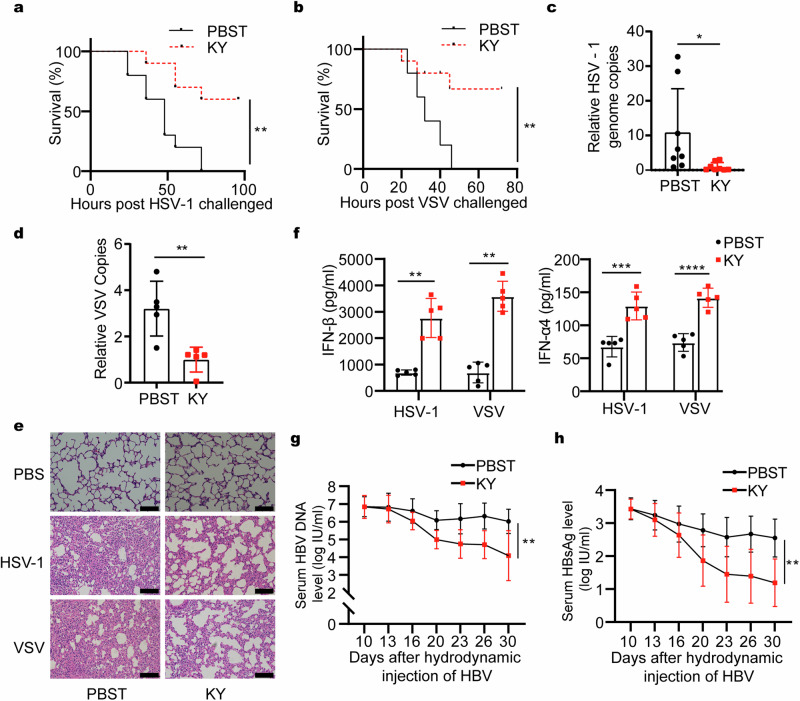
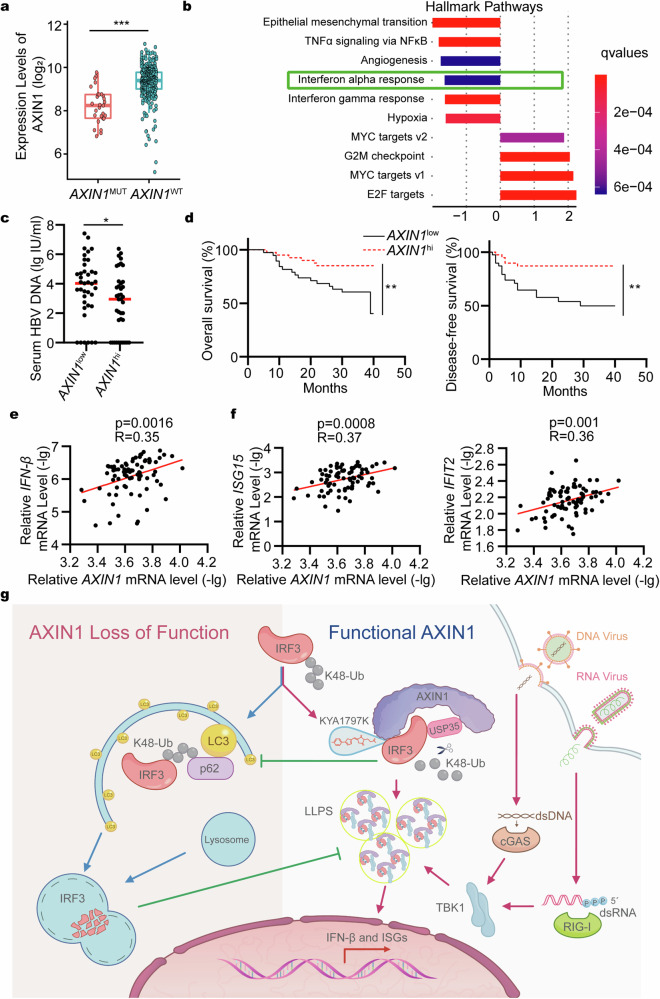
Axis inhibition protein 1 (AXIN1), a scaffold protein interacting with various critical molecules, plays a vital role in determining cell fate. However, its impact on the antiviral innate immune response remains largely unknown. Here, we identify that AXIN1 acts as an effective regulator of antiviral innate immunity against both DNA and RNA virus infections. In the resting state, AXIN1 maintains the stability of the transcription factor interferon regulatory factor 3 (IRF3) by preventing p62-mediated autophagic degradation of IRF3. This is achieved by recruiting ubiquitin-specific peptidase 35 (USP35), which removes lysine (K) 48-linked ubiquitination at IRF3 K366. Upon virus infection, AXIN1 undergoes a phase separation triggered by phosphorylated TANK-binding kinase 1 (TBK1). This leads to increased phosphorylation of IRF3 and a boost in IFN-I production. Moreover, KYA1797K, a small molecule that binds to the AXIN1 RGS domain, enhances the AXIN1-IRF3 interaction and promotes the elimination of various highly pathogenic viruses. Clinically, patients with HBV-associated hepatocellular carcinoma (HCC) who show reduced AXIN1 expression in pericarcinoma tissues have low overall and disease-free survival rates, as well as higher HBV levels in their blood. Overall, our findings reveal how AXIN1 regulates IRF3 signaling and phase separation-mediated antiviral immune responses, underscoring the potential of the AXIN1 agonist KYA1797K as an effective antiviral agent.


Conflict of interest statement

The authors declare no competing interests.

Figures

Fig. 1
Fig. 1
AXIN1 positively regulates DNA and RNA virus-induced IFN-I signaling. a qPCR analysis of IFN-β mRNA in THP-1 cells transfected with siRNAs targeting 25 RGS family members followed by treatment with 2 μg/ml poly(dA:dT) or poly(I:C) (n = 3). In the graph, genes are marked as purple or green if their knockdown resulted in significantly impaired IFN-β expression after either or both of poly(dA:dT) or poly(I:C) induction. b Pathway enrichment analysis of differentially expressed proteins (p < 0.05) between vector control (sgVC) (n = 2) or AXIN1-KO (sgAXIN1) THP-1 cells (n = 3) performed using REACTOME website tools (https://reactome.org/). The top 10 enriched pathways are shown. c qPCR analysis of IFN-β and IFN-α4 mRNAs and indicated ISGs in vector control (sgVC) or AXIN1-KO (sgAXIN1#1, sgAXIN1#2) THP-1 cells infected with or without HSV-1 (MOI = 0.5) or VSV (MOI = 1) for 12 h (n = 3). d qPCR analysis of Ifn-β and Ifn-α4 mRNAs and indicated ISGs in vector control (sgVC) or Axin1-KO (sgAxin1) MEFs treated with or without 2 μg/mL poly(dA:dT) or poly(I:C) for the indicated time periods (n = 3). e Microscopic imaging and flow cytometry analysis of sgVC, sgAxin1, and Axin1-reconstituted sgAxin1 MEFs infected with HSV-1-GFP (MOI = 0.2) or VSV-GFP (MOI = 0.05) for 16 h (n = 3). The scale bar indicates a length of 100 μm. Data are shown as mean ± standard deviation (S.D.) and represent three independent experiments. Statistical analyses were performed using (c, e) one-way ANOVA with multiple-comparison test or (d) Student’s two-tailed unpaired t-test. *P < 0.05; **P < 0.01; ***P < 0.001; ****P < 0.0001. AXIN1 axis inhibition protein 1, HSV-1 herpes simplex virus 1, IFN interferon, IRF3 interferon regulatory factor 3, ISGs interferon-stimulated genes, KO knockout, MEFs mouse embryonic fibroblasts, MOI multiplicity of infection, RGS regulator of G-protein signaling, siRNA small interfering RNA, VC vector control, VSV vesicular stomatitis virus
Fig. 2
Fig. 2
AXIN1 interacts with and stabilizes IRF3. a Immunoblotting assay of total IRF3 protein in sgVC or sgAXIN1 MEFs and THP-1 cells. b Immunoblotting assay of IRF3 in Axin1-reconstituted sgAxin1 MEFs. c HEK293T cell lysates co-transfected with HA-IRF3- and Flag-AXIN1-expressing plasmids or vector were immunoprecipitated with anti-Flag beads and immunoblotted with the indicated antibodies. d HeLa cells were immunostained with anti-AXIN1 and anti-IRF3, followed by microscopy analysis. Scale bar represents 20 μm. e The purified His-AXIN1-RGS was immunoprecipitated with GST or GST-IRF3-IR and immunoblotted with the indicated antibodies. f ELISA analysis of the binding affinity of purified GST-IRF3-IR with His-AXIN1-RGS (n = 3). g Immunoblotting assay (left) and relative quantitation (right) of IRF3 in BEAS-2B cells transfected with a plasmid expressing HA-AXIN1 or VC followed by the treatment with 1 μg/mL CHX for the indicated time periods. The arrows indicate the specific proteins of interest. h Immunoblotting assay of IRF3 in sgVC or sgAxin1 MEFs treated with DMSO, 1 μM MG-132, or 1 μM Baf-A1 for 12 h. The arrow indicates the AXIN1 protein. i HEK293T cells were transfected with plasmids expressing Myc-IRF3 and indicated Flag-tagged cargo receptors followed by immunoprecipitation and immunoblotting with the indicated antibodies. j HEK293T cells were transfected with GFP-IRF3, Flag-p62, and Myc-AXIN1 or the related vector control and then subjected to the immunoprecipitation and immunoblot with the designated antibodies. k Immunoblotting assay of IRF3 in sgAxin1 MEFs transfected with RNAi#Atg5 (siAtg5#1, siAtg5#2). Data are shown as mean ± standard deviation (S.D.) and represent three independent experiments. Statistical analyses were performed using (g) two-way ANOVA comparison test. *P < 0.05; **P < 0.01; ***P < 0.001; ****P < 0.0001. ELISA enzyme-linked immunosorbent assay, IFN interferon, IgG Immunoglobulin G, IRF3 interferon regulatory factor 3, WCL whole cell lysate
Fig. 3
Fig. 3
Phosphorylated TBK1 promotes the LLPS of AXIN1. a Immunostaining analysis of endogenous AXIN1 in HeLa cells treated by poly (dA:dT) (1.5 μg/μl) and poly (I:C) (1.5 μg/μl) for 3 h. Scale bar represents 10 μm in the top original image, and it denotes 5 μm in the magnified image. b Immunostaining analysis of endogenous AXIN1 in HeLa cells stimulated by poly (dA:dT) (1.5 μg/μl) followed by treatment with DMSO or 1,6-hexanediol (1,6-HD) for 10 min. Scale bar represents 10 μm. c Immunoprecipitation analysis of Flag-TBK1 and HA-AXIN1 in HEK293T cells. d Immunostaining analysis of endogenous AXIN1 in sgVC or sgTBK1 HeLa cells treated with or without poly (I:C). Scale bar represents 10 μm in the top original image, and it denotes 2 μm in the magnified image. e LLPS of purified AXIN1-GFP (5 μM) treated by TBK1 which was pulled down from cell lysates in HEK293T cells induced with or without poly (I:C) and droplet fusion assay. Scale bar represents 10 μm in the top original image, and it denotes 2 μm in the magnified image. f The fluorescence image of purified AXIN1-MCH (5 μM) treated with or without phosphorylated TBK1 in the presence of 2% PEG8000, followed by the intensity line analysis and FRAP analysis. Scale bar represents 10 μm. g The fluorescence image and FRAP analysis of representative AXIN1-GFP (5 μM) and 647-labeled TBK1 in the mixed droplets. Scale bar represents 10 μm in the top original image, and it denotes 2 μm in the magnified image. h The fluorescence image analysis of endogenous AXIN1 and exogenous IRF3-MCH in HeLa cells treated by poly (I:C) (1.5 μg/μl) for 3 h. The arrow indicates the AXINl co-localized with punctate IRF3. Scale bar represents 10 μm. i Droplet formation of AXIN1-MCH and IRF3-GFP (5 μM) treated with phosphorylated TBK1 in the presence of 2% PEG8000. Scale bar represents 10 μm. j Purified IRF3-MCH was treated with or without phosphorylated TBK1 or MBP-AXIN1-GFP followed by immunoblotting with indicated antibody. VC vector control, CTRL control, MCH mcherry
Fig. 4
Fig. 4
Axin1 conditional knockout mice are more susceptible to DNA and RNA virus infections and produce less IFN-I. a, b Survival analysis of WT or Axin1-cKO mice intravenously injected with (a) 8×10⁶ pfu/g HSV-1 (n = 6) or (b) 1 × 107 pfu/g VSV (n = 8). c qPCR analysis of the virus DNA copy number in liver, spleen, and brain of WT or Axin1-cKO mice intravenously injected with 1×10⁶ pfu/g HSV-1 for 72 h (n = 8). d qPCR analysis of the virus RNA copy number in liver, spleen, and lung of WT or Axin1-cKO mice intravenously injected with 1×10⁶ pfu/g VSV for 48 h (n = 5). e ELISA analysis of serum IFN-β and IFN-α4 in WT or Axin1-cKO mice intravenously injected with 1 × 106 pfu/g HSV-1 or VSV for 24 h (n = 3). f H&E staining showing damages in the lungs of WT or Axin1-cKO mice intravenously injected with 1 × 106 pfu/g HSV-1 or VSV for 48 h, scale bar represent 100 μm. g ELISA analysis of IFN-β in the supernatant of BMDMs from WT or Axin1-cKO mice infected with HSV-1 (MOI = 5) and VSV (MOI = 5) or treated with 3 μg/mL poly(dA:dT) and poly(I:C) for 16 h (n = 3). h Immunoblotting assay of AXIN1 and IRF3 in the VC and Axin1-cKO BMDMs. Data are shown as mean ± standard deviation (S.D.) and represent two independent experiments. Statistical analyses were performed using (a, b) Log-rank (Mantel-Cox) test, (e, g) Student’s two-tailed unpaired t-test, or (c, d) Student’s two-tailed unpaired t-test with Welch’s correction. *P < 0.05; **P < 0.01; ***P < 0.001; ****P < 0.0001. WT wild-type, cKO conditional knockout, BMDM bone-marrow-derived macrophage, ELISA enzyme-linked immunosorbent assay, H&E hematoxylin and eosin, MOI multiplicity of infection
Fig. 5
Fig. 5
A small molecule AXIN1 agonist inhibits HSV-1 and VSV infections via enhancing IFN-I expression. a Microscopy imaging (left) or qPCR analysis (right) indicating the HSV-1 or VSV amount in BEAS-2B (top) and THP-1 cells (bottom) treated with the indicated KYA1797K concentrations followed by HSV-1-GFP (MOI = 0.1; n = 3) or VSV-GFP (MOI = 0.1; n = 4) infection for 16 h. Scale bar represents 100 μm. b ELISA analysis of HBeAg in the supernatant of Hepa1-6 cells treated with the indicated KYA1797K concentrations followed by transfection with HBV plasmids for 48 h (n = 3). c qPCR analysis of the SARS-CoV-2 copy number in the supernatant of BEAS-2B cells treated with different KYA1797K concentrations (n = 3). d, e qPCR analysis of IFN-β and IFN-α4 expression in (d) BEAS-2B (n = 3) and (e) THP-1 cells (n = 4) treated with KYA1797K as indicated concentrations and infected with HSV-1 (MOI = 1) or VSV (MOI = 1) for 12 h. f qPCR analysis of IFN-β and IFN-α4 expression in VC or Axin1-KO MEFs treated with DMSO or KYA1797K (6 μM) followed by transfection with 2 μg/mL poly(I:C) for 6 h (n = 3). g HEK293T cells were transfected with plasmids expressing Myc-AXIN1 and Flag-IRF3 and treated with 12 μM KYA1797K for 12 h followed by immunoprecipitation with anti-Flag beads and immunoblotting with the indicated antibodies. h Immunoblotting assay (left) and relative quantitation (right) of IRF3 in BEAS-2B cells exposed to 12 μM KYA1797K for 12 h, followed by addition of 1 μg/mL CHX for different time periods. Data are shown as mean ± standard deviation (S.D.) and represent three independent experiments. Statistical analyses were performed using (af) one-way ANOVA with Tukey’s multiple-comparison test or (h) two-way ANOVA comparison test. *P < 0.05; **P < 0.01; ***P < 0.001; ****P < 0.0001; ns not significant. Baf-A1 bafilomycin A1, CHX cycloheximide, DMSO dimethyl sulfoxide, MOI multiplicity of infection, SARS-CoV-2 severe acute respiratory syndrome coronavirus 2, KY KYA1797K
Fig. 6
Fig. 6
In vivo KYA1797K treatment protects mice from various viral infections. a, b Survival analysis of C57BL/6 mice intraperitoneally injected with 25 mg/kg KYA1797K, followed by intravenous 1 × 107 pfu/g (a) HSV-1 or (b) VSV injection (n = 10). c, d qPCR analysis of DNA or RNA copy number in the brain or liver of C57BL/6 mice intraperitoneally injected with KYA1797K followed by intravenous 1 × 106 pfu/g (c) HSV-1 (n = 8) or (d) VSV (n = 5) injection for 48 h. e H&E analysis of the lung of C57BL/6 mice intraperitoneally injected with 25 mg/kg KYA1797K followed by intravenous 1 × 106 pfu/g HSV-1 or VSV injection for 48 h. Scale bar indicates 100 μm. f ELISA analysis of serum IFN-β and IFN-α4 of C57BL/6 mice intraperitoneally injected with 25 mg/kg KYA1797K followed by intravenous 1 × 106 pfu/g HSV-1 or VSV injection for 24 h (n = 5). g, h qPCR analysis of (g) HBV DNA copy number and (h) ELISA analysis of HBsAg in the serum of male C57BL/6 mice hydrodynamically injected with pAAV/HBV1.2 plasmid for 10 days followed by intraperitoneal KYA1797K injection (n = 10). Data are shown as mean ± standard deviation (S.D.) and represent two independent experiments. Statistical analyses were performed using (a, b) Log-rank (Mantel–Cox) test, (g, h) two-way ANOVA with Sidak’s multiple-comparison test, or (c, d, f) Student’s two-tailed unpaired t-test with Welch’s correction. *P < 0.05; **P < 0.01; ***P < 0.001; ****P < 0.0001; ns not significant. ELISA enzyme-linked immunosorbent assay, H&E hematoxylin and eosin, HBV hepatitis B virus, HSV-1 herpes simplex virus 1, IFN interferon, VSV vesicular stomatitis virus, KY KYA1797K
Fig. 7
Fig. 7
Increased AXIN1 expression correlates with increased IFN-β expression level and reduced HBV replication level. a AXIN1 expression level in AXIN1MUT (n = 28) and AXIN1WT (n = 330) human HCC samples from the TCGA LIHC dataset (https://portal.gdc.cancer.gov/). b GSEA of differentially expressed genes between AXIN1MUT and AXIN1WT groups. c qPCR analysis of serum HBV DNA in patients of AXIN1hi (n = 39) and AXIN1low (n = 39) groups. d The overall and progression-free survival analysis of patients in AXIN1hi and AXIN1low groups. e, f The correlation analysis of AXIN1 and (e) IFN-β, (f) ISG15 or IFIT2 mRNA levels in pericarcinoma tissues (n = 78). g Schematic representation of IFN-I signaling regulated by AXIN1/IRF3 axis. The scheme was provided by Coloring Guangzhou Ltd. Data are shown as mean ± standard deviation (S.D.) and represent two independent experiments. The statistical evaluations were conducted utilizing (a, c) Student’s two-tailed unpaired t-test, (d) Log-rank (Mantel-Cox) test, or (e, f) linear regression analysis. *P < 0.05; **P < 0.01; ***P < 0.001; ****P < 0.0001. AXIN1 axis inhibition protein 1, HCC hepatocellular carcinoma, IFN interferon, IRF3 interferon regulatory factor 3, ISG interferon-stimulated genes, GSEA gene set enrichment analysis, HBV hepatitis B virus

References

    1. Arzumanyan, A., Reis, H. M. & Feitelson, M. A. Pathogenic mechanisms in HBV- and HCV-associated hepatocellular carcinoma. Nat Rev Cancer13, 123–135, (2013). - PubMed
    1. Lu, R. et al. Genomic characterisation and epidemiology of 2019 novel coronavirus: implications for virus origins and receptor binding. Lancet395, 565–574 (2020). - PMC - PubMed
    1. Chen, Q., Sun, L. & Chen, Z. J. Regulation and function of the cGAS-STING pathway of cytosolic DNA sensing. Nat Immunol17, 1142–1149, (2016). - PubMed
    1. Zhang, X., Bai, X. C. & Chen, Z. J. Structures and mechanisms in the cGAS-STING innate immunity pathway. Immunity53, 43–53 (2020). - PubMed
    1. Shulman, Z. & Stern-Ginossar, N. The RNA modification N(6)-methyladenosine as a novel regulator of the immune system. Nat Immunol21, 501–512 (2020). - PubMed

Publication types

MeSH terms