. 2024 Oct 9;15(1):8741.
doi: 10.1038/s41467-024-52939-6.

Rare variant contribution to the heritability of coronary artery disease

Ghislain Rocheleau  1   2   3 Shoa L Clarke  4   5 Gaëlle Auguste  6 Natalie R Hasbani  7 Alanna C Morrison  7 Adam S Heath  7 Lawrence F Bielak  8 Kruthika R Iyer  5 Erica P Young  9   10 Nathan O Stitziel  9   10   11 Goo Jun  12 Cecelia Laurie  13 Jai G Broome  13 Alyna T Khan  13 Donna K Arnett  14 Lewis C Becker  15 Joshua C Bis  16 Eric Boerwinkle  7   17 Donald W Bowden  18 April P Carson  19 Patrick T Ellinor  20   21   22 Myriam Fornage  7 Nora Franceschini  23 Barry I Freedman  24 Nancy L Heard-Costa  25   26 Lifang Hou  27 Yii-Der Ida Chen  28 Eimear E Kenny  2   29   30 Charles Kooperberg  31 Brian G Kral  15 Ruth J F Loos  1   32 Sharon M Lutz  33 JoAnn E Manson  34 Lisa W Martin  35 Braxton D Mitchell  36 Rami Nassir  37 Nicholette D Palmer  18 Wendy S Post  38 Michael H Preuss  1 Bruce M Psaty  16   39   40 Laura M Raffield  41 Elizabeth A Regan  42 Stephen S Rich  6 Jennifer A Smith  8   43 Kent D Taylor  28 Lisa R Yanek  15 Kendra A Young  44 NHLBI Trans-Omics for Precision Medicine (TOPMed) ConsortiumAustin T Hilliard  45 Catherine Tcheandjieu  5   45   46   47 Patricia A Peyser  8 Ramachandran S Vasan  25   48   49 Jerome I Rotter  28 Clint L Miller  6   50   51 Themistocles L Assimes  5   45   52 Paul S de Vries  7 Ron Do  53   54   55
Collaborators, Affiliations

Rare variant contribution to the heritability of coronary artery disease

Ghislain Rocheleau et al. Nat Commun. .

Abstract

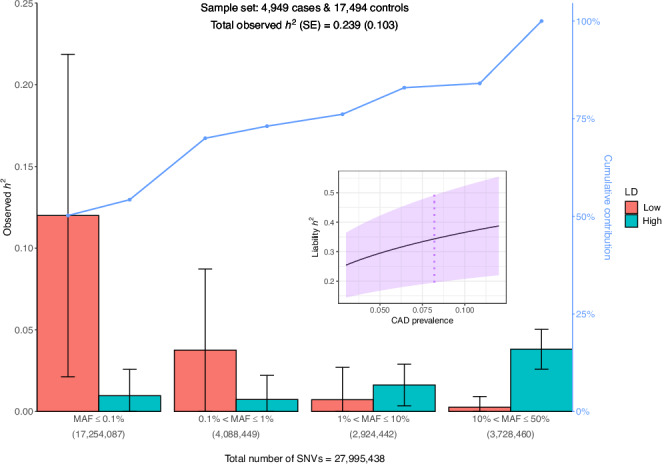
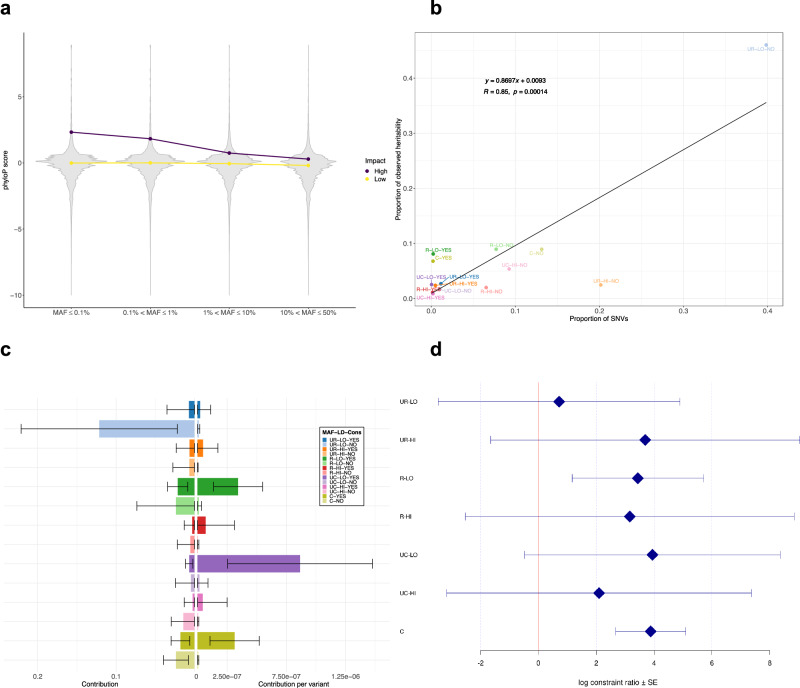
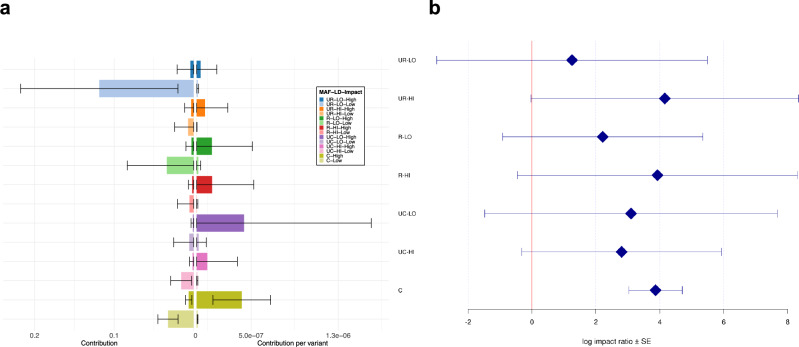
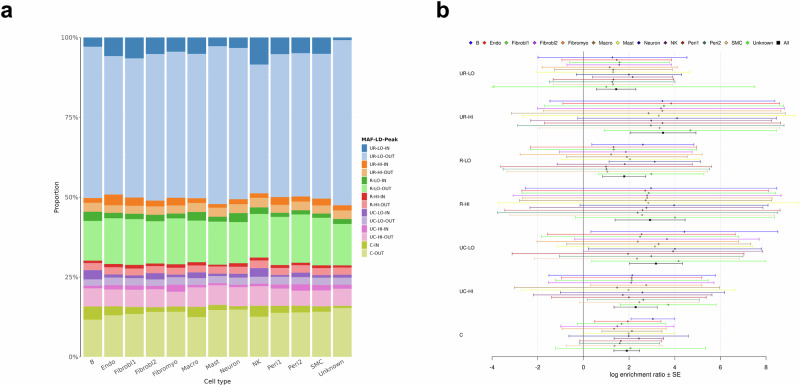
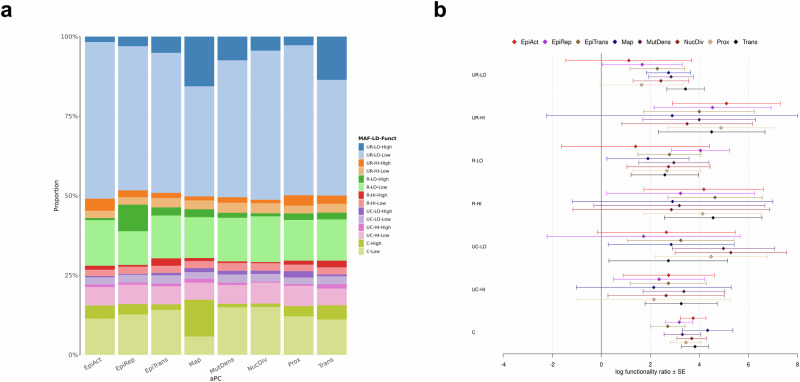
Whole genome sequences (WGS) enable discovery of rare variants which may contribute to missing heritability of coronary artery disease (CAD). To measure their contribution, we apply the GREML-LDMS-I approach to WGS of 4949 cases and 17,494 controls of European ancestry from the NHLBI TOPMed program. We estimate CAD heritability at 34.3% assuming a prevalence of 8.2%. Ultra-rare (minor allele frequency ≤ 0.1%) variants with low linkage disequilibrium (LD) score contribute ~50% of the heritability. We also investigate CAD heritability enrichment using a diverse set of functional annotations: i) constraint; ii) predicted protein-altering impact; iii) cis-regulatory elements from a cell-specific chromatin atlas of the human coronary; and iv) annotation principal components representing a wide range of functional processes. We observe marked enrichment of CAD heritability for most functional annotations. These results reveal the predominant role of ultra-rare variants in low LD on the heritability of CAD. Moreover, they highlight several functional processes including cell type-specific regulatory mechanisms as key drivers of CAD genetic risk.


Conflict of interest statement

P.T.E. receives sponsored research support from Bayer AG, IBM Research, Bristol Myers Squibb, Pfizer and Novo Nordisk; he has also served on advisory boards or consulted for Bayer AG, MyoKardia and Novartis. B.M.P. serves on the Steering Committee of the Yale Open Data Access Project funded by Johnson & Johnson. L.M.R. is a consultant for the TOPMed Administrative Coordinating Center (through Westat). C.L.M. received grant support from AstraZeneca for unrelated work. R.D. reported being a scientific co-founder, consultant and equity holder for Pensieve Health and being a consultant for Variant Bio, all not related to this work. All other authors declare no competing interests.

Figures

Fig. 1
Fig. 1. Contribution of each LD score-MAF bin to the observed heritability h2 of CAD in European ancestry.
Error bars represent ± one SE from each contribution point estimate. SEs are calculated by GCTA and are proportional to the effective number of independent variants in each bin and inversely proportional to the total sample size (4949 cases + 17,494 controls). The number of SNVs in each of the four MAF bins is indicated in parentheses. Low (High) category in the legend represents SNVs with LD scores below (above) the median, respectively. The broken line (in blue) displays the cumulative contribution (in %) of each LD score-MAF bin to the observed heritability estimate. Inset represents CAD heritability (estimate ± SE) on the liability scale for CAD prevalence ranging from 3% to 12% in the population (violet shaded area). The vertical dotted line (in violet) indicates the heritability estimate for a population prevalence of 8.2% in White/European ancestry. The GRMs are estimated by the ratio of averages (RoA) method and contributions to h2 are estimated with the REML EM algorithm. CAD, coronary artery disease; LD, linkage disequilibrium; MAF, minor allele frequency; SE, standard error; SNV, single nucleotide variant.
Fig. 2
Fig. 2. Distribution of phyloP scores and contribution of constrained SNVs to CAD heritability.
a Violin plots of phyloP scores against the four MAF bins stratified by SnpEff predicted impact (High: protein-altering variants, Low: non-protein-altering variants). Points indicate medians of phyloP scores in each MAF bin. For ease of presentation, SNVs with phyloP score < −10 are omitted. b Proportion of observed heritability in each LD score-MAF-Constrained bin against the proportion of SNVs in that bin (number of SNVs in the bin divided by the total number of SNVs). Each label in the plot represents a combination of: i) MAF (UR: ultra-rare (MAF ≤ 0.1%), R: rare (0.1% < MAF ≤ 1%), UC: uncommon (1% < MAF ≤ 10%), C: common (10% < MAF ≤ 50%)); ii) LD score (LO: low, HI: high); and iii) Constrained (YES or NO). The black line shows the regression line, whose equation is displayed in the upper left corner (n = 14). R designates the Pearson correlation coefficient, while p is the p-value associated with the two-sided test of null correlation. c Absolute (left) and relative (right) contribution per variant of each LD score-MAF-Constrained bin to the global CAD heritability estimate. The legend and color-coding is the same as in (b). Error bars represent ± one SE from each contribution point estimate. Absolute SEs (left) are calculated by GCTA and are proportional to the effective number of independent variants in each bin and inversely proportional to the total sample size (4949 cases + 17,494 controls). Relative SEs (right) are obtained by dividing the corresponding absolute SEs by the square root of the number of variants. d Log constraint ratio of constrained over non-constrained variants in each LD score-MAF bin. Each label on the y-axis is defined as in (b). Error bars represent ± one SE from each log constrain ratio estimate. SEs are calculated from GCTA’s output of the covariance matrix of contribution estimates to heritability in each bin and their corresponding number of SNVs (see Supplementary “Methods” for derivation details). CAD, coronary artery disease; Cons, constrained; LD, linkage disequilibrium; MAF, minor allele frequency; SE, standard error; SNV, single nucleotide variant.
Fig. 3
Fig. 3. Contribution of protein-altering and non-protein altering SNVs to the observed heritability of CAD.
a Absolute (left) and relative (right) contribution per variant of each LD score-MAF-Impact bin to the global CAD heritability estimate. Each label in the legend represents a combination of: i) MAF (UR: ultra-rare (MAF ≤ 0.1%), R: rare (0.1% <MAF ≤ 1%), UC: uncommon (1% <MAF ≤ 10%), C: common (10% < MAF ≤ 50%)); ii) LD score (LO: Low, HI: High); and iii) Impact (High: protein-altering variants, Low: non-protein-altering variants). Error bars show ± one SE from each contribution point estimate. Absolute SEs (left) are calculated by GCTA and are proportional to the effective number of independent variants in each bin and inversely proportional to the total sample size (4949 cases + 17,494 controls). Relative SEs (right) are obtained by dividing the corresponding absolute SEs by the square root of the number of variants. b Log impact ratio of protein-altering over non-protein-altering variants in each LD score-MAF bin. Each label on the y-axis is defined as in (a). Error bars represent ± one SE from each log impact ratio estimate. SEs are calculated from GCTA’s output of the covariance matrix of contribution estimates to heritability in each bin and their corresponding number of SNVs (see Supplementary “Methods” for derivation details). CAD, coronary artery disease; LD, linkage disequilibrium; MAF, minor allele frequency; SE, standard error; SNV, single nucleotide variant.
Fig. 4
Fig. 4. Contribution of SNVs inside and outside cell-specific snATAC-seq peaks to the observed heritability of CAD.
a Proportion of each LD score-MAF-Peak bin to the global CAD heritability estimate for each cell type. Each label in the legend represents a combination of: i) MAF (UR: ultra-rare (MAF ≤ 0.1%), R: rare (0.1% < MAF ≤ 1%), UC: uncommon (1% <MAF ≤ 10%), C: common (10% < MAF ≤ 50%)); ii) LD score (LO: low, HI: high); and iii) Peak (IN: inside, OUT: outside). b Log enrichment ratio of snATAC-seq peaks in each LD score-MAF bin for each cell type. Each label on the y-axis is defined as in (a). Black lines represent the average log enrichment ratio across all 13 cell types. Error bars show ± one SE from each log enrichment ratio estimate. SEs are calculated from GCTA’s output of the covariance matrix of contribution estimates to heritability in each bin and their corresponding number of SNVs (see Supplementary “Methods” for derivation details). CAD, coronary artery disease; LD, linkage disequilibrium; MAF, minor allele frequency; Endo, endothelial cells; Fibrobl, fibroblasts; Fibromyo, fibromyocytes; Macro, macrophages; NK, natural killer cells; Peri, Pericytes; SMC, smooth muscle cells; snATAC-seq, single-nucleus assays for transposase accessible chromatin with sequencing; SNV, single nucleotide variant.
Fig. 5
Fig. 5. Contribution of SNVs with high and low aPC functionality to the observed heritability of CAD.
a Proportion of each LD score-MAF-Functionality bin to the global CAD heritability estimate for eight aPCs (Phred = 20 for all, except aPC-Mutation-Density and aPC-Local-Nucleotide-Diversity for which Phred = 10). Each label in the legend represents a combination of: i) MAF (UR: ultra-rare (MAF ≤ 0.1%), R: rare (0.1% < MAF ≤ 1%), UC: uncommon (1% < MAF ≤ 10%), C: common (10% <MAF ≤ 50%)); ii) LD score (LO: low, HI: high); and iii) Functionality (Low, High). b Log functionality ratio of high over low functionality in each LD score-MAF bin for each aPC. Each label on the y-axis is defined as in (a). Error bars show ± one SE from each log functionality ratio estimate. SEs are calculated from GCTA’s output of the covariance matrix of contribution estimates to heritability in each bin and their corresponding number of SNVs (see Supplementary “Methods” for derivation). CAD, coronary artery disease; EpiAct, aPC-Epigenetics-Active; EpiRep, aPC-Epigenetics-Repressed; EpiTrans, aPC-Epigenetics-Transcription; Funct, functionality; LD, linkage disequilibrium; MAF, minor allele frequency; Map, aPC-Mappability; MutDens, aPC-Mutation-Density; NucDiv, aPC-Local-Nucleotide-Diversity; Prox, aPC-Proximity-To-TSS-TES; SNV, single nucleotide variant; Trans, aPC-Transcription-Factor.

References

    1. Tsao, C. W. et al. Heart disease and stroke statistics—2023 update: a report from the american heart association. Circulation147, e93–e621 (2023). - PubMed
    1. Roth, G. A. et al. Global burden of cardiovascular diseases and risk factors, 1990–2019. J. Am. Coll. Cardiol.76, 2982–3021 (2020). - PMC - PubMed
    1. Wienke, A., Holm, N. V., Skytthe, A. & Yashin, A. I. The heritability of mortality due to heart diseases: a correlated frailty model applied to danish twins. Twin Res.4, 266–274 (2001). - PubMed
    1. Zdravkovic, S. et al. Heritability of death from coronary heart disease: a 36-year follow-up of 20 966 Swedish twins. J. Intern. Med.252, 247–254 (2002). - PubMed
    1. Chen, Z. & Schunkert, H. Genetics of coronary artery disease in the post‐GWAS era. J. Intern. Med.290, 980–992 (2021). - PubMed

Publication types

Associated data

Grants and funding