. 2024 Oct 9;9(1):185.
doi: 10.1038/s41541-024-00972-3.

Vaccine responses and hybrid immunity in people living with HIV after SARS-CoV-2 breakthrough infections

Affiliations

Vaccine responses and hybrid immunity in people living with HIV after SARS-CoV-2 breakthrough infections

Amin Alirezaylavasani et al. NPJ Vaccines. .

Abstract

The COVID-19 pandemic posed a challenge for people living with HIV (PLWH), particularly immune non-responders (INR) with compromised CD4 T-cell reconstitution following antiretroviral therapy (CD4 count <350 cells per mm3). Their diminished vaccine responses raised concerns about their vulnerability to SARS-CoV-2 breakthrough infections (BTI). Our in-depth study here revealed chronic inflammation in PLWH and a limited anti-Spike IgG response after vaccination in INR. Nevertheless, the imprinting of Spike-specific B cells by vaccination significantly enhanced the humoral responses after BTI. Notably, the magnitude of cellular CD4 response in all PLWH was comparable to that in healthy donors (HD). However, the polyfunctionality and phenotype of Spike-specific CD8 T cells in INR differed from controls. The findings highlight the need for additional boosters with variant vaccines, and for monitoring ART adherence and the durability of both humoral and cellular anti-SARS-CoV-2 immunity in INR.


Conflict of interest statement

The authors declare no competing interests.

Figures

Fig. 1
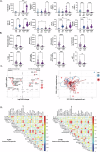
Fig. 1. Proteomic analysis of PLWH.
A Inflammatory profiles by Olink. Quantification of pro-inflammatory molecules in plasma from HD or PLWH after vaccination (n = 9 and n = 11, respectively), after VOC BTI (n = 20 and n = 10, respectively), or from hospitalized acute severe COVID-19 (n = 11), and sepsis patients (n = 16). NPX (normalized protein expression) values were scaled for each marker. The patient group and disease are indicated by the bar chart on the top. B Specific inflammatory signature of PLWH. Visualization by PCA of the inflammatory profile from vaccinated HD, PLWH, and BTI or unvaccinated severe COVID patients. The patient group is denoted by symbols beneath the graph, and their distribution is outlined by ellipses generated automatically. C Characteristics of the inflammatory signature in PLWH. Visualization by volcano plots of the significant inflammatory molecules detected in vaccinated HD and PLWH before and after BTI, determined by positive serology for anti-nucleocapsid IgG. Significance levels from the Mann–Whitney test are indicated: * for p < 0.05 and ** for p < 0.01. The number of proteins and false discovery rate are indicated for each pathway. See also Supplementary Fig. 1.
Fig. 2
Fig. 2. Inflammation after BTI in PLWH.
A Inflammatory molecules after BTI. Longitudinal quantification of pro-inflammatory molecules in plasma from vaccinated PLWH was assessed by Elisa for the indicated markers before (n = 41, 5 months post-dose 2) and after BTI (n = 16, 4–6 weeks post-BTI). PLWH and HDs were classified according to their history of vaccination and SARS-CoV-2 infection. As controls, we used unpaired vaccinated HDs (n = 19, 6 months post-dose 2) and a separate group post-BTI (n = 12, 3–4 weeks post-BTI). Mann–Whitney test and two-tailed p-values are indicated for HD and HD/PLWH comparisons with *, **, ***, and **** denoting p < 0.05, p < 0.01, p < 0.001, and p < 0.0001. B Immune cell subset distribution after BTI. The absolute count of immune cells was performed on freshly collected, paired blood samples from vaccinated PLWH (n = 40, 5 months post-dose 2) before and after BTI (n = 14, 4–6 weeks post-BTI). Mann–Whitney test and two-tailed p-values are indicated for PLWH comparisons with *, ***, and **** denoting p < 0.05, p < 0.001, and p < 0.0001. C Specific inflammatory signature of BTI in PLWH. Volcano plots visualize significant inflammatory molecules and immune cells detected before and after BTI, as determined by positive serology for anti-nucleocapsid IgG (left). Visualization by PCA of the immune profile from PLWH, segregated according to INR status, (right). D The correlogram described the significant correlation between the pro-inflammatory molecules and immune cells in vaccinated IR (n = 20) and INR (n = 20) PLWH. Pearson correlations with FDR are indicated with * for p < 0.05 and ** for p < 0.01. See also Supplementary Fig. 2.
Fig. 3
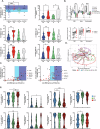
Fig. 3. Humoral response after BTI in PLWH.
A Quantification of anti-SARS-CoV-2 IgG antibodies after BTI in PLWH (n = 16, 4–6 weeks post-BTI). Scatter plots with medians are shown. Dotted lines demarcate ranges ( > 2000, 200–2000, 20–200 BAU/mL), to visualize patients with good, low, and non-seroconversion, respectively. The VOC-specific serology (IgG anti-nucleocapsid combined with anti-BA1 or -BA2) was detailed before and after BTI in PLWH stratified by immune status (INR vs. IR). Mann–Whitney test, two-tailed p-values < 0.05 (*), values < 0.01 (**), values < 0.001 (***), and <0.0001 (****). B Quantification of RBD, Spike, and Nucleocapsid-binding B cells in PLWH after vaccination and BTI. Left: Frequency of SARS-CoV-2 -binding B cells including Spike+ RBD+, Spike+ RBD- or Nucleocapsid after the vaccine in HD (n = 11, 5–6 months post-Dose 2) vs. PLWH (n = 41, 4–5 months post-Dose 2) or natural infection in convalescent COVID-19 (n = 18, 1-month post-infection) or BTI in HD (n = 14, 4–6 weeks post-BTI). Mann–Whitney test, two-tailed p-values < 0.05 (*), values < 0.01 (**), values < 0.001 (***), and <0.0001 (****). Right: Longitudinal frequency of SARS-CoV-2 -binding B cells including Spike+ RBD+, Spike+ RBD- or Nucleocapsid after BTI in PLWH (n = 16, 4–6 weeks post-BTI). Wilcoxon matched-pair signed rank test, with ** and *** denoting p < 0.01 and p < 0.001. C Peripheral detection of anti-RBD humoral immunity in PLWH. Correlation plots between the concentration of anti-RBD IgG (Log10 transformed BAU/mL) and the frequencies of SARS-CoV-2 RBD- or Spike-binding B cells in total B cells from peripheral blood of PLWH stratified by immune (CD4 count) and infection (BTI) status. Pearson correlations are indicated with * for p < 0.05 and ** for p < 0.01. D Anti-SARS-CoV-2 humoral signature of PLWH after vaccination (n = 41) and BTI (n = 16). Visualization by PCA of WT or VOC IgG anti-RBD serological concentration, anti-Spike, and anti-nucleocapsid. Ellipses were automatically generated to delineate PLWH based on Immune (INR vs. IR) and infection status (vaccination vs. BTI). E Phenotype of SARS-CoV-2 Spike-binding B cells in PLWH after vaccination (n = 41, 4–5 months post-Dose 2). Frequency of Spike- and RBD-binding B cells expressing CD21, CD24, CD27, CD38, CD71, IgD, IgG, or IgM after the second dose of the COVID-19 vaccine. Kruskal–Wallis test was used to compare the different groups with a p-value of * for p < 0.05. See also Supplementary Fig. 3.
Fig. 4
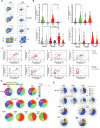
Fig. 4. Cellular response after BTI in PLWH.
A The functionality of SARS-CoV-2 Spike-specific T cells post-vaccination. Representative Dot plots of antigen-specific CD4 and CD8 T cells from vaccinated PLWH (n = 41, 4–5 months post-Dose 2). Antigen-specific T cells were identified by the expression of CD137+CD154+ for CD4 T cells and IFNγ/TNF for CD8 T cells following overnight stimulation with overlapping peptides coding for wild Type Spike (Wuhan) and HIV GAG (p24). Non-stimulated (NS) and Cytostim (CS) were used as negative and positive controls, respectively. B Functionality of SARS-CoV-2 Spike-specific T cells post-vaccination according to the immune status of PLWH, top. Frequency of Spike-specific T cells after the second dose of COVID-19 mRNA vaccine. PLWH were classified according to CD4 count at inclusion in the study. Antigen-specific T cells were gated as in A). The unspecific T-cell staining was removed as background from total Spike WT and HIV GAG response to display only virus-specific cellular response. Functionality of SARS-CoV-2-specific T cells after BTI, bottom. PLWH (red violin plots), COVID-19 convalescents (white violin plots), and vaccinated HDs (blue violin plots) were classified according to their history of SARS-CoV-2 infection and vaccination. Mann–Whitney two-tailed p-value with * for p < 0.05, ** for p < 0.01, *** for p < 0.001 and **** for p < 0.0001. C The breadth of SARS-CoV-2-specific T cells from PLWH BTI. Biplots represent the defined functionality of CD4 (top) and CD8 T cells (bottom) in response to Spike or MNO or GAG-derived peptides for each patient group (BTI PLWH, n = 16, 4–6 weeks post-BTI or COVID-19 convalescent, n = 18, 1-month post-infection). D Polyfunctionality of SARS-CoV-2-specific CD4 T cells in PLWH. SPICE analyses for in-depth functional profiling of SARS-CoV-2-specific CD4 T cells. Boolean gates were used to define the 8 possible combinations of IFNγ, TNF, and IL-2 on SARS-CoV-2-specific CD4 T cells identified by the upregulation of CD137 and CD154 after overnight stimulation with Spike- or non-Spike-derived peptides. SPICE pie charts represent the median frequency for each of the 8 possible functional profiles of SARS-CoV-2-specific CD4 T cells. The arcs indicate the proportion of cells that express IFNγ (red), TNF (green), and/or IL-2 (yellow-green). The antigen specificity and vaccination/infection status are indicated inside and above, respectively, for each pie chart. E Polyfunctionality of SARS-CoV-2-specific CD8 T cells in PLWH. SPICE analyses for in-depth functional profiling of SARS-CoV-2-specific CD8 T cells. Boolean gates were used to define the 32 possible combinations of IFNγ, TNF, Granzyme B, Perforin, and CD107a on SARS-CoV-2-specific CD8 T cells identified by the upregulation of IFNγ and/or TNF after overnight stimulation with Spike- or non-Spike-derived peptides. SPICE pie charts represent the median frequency for each of the 32 possible functional profiles of SARS-CoV-2-specific CD8 T cells. The arcs indicate the proportion of cells that express CD107a (green), Granzyme B (yellow), IFNγ (green), Perforin (blue), and/or TNF (purple). The antigen specificity and vaccination/infection status are indicated inside and above, respectively, for each pie chart. See also Supplementary Fig. 5.
Fig. 5
Fig. 5. Ex vivo cytotoxic T-cell response after BTI in PLWH.
A Detection of Spike-specific CD8 T cells after BTI in PLWH. MHC-Class I restricted multimers were used to identify ex vivo Spike-, CMV-, and EBV-specific CD8 T cells. Left flow plots: illustrative example of staining of CMV/EBV-specific CD8 T cells (x-axis) vs. Spike-specific CD8 T cells (y-axis) in PLWH before and 4-6 weeks after BTI. B Quantification of Spike-specific CD8 T cells in vaccinated PLWH. Top scatterplot: Frequency of virus-specific multimer CD8 T cells after Dose 2 of the mRNA vaccine in all PLWH (n = 41, 4–5 months post-Dose 2) or PLWH stratified according to CD4 count (Bottom scatterplot) (including up to three different HLA per donor among HLA*A0101, HLA*A0201, HLA*A2402, and HLA*B0702). C Quantification of Spike-specific CD8 T cells in PLWH after BTI (n = 16, 4–6 weeks post-BTI). Longitudinal frequencies of paired Spike-, CMV-, and EBV-specific multimer CD8 T cells are shown, red symbols: patients with anti-Nucleocapsid IgG-detected BTI, blue dots: Vaccinated only. Wilcoxon matched-pair signed rank test, with **, denoting p < 0.01. D Phenotype of virus-specific CD8 T cells in PLWH after BTI. Heat plot represents the frequency of markers expressed by virus-specific multimer CD8 T cells (CMV, EBV, FLU, Spike SARS-CoV-2) according to immune status (vaccination vs. BTI) in HD or PLWH depending on CD4 Count (IR vs. INR) and HLA-restriction. E Signature of Spike-specific CD8 T cells in PLWH after BTI. Principal component analysis of Spike-specific dextramers phenotypes identified by flow cytometry in PLWH after vaccination (n = 41) or BTI (n = 16). Ellipses were automatically generated to illustrate the distribution of each patient group. See also Supplementary Fig. 6.

References

    1. Abrams, E. M. & Szefler, S. J. COVID-19 and the impact of social determinants of health. Lancet Respir. Med.8, 659–661 (2020). - PMC - PubMed
    1. Cavanna, L., Citterio, C. & Toscani, I. COVID-19 vaccines in cancer patients. Seropositivity and safety. Systematic review and meta-analysis. Vaccines9, 10.3390/vaccines9091048 (2021). - PMC - PubMed
    1. Galmiche, S. et al. Immunological and clinical efficacy of COVID-19 vaccines in immunocompromised populations: a systematic review. Clin. Microbiol. Infect.28, 163–177 (2022). - PMC - PubMed
    1. Gao, Y., Chen, Y., Liu, M., Shi, S. & Tian, J. Impacts of immunosuppression and immunodeficiency on COVID-19: a systematic review and meta-analysis. J. Infect.81, e93–e95 (2020). - PMC - PubMed
    1. Gustafson, C. E., Kim, C., Weyand, C. M. & Goronzy, J. J. Influence of immune aging on vaccine responses. J. Allergy Clin. Immunol.145, 1309–1321 (2020). - PMC - PubMed

LinkOut - more resources