. 2024 Oct 9;14(1):23581.
doi: 10.1038/s41598-024-66936-8.

AutoGater: a weakly supervised neural network model to gate cells in flow cytometric analyses

Affiliations

AutoGater: a weakly supervised neural network model to gate cells in flow cytometric analyses

Mohammed Eslami et al. Sci Rep. .

Abstract

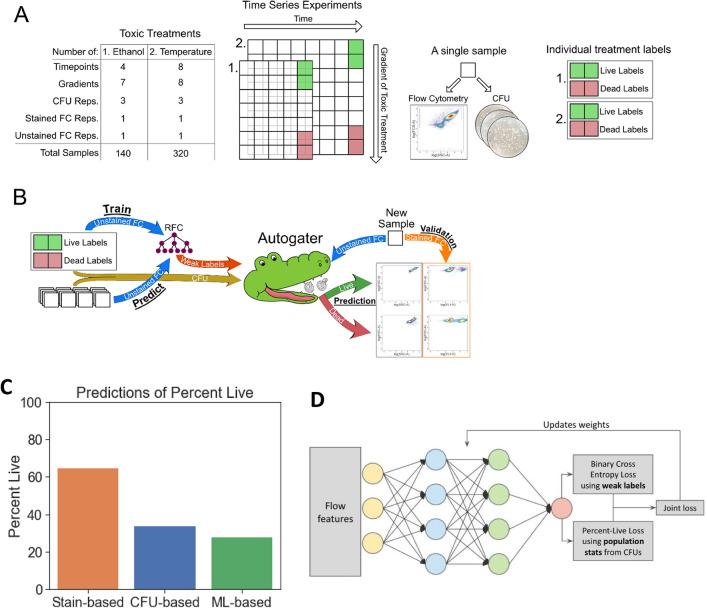
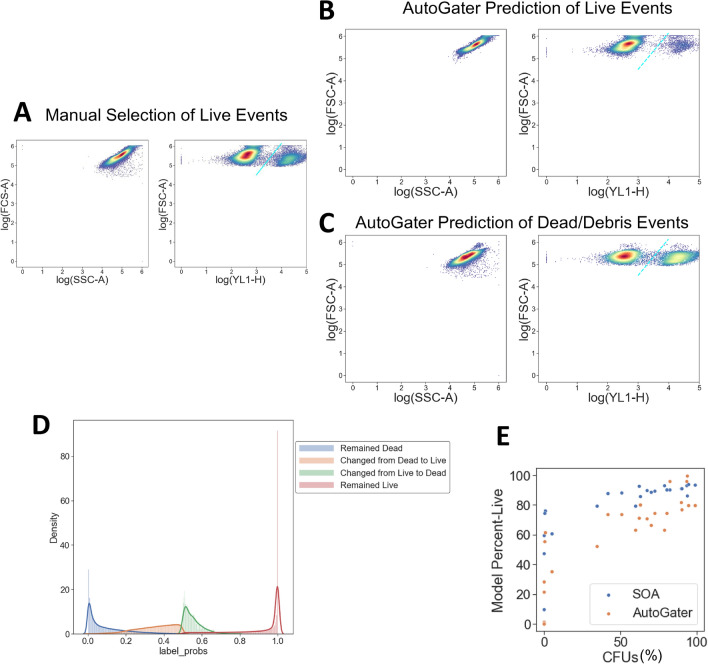
Flow cytometry is a useful and efficient method for the rapid characterization of a cell population based on the optical and fluorescence properties of individual cells. Ideally, the cell population would consist of only healthy viable cells as dead cells can confound the analysis. Thus, separating out healthy cells from dying and dead cells, and any potential debris, is an important first step in analysis of flow cytometry data. While gating of debris can be conducted using measured optical properties, identifying dead and dying cells often requires utilizing fluorescent stains (e.g. Sytox, a nucleic acid stain that stains cells with compromised cell membranes) to identify cells that should be excluded from downstream analyses. These stains prolong the experimental preparation process and use a flow cytometer's fluorescence channels that could otherwise be used to measure additional fluorescent markers within the cells (e.g. reporter proteins). Here we outline a stain-free method for identifying viable cells for downstream processing by gating cells that are dying or dead. AutoGater is a weakly supervised deep learning model that can separate healthy populations from unhealthy and dead populations using only light-scatter channels. In addition, AutoGater harmonizes different measurements of dead cells such as Sytox and CFUs.


Conflict of interest statement

The authors declare no competing interests.

Figures

Figure 1
Figure 1
Overview of the AutoGater methodology and its benefits. Manual Gating figures are from.
Figure 2
Figure 2
AutoGater labeling and training framework. (A) Gradients of two modes of killing (heat and ethanol) were used to generate data for training. Four conditions were used for training and all remaining were used for test. (B) AutoGater’s two stage framework first predicts the set of held out conditions based on the weak labels using a random forest classifier (RFC), and then adjusts those predictions based on the CFU data at that condition using a neural network. (C) The three different methods provide three very different assessments of percentages of live cells for the same sample. Methods are needed to harmonize across these different assessments. (D) Architecture of a neural network that takes non-color channels from a flow cytometer as input (FSC, SSC) and is trained to jointly optimize cell-based and population based notions of death.
Figure 3
Figure 3
Characterization of model with Sytox data across all ethanol conditions. (A) Manual gating using Sytox channel of ethanol killed yeast cells to be used as a comparison for AutoGater. (B) Testing the model on a sample it was not trained on shows AutoGater is able to reconstruct the population of healthy, viable cells versus events that should be gated. The majority of the predicted live cells fall to the left of the gating line. Note: While showing the color channel, this channel was not provided as input to the model for its prediction. (C) Testing the model on a sample it was not trained on shows AutoGater is able to reconstruct the population of dead cells versus events that should be gated. The population of dead cells to the right of the line is much larger than those of the live cells. The majority of cells however still fall to the left of the line, which means that AutoGater is more conservative in what it calls live from the stain based method. Note: While showing the color channel, this channel was not provided as input to the model for its prediction. (D) Events that the model selected to update from live to dead and vice versa when incorporating the CFU measurements were ones that a model that did not use CFU information was least confident about (those with p ~ 0.5). (E) Using CFU as the ground-truth (x-axis), we compared the stain-based method and AutoGater predictions to the CFUs and see that without using stains, AutoGater is more restrictive than stain-based methods to classify a cell as a live-cell. AutoGater’s predictions align better with CFUs at the lower and medium values of CFUs, but its restrictive nature gates out more events than needed at higher-CFUs.
Figure 4
Figure 4
Comparison of various methods (colors and style) to measure dead over time (x/y axes) and ethanol concentrations (A-G). CFU derivations are population based measures of death, Sytox stained are cell based proxy measurements of death, and AutoGater are predictions from the neural network that use a weakly supervised approach to refine condition labels of death with those of CFUs. In this case, the live label was the final time point at 0.0% ethanol, while the death was the final time point at (20% and 80%) ethanol. AutoGater is able to learn a method to tag dead cells that combines the cell based measurements and population based measurements. This is best observed in panel (F).
Figure 5
Figure 5
Comparison of various methods (colors and style) to measure dead over time (x/y axes) and temperature (A-H). CFU derivations are population based measures of death, Sytox stained are cell based proxy measurements of death, and AutoGater are predictions from the neural network that use a weakly supervised approach to refine condition labels of death with those of CFUs. In this case, the live label was the final time point at 25° 30°, 35 °C, while the death label was the final time point at 55° and 65 °C. AutoGater is able to learn a method to tag dead cells that combines the cell based measurements and population based measurements. This is best observed in panel (F).

References

    1. Herzenberg, L. A. et al. The history and future of the fluorescence activated cell sorter and flow cytometry: a view from Stanford. Clin. Chem.48, 1819–1827 (2002). - PubMed
    1. FlowJo | FlowJo, LLC. https://www.flowjo.com/solutions/flowjo.
    1. Sarkar, D., Le Meur, N. & Gentleman, R. Using flowViz to visualize flow cytometry data. Bioinformatics24, 878–879 (2008). - PMC - PubMed
    1. Hahne, F. et al. flowCore: A bioconductor package for high throughput flow cytometry. BMC Bioinform10, 106 (2009). - PMC - PubMed
    1. Johnsson, K., Wallin, J. & Fontes, M. BayesFlow: Latent modeling of flow cytometry cell populations. BMC Bioinform.17, 25 (2016). - PMC - PubMed

Substances

LinkOut - more resources