. 2024 Oct 9;15(1):8754.
doi: 10.1038/s41467-024-53068-w.

Tankyrase inhibition promotes endocrine commitment of hPSC-derived pancreatic progenitors

Affiliations

Tankyrase inhibition promotes endocrine commitment of hPSC-derived pancreatic progenitors

Frankie Poon et al. Nat Commun. .

Abstract

Human pluripotent stem cells (hPSCs) have the potential to differentiate into various cell types, including pancreatic insulin-producing β cells, which are crucial for developing therapies for diabetes. However, current methods for directing hPSC differentiation towards pancreatic β-like cells are often inefficient and produce cells that do not fully resemble the native counterparts. Here, we report that highly selective tankyrase inhibitors, such as WIKI4, significantly enhances pancreatic differentiation from hPSCs. Our results show that WIKI4 promotes the formation of pancreatic progenitors that give rise to islet-like cells with improved β-like cell frequencies and glucose responsiveness compared to our standard cultures. These findings not only advance our understanding of pancreatic development, but also provide a promising new tool for generating pancreatic cells for research and potential therapeutic applications.


Conflict of interest statement

The authors declare the following competing interests: M.C.N., F.P., R.K., and F.S. have a patent application related to the use of tankyrase inhibitors for generating insulin-producing cells (US Patent App. US17/057,130). M.C.N. and F.S. have a patent licensed to Sernova Inc. (WO2013163739A1). M.C.N. has a sponsored research agreement with Universal Cells Inc. The authors declare no other competing interests.

Figures
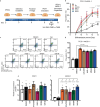
Fig. 1
Fig. 1. TNKS inhibitors promote pancreatic lineage commitment.
a Schematic representation of the four stages of differentiation from human Pluripotent Stem Cells (hPSCs) to PDX1+/NKX6-1+ pancreatic progenitors (PPs). Nicotinamide (NA) was substituted at stage 4 by either Histone Deacetylase (HDAC), Poly-ADP Ribose Polymerase (PARP) or Tankyrase (TNKS) inhibitors. Created with BioRender.com released under a Creative Commons Attribution-NonCommercial-NoDerivs 4.0 International license (https://creativecommons.org/licenses/by-nc-nd/4.0/deed.en). b Percentage of PDX1+/NKX6-1+ cells measured by flow cytometry between day 8 and day 13 of differentiation after treatment with Noggin and EGF alone (-) or in combination with NA or the TNKSi XAV939, IWR-1, MN64 or WIKI4 (n = 3 independent biological replicates. P-values are <0.0001 for NA, XAV939, IWR-1, MN64, WIKI4 when comparing day 12/13 to day 8. For control, P-value is 0.002 at day 12, and <0.0001 at day 13 when compared to day 8. Two-way ANOVA with Tukey’s multiple-comparison test between day 8 and day 12/13 of each condition. Error bar represents ± SEM). c, d Representative flow cytometry plots of NKX6-1 and PDX1 expression at day 13 and quantification of PDX1+/NKX6-1+ cells (n = 5 independent biological replicates, One-way ANOVA with Dunnett’s multiple-comparison test. All significant conditions produced P-values < 0.0001. Error bars represent ± SEM.). e, f Gene expression analysis of PDX1 and NKX6-1 on day 13. Data normalized to the human housekeeping gene TBP (hTBP) (n = 3 independent biological replicates. Exact P-values are reported in the figure. One-way ANOVA with Dunnett’s multiple-comparison test. Error bars represent ± SEM).
Fig. 2
Fig. 2. Highly selective TNKS inhibitors promote β-like cell commitment.
a Schematic representation of the six stages of differentiation from hPSCs to C-Peptide (C-PEP)+/NKX6-1+ β-like cells. NA was substituted at stage 4 by either DMSO or different small molecules targeting either the nicotinamide (XAV939) or the Adenosine subsite (JW74, WIKI4, JW55, G007-LK) of TNKS. Created with BioRender.com released under a Creative Commons Attribution-NonCommercial-NoDerivs 4.0 International license (https://creativecommons.org/licenses/by-nc-nd/4.0/deed.en). b, c Representative flow cytometry plots and quantification of the percentage of C-PEP+/NKX6-1+ β-like cells at stage 6 obtained after the different treatment groups at stage 4 (n = 5 for DMSO, n = 3 for XAV939 and JW74, n = 8 for NA, n = 6 for WIKI4 and JW55, n = 7 for G007-LK. All replicates represent independent biological replicates. Exact P-values are reported in the figure. One-way ANOVA with Dunnett’s multiple-comparison test. Error bars represent ± SEM.).
Fig. 3
Fig. 3. WIKI4 treatment reduces cellular proliferation and activates integrin-actin signaling.
a Global distribution of genes by log-transformed False Discovery Rate (FDR) and log-transformed fold change in expression between NA- and WIKI4-derived stage 4 cells. b Heatmap of scaled and log-transformed expression data for genes differentially expressed between NA- and WIKI4-derived stage 4 populations. Two clusters were identified—genes upregulated by NA (cluster 1), and genes upregulated by WIKI4 (cluster 2). (c Gene expression analysis of proliferation markers (MKI67, TOP2A) and cell cycle regulators (CDKN1A, CDKN2B) by RT-qPCR on day 13. Data normalized to housekeeping gene hTBP (n = 4 independent biological replicates. Exact P-values are reported in the figure. Two-tailed paired student’s t-test. Error bars represent SEM). d Cell count of NA- and WIKI4-derived stage 4 populations (n = 6 independent biological replicates. The exact P-value is reported in the figure. Two-tailed paired student’s t-test. Error bars represent SEM). e, f Representative flow cytometry plots and quantification of NKX6-1/Ki67 expression profile (n = 4 independent biological replicates. Exact P-values are reported in the figure. Two-tailed paired student’s t-test. Error bars represent SEM). g Gene set enrichment analysis (GSEA) of gene sets associated with the integrin signaling pathway, comparing NA- and WIKI4-derived stage 4 populations (Data analyzed by Kolmogorov–Smirnov test. No correction was performed). h Gene expression analysis of integrin subunits (ITGB1, ITGA3, ITGA5, ITGAV) by RT-qPCR in NA- and WIKI4-derived cells at stage 4. Data normalized to housekeeping gene hTBP (n = 5 independent biological replicates. Exact P-values are reported in the figure. Two-tailed paired student’s t-test. Error bars are SEM). i Immunofluorescence staining of NA- and WIKI4-derived cells at stage 4 with ITGB1 (red) and ACTA2 (green). DAPI (gray) represents nuclei. The scale bar represents 125 µm.
Fig. 4
Fig. 4. WIKI4-derived PPs give rise to glucose-responsive islet-like populations containing increased β-like cells compared to NA-derived PPs.
a Schematic representation of pancreatic differentiation highlighting reaggregation at day 20 and extended culture to day 33. PDX1+ cells were treated with either NA or WIKI4 at stage 4. On day 20, cells were dissociated into single cells and allowed to reaggregate in stage 6 media. On day 23, cells were transferred to a growth factor-free media until day 33. Created with BioRender.com released under a Creative Commons Attribution-NonCommercial-NoDerivs 4.0 International license (https://creativecommons.org/licenses/by-nc-nd/4.0/deed.en). b Immunofluorescence staining of NA- and WIKI4-derived cells in day 23 non-reaggregated, day 23 reaggregated, and day 33 reaggregated conditions. Sections were stained for β cell markers (NKX6-1/PDX1/C-PEP) and pancreatic hormones (GCG/INS/SST). DAPI represents nuclei. Scale bar represents 50 µm. The white box represents 500% digital magnification of specific areas. c Representative flow cytometry plots of C-PEP/NKX6-1 profile of non-reaggregated (day 23), reaggregated (day 23), and extended culture aggregates (day 33). df Quantification of C-PEP+/NKX6-1+ and C-PEP-/NKX6-1- populations from NA- or WIKI4-treated reaggregated and extended cultures, respectively (n = 4 for d, n = 5 for f, all replicates are independent biological replicates. Exact P-values are reported in the figure. Two-way ANOVA with Tukey’s multiple-comparison test. Error bar represents SEM). g Relative C-PEP Median Fluorescence Intensity (MFI) of NA- and WIKI4-treated β-like cells after extended culture (n = 5 independent biological replicates. Exact P-values are reported in the figure. Two-way ANOVA with Tukey’s multiple-comparison test. Error bar represents SEM). h Static Glucose Stimulated Insulin Secretion assay was performed to calculate the stimulation index after extended culture of NA- and WIKI4-derived aggregates (n = 5 independent biological replicates. Exact P-values are reported in the figure. One-way ANOVA with Dunnett’s multiple-comparison test. Error bar represents SEM).
Fig. 5
Fig. 5. Kidney capsule transplantation of WIKI4-derived β-like cells normalizes glycemia in STZ-treated diabetic mice.
a Schematic of cell preparation and transplantation. Created with BioRender.com released under a Creative Commons Attribution-NonCommercial-NoDerivs 4.0 International license (https://creativecommons.org/licenses/by-nc-nd/4.0/deed.en). b Weekly fasting blood glucose measurements (n = 8 for NA, from 7 independent differentiation cohorts; n = 9 for WIKI4, from 7 independent differentiation cohorts; n = 5 for non-diabetic control; n = 3 for STZ control. P-values listed: *STZ vs. non-diabetic—0.0077, 0.024 at week 13, 14; #NA vs. non-diabetic—0.0004, 0.0057 at week 15, 16; NA vs WIKI4 – 0.0022, 0.0401 at week 15, 16. Two-way ANOVA with Tukey’s multiple-comparison test. Error bars represent SEM). c The percentage of NA- and WIKI4-transplanted mice that achieved euglycemia post-transplantation. Data was analyzed using chi-square test at every timepoint. d H&E staining of transplanted kidney grafts. The black box represents an area of magnification. Scale bar represents 500 µm. e Immunofluorescence staining of β-cell markers (C-PEP/NKX6-1/PDX1). White box areas were subjected to 500% digital magnification. Scale bar represents 100 µm. f IPGTT performed at 15 weeks post-transplantation (n = 4 for NA; n = 5 for WIKI4; n = 4 for non-diabetic control; n = 5 for STZ control. All data points represent independent biological replicates. Exact P-values are reported in the figure. Two-way ANOVA with Tukey’s multiple-comparison test. Error bars represent SEM). g Glucose stimulated C-PEP secretion assay at 15 weeks post-transplantation (n = 4 for NA; n = 6 for WIKI4. All data points represent independent biological replicates. Exact P-values are reported in the figure. One-tailed student’s t-test. Error bars represent SEM).

Similar articles

Cited by

References

    1. Xie, Z., Chang, C. & Zhou, Z. Molecular mechanisms in autoimmune type 1 diabetes: a critical review. Clin. Rev. Allergy Immunol.47, 174–192 (2014). - PubMed
    1. Cogger, K. & Nostro, M. C. Recent advances in cell replacement therapies for the treatment of type 1 diabetes. Endocrinology156, 8–15 (2015). - PubMed
    1. Katsarou, A. et al. Type 1 diabetes mellitus. Nat. Rev. Dis. Prim.3, 1–18 (2017). - PubMed
    1. Emamaullee, J. A., Pepper, A. & Shapiro, A. M. J. Islet cell transplantation. Princ. Regen. Med. 987–1007. 10.1016/B978-0-12-809880-6.00056-4 (2019).
    1. Migliorini, A., Nostro, M. C. & Sneddon, J. B. Human pluripotent stem cell-derived insulin-producing cells: A regenerative medicine perspective. Cell Metab.33, 721–731 (2021). - PMC - PubMed

Publication types

MeSH terms

Associated data