. 2024 Oct 9;15(1):8748.
doi: 10.1038/s41467-024-53086-8.

β-synuclein regulates the phase transitions and amyloid conversion of α-synuclein

Affiliations

β-synuclein regulates the phase transitions and amyloid conversion of α-synuclein

Xi Li et al. Nat Commun. .

Abstract

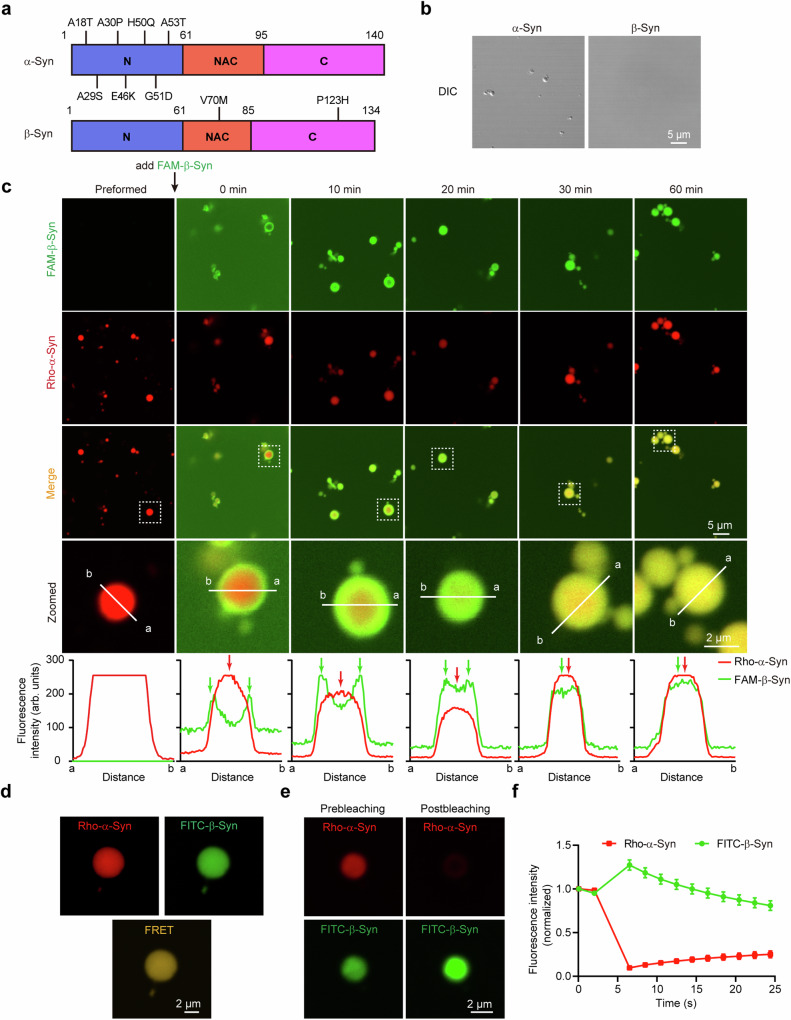
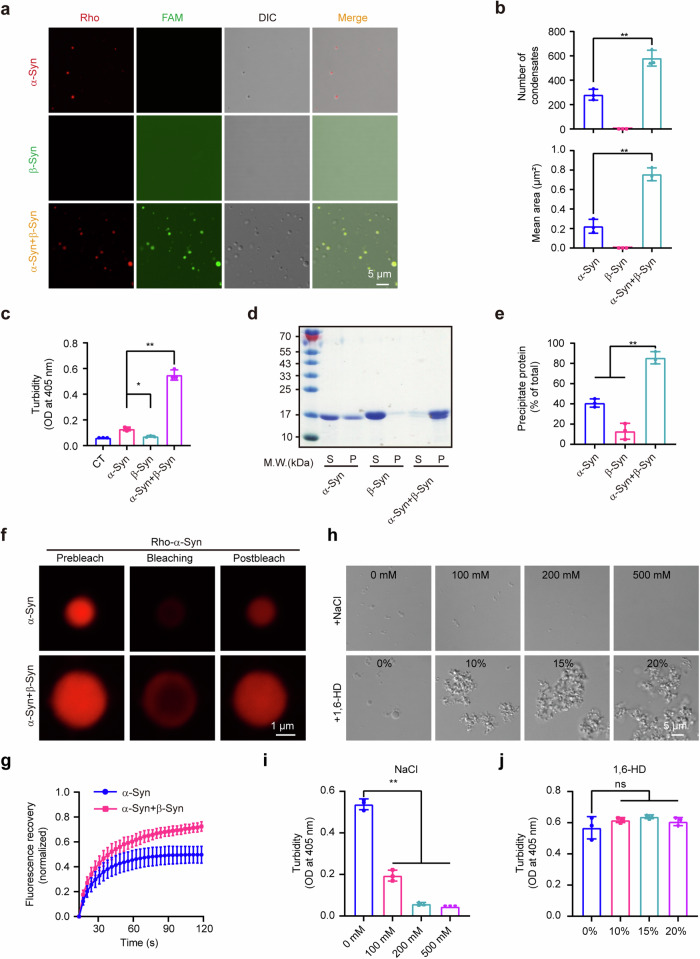
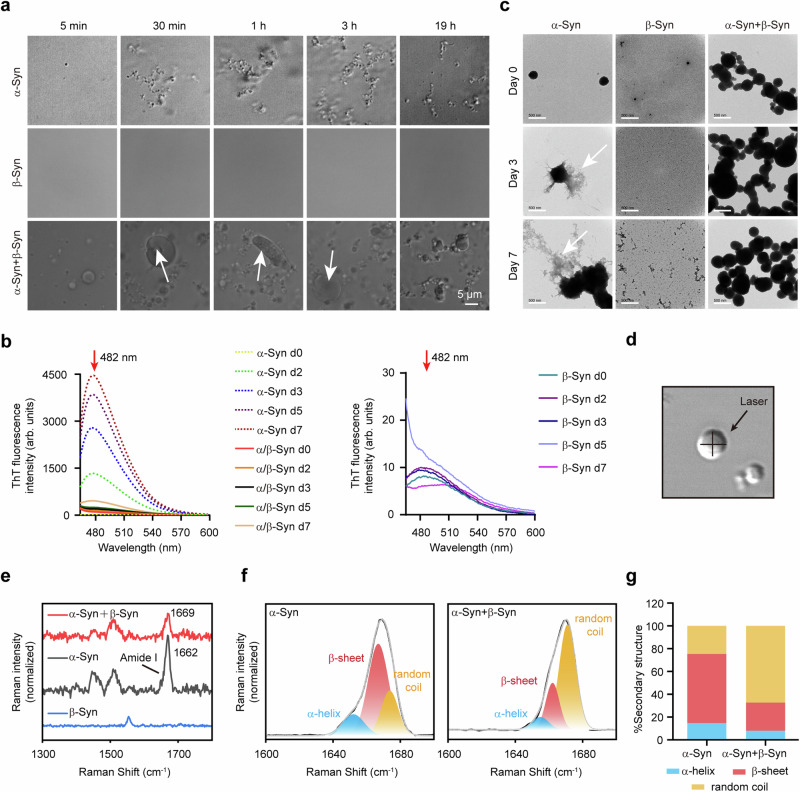
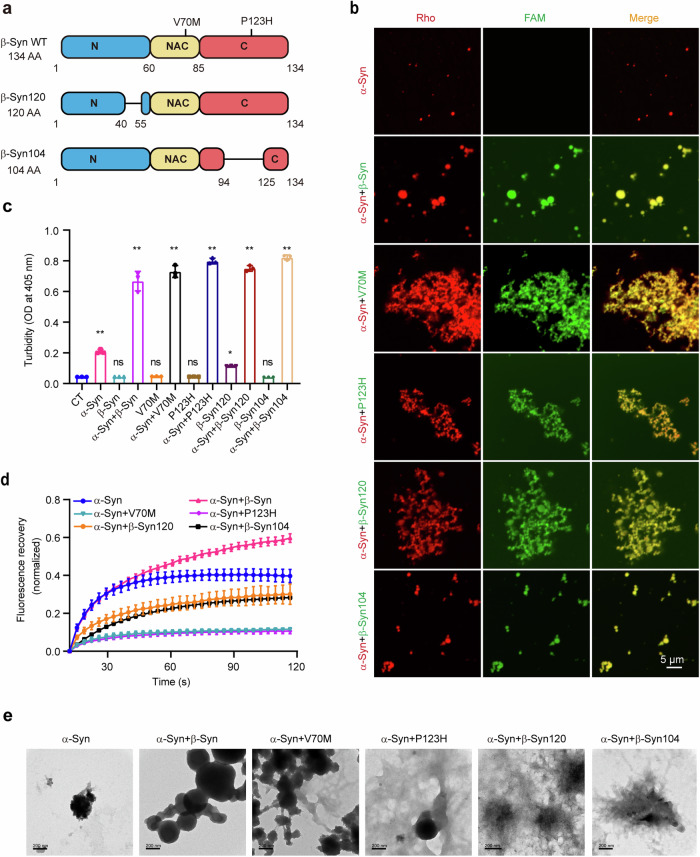
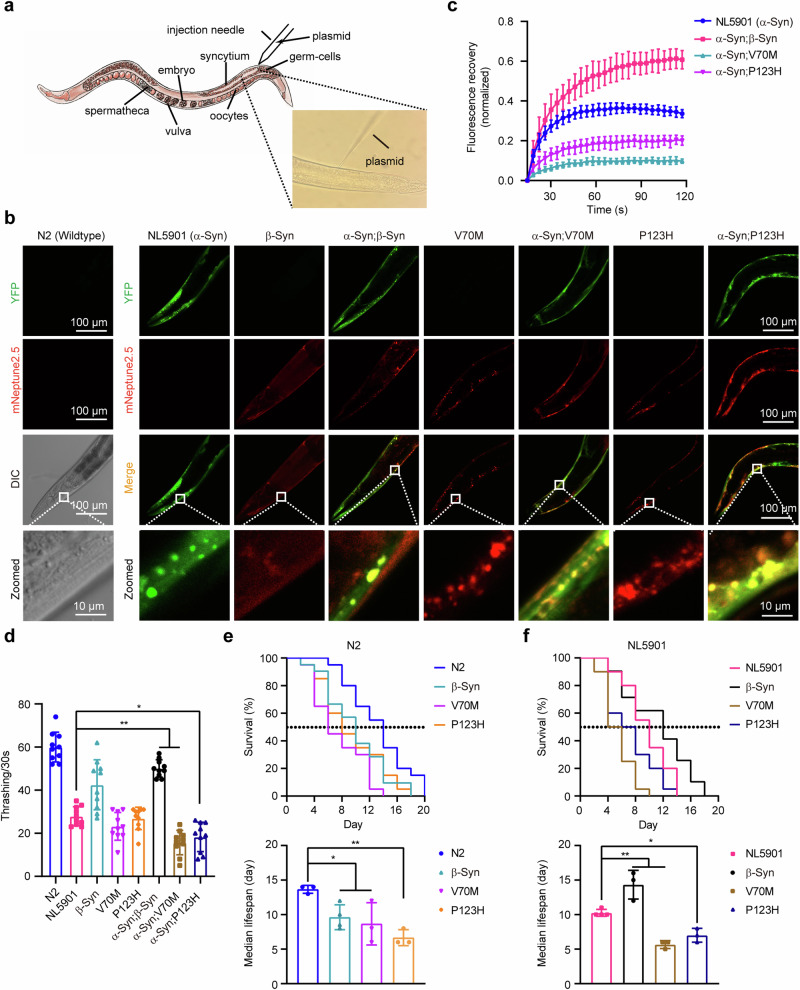
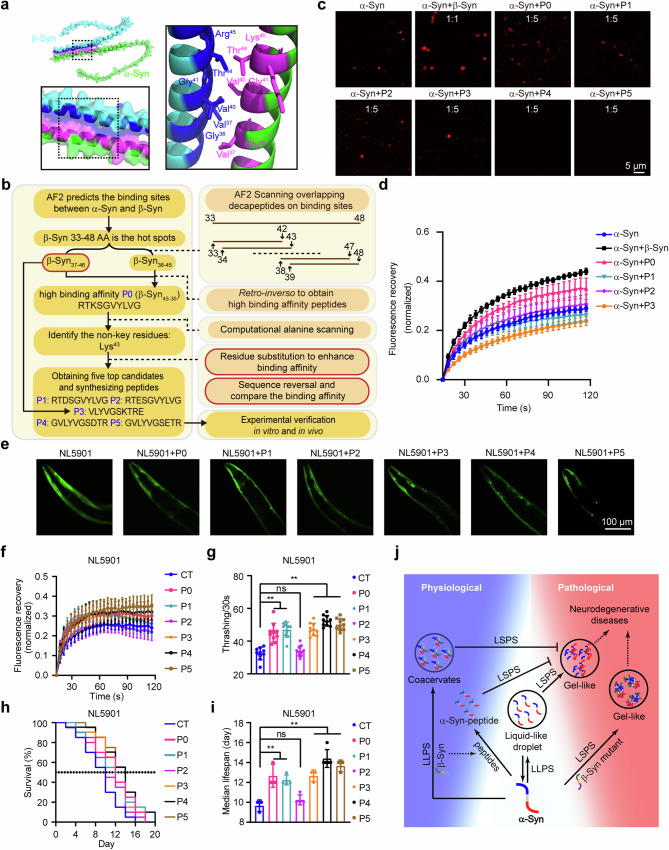
Parkinson's disease (PD) and Dementia with Lewy Bodies (DLB) are neurodegenerative disorders characterized by the accumulation of α-synuclein aggregates. α-synuclein forms droplets via liquid-liquid phase separation (LLPS), followed by liquid-solid phase separation (LSPS) to form amyloids, how this process is physiologically-regulated remains unclear. β-synuclein colocalizes with α-synuclein in presynaptic terminals. Here, we report that β-synuclein partitions into α-synuclein condensates promotes the LLPS, and slows down LSPS of α-synuclein, while disease-associated β-synuclein mutations lose these capacities. Exogenous β-synuclein improves the movement defects and prolongs the lifespan of an α-synuclein-expressing NL5901 Caenorhabditis elegans strain, while disease-associated β-synuclein mutants aggravate the symptoms. Decapeptides targeted at the α-/β-synuclein interaction sites are rationally designed, which suppress the LSPS of α-synuclein, rescue the movement defects, and prolong the lifespan of C. elegans NL5901. Together, we unveil a Yin-Yang balance between α- and β-synuclein underlying the normal and disease states of PD and DLB with therapeutical potentials.


Conflict of interest statement

The authors declare no competing interests.

Figures

Fig. 1
Fig. 1. β-Syn partitions into α-Syn droplet condensates and co-localizes with α-Syn.
a Schematic diagram of wildtype α-Syn (Top) and β-Syn (Bottom), as well as their disease associated mutations used in this study. b Representative confocal images of α-Syn (100 μM, Left) and β-Syn (100 μM, Right). Scale bar, 5 μm. c β-Syn partitions into α-Syn condensates. FAM-β-Syn (30 μM) monomer was added into preformed α-Syn (150 μM, 10% Rho-α-Syn) condensates, then imaged immediately (0 min) or following incubation at room temperature for 10–60 min. Fluorescence intensity for β-Syn (Green), α-Syn (Red) of the indicated white line (a-b) is shown to the bottom of each merge image. Scale bars, 5 μm for full images and 2 μm for zoom-ins, arbitrary units (arb. units). d Representative confocal images for a single droplet that contains FITC-β-Syn (donor) and Rho-α-Syn (acceptor) as the FRET fluorescence pairs. The FRET channel shows the image excited at 488 nm with emission at 590 nm. Scale bar, 2 μm. e Representative confocal images of FITC-β-Syn (donor) and Rho-α-Syn (acceptor) before (Left) and after (Right) acceptor photobleaching. Scale bar, 2 μm. f The changes of fluorescence intensity of both FITC and Rhodamine B before and after acceptor photobleaching. n = 6 condensates per group. Data are presented as mean ± SD. α-Syn labeled with Rhodamine B (Rho) exhibits red fluorescence, β-Syn labeled with FITC or 5(6)-FAM (FAM) exhibits green fluorescence, and the merged channel shows an orange color. All the experiments were carried out in the presence of 20% PEG. bf At least three independent experiments were performed with similar results. Source data are provided as a Source Data file.
Fig. 2
Fig. 2. β-Syn promotes the liquid-liquid phase separation of α-Syn through electrostatic interactions.
a Representative confocal images of α-Syn (100 μM, 10% Rho-α-Syn) alone, β-Syn (100 μM, 10% FAM-β-Syn) alone, and colocalized α-Syn (100 μM, 10% Rho-α-Syn) and β-Syn (100 μM, 10% FAM-β-Syn) in α-Syn/β-Syn condensates. Scale bar, 5 μm. α-Syn labeled with Rhodamine B (Rho) exhibits red fluorescence, β-Syn labeled with 5(6)-FAM (FAM) exhibits green fluorescence, and the merged channel shows an orange color. b Quantify the number and mean area of the condensates within the field of view using a ×100 oil immersion objective, n = 3 independent biological samples. **PNumber of condensates (α-Syn vs α-Syn + β-Syn) = 0.0004; **PMean area (α-Syn vs α-Syn + β-Syn) < 0.0001. c The turbidity at 405 nm for the indicated group, CT is shown as 20% PEG alone, n = 3 independent biological samples. *PTurbidity (α-Syn vs β-Syn) = 0.0278, **PTurbidity (α-Syn vs α-Syn + β-Syn) < 0.0001. d Sedimentation-based assay indicated the protein distributions of supernatant (S) and precipitate (P) in the different groups. n = 3 independent experiments. e The percentage of proteins in the precipitate of sedimentation-based assay. n = 3 independent experiments. **PSedimentation (α-Syn + β-Syn vs α-Syn) = 0.0002, **PSedimentation (α-Syn + β-Syn vs β-Syn) < 0.0001. f, g Representative FRAP images (f) and normalized FRAP recovery curves (g) of α-Syn with or without β-Syn, n = 6 condensates per group. Scale bar, 1 μm. α-Syn labeled with Rhodamine B (Rho) exhibits red fluorescence. h Representative differential interference contrast (DIC) images of α-Syn/β-Syn condensates after adding indicated concentrations of NaCl (Top) or 1,6-HD (Bottom). Scale bar, 5 μm, n = 3 independent biological samples. i, j The turbidity at 405 nm for α-Syn/β-Syn condensates after adding indicated concentrations of NaCl and 1,6-HD. n = 3 independent biological samples. **PTurbidity (0 mM NaCl vs 100 mM NaCl) < 0.0001, **PTurbidity (0 mM NaCl vs 200 mM NaCl) < 0.0001, **PTurbidity (0 mM NaCl vs 500 mM NaCl) < 0.0001. All experiments were carried out with α-Syn (100 μM), β-Syn (100 μM), and α-Syn (100 μM) + β-Syn (100 μM) in the presence of 20% PEG. Data are presented as mean ± SD, one-way ANOVA was used for multiple experimental groups without adjustment. *P < 0.05; **P < 0.01; ns, no significance. aj At least three independent experiments were performed with similar results. Source data are provided as a Source Data file.
Fig. 3
Fig. 3. β-Syn delays the liquid to solid phase separation of α-Syn.
a The coalescence and wetting properties of α-Syn, β-Syn, and α-Syn/β-Syn condensates under DIC microscopy at indicated incubation times. The white arrows show images of protein rafts. Scale bar, 5 μm. b Time-dependent ThT fluorescence spectra of α-Syn and α-Syn/β-Syn condensates (Left) and β-Syn (Right) at indicated incubation times, arbitrary units (arb. units). c TEM images of the fibrillar formation of α-Syn, β-Syn, and α-Syn/β-Syn condensates after incubation at 37 °C for different incubation times. Scale bar, 500 nm. d Schematic of Raman Spectroscopy measurement on single droplet. e Raman spectra of α-Syn, β-Syn, and α/β-Syn condensates. f Characteristics peaks and (g) Peak proportions in the amide I region for α-Syn and α/β-Syn condensates. Experiments were carried out with α-Syn (100 μM), β-Syn (100 μM), and α-Syn (100 μM) + β-Syn (100 μM) in the presence of 20% PEG. ac, e–g At least three independent experiments were performed with similar results. Source data are provided as a Source Data file.
Fig. 4
Fig. 4. Clinical β-Syn mutants promote liquid-solid phase separation of α-Syn.
a Schematic diagram of wildtype and mutant β-Syn used in this study. b Representative confocal images of wildtype α-Syn (100 μM, 10% Rho-α-Syn) with or without clinical β-Syn mutant (100 μM, 10% FAM labeled) condensates. α-Syn labeled with Rhodamine B (Rho) exhibits red fluorescence, β-Syn labeled with 5(6)-FAM (FAM) exhibits green fluorescence, and the merged channel shows an orange color. Scale bar, 5 μm. c The turbidity at 405 nm for comparing the clinical β-Syn mutants on the phase separation of wildtype α-Syn, n = 3 independent samples. **PTurbidity (CT vs α-Syn) < 0.0001, **PTurbidity (CT vs α-Syn + β-Syn) < 0.0001, **PTurbidity (CT vs α-Syn + V70M) < 0.0001, **PTurbidity (CT vs α-Syn + P123H) < 0.0001, *PTurbidity (CT vs β-Syn120) = 0.0115, **PTurbidity (CT vs α-Syn + β-Syn120) < 0.0001, **PTurbidity (CT vs α-Syn + β-Syn104) < 0.0001. d Normalized FRAP recovery curves of wildtype α-Syn with or without clinical β-Syn mutants, n = 6 condensates per group. e TEM images show fibrils or gel-like formation for wildtype or clinical β-Syn mutants with α-Syn on day 7. Scale bar, 200 nm. All the experiments were carried out with α-Syn (100 μM), β-Syn wildtype or mutants (100 μM), and α-Syn (100 μM) + wildtype or mutant β-Syn (100 μM) in the presence of 20% PEG. be At least three independent experiments were performed with similar results. Data are presented as mean ± SD, one-way ANOVA was used for multiple experimental groups without adjustment. *P < 0.05; **P < 0.01 ns, no significance. Source data are provided as a Source Data file.
Fig. 5
Fig. 5. Wildtype β-Syn alleviates while clinical β-Syn mutants exacerbate α-Syn-induced neurodegeneration.
a Schematic diagram of microinjection in C. elegans. b Representative confocal images of the heads of different C. elegans strains. Scale bar, 100 μm. Zoomed images show enlarged puncta in different strains. Scale bar, 10 μm. α-Syn fused with YFP gives green fluorescence, wildtype and mutant β-Syn fused with mNeptune2.5 shows red fluorescence. c Normalized FRAP recovery curves of α-Syn inclusions in different strains, n = 6 inclusions per group. d Thrashing assay results for different C. elegans strains. Experiments were repeated 3 times, 10 worms were used for each condition. **PThrashing (NL5901 vs β-Syn) < 0.0001, **PThrashing (NL5901 vs α-Syn;β-Syn) < 0.0001, **PThrashing (NL5901 vs α-Syn;V70M) = 0.0009, *PThrashing (NL5901 vs α-Syn;P123H) = 0.0128. e Survival curves (top) and median lifespan (bottom) of N2, N2;β-Syn, N2;V70M and N2;P123H strains. The median lifespan is given as the length in days at which each group reached 50% survival. Experiments were repeated at least 3 times, 20 worms were used for each condition. *Pmedian lifespan (N2 vs β-Syn) = 0.0487, *Pmedian lifespan (N2 vs V70M) = 0.0244, **P median lifespan (N2 vs P123H) = 0.0035. f Survival curves (top) and median lifespan (bottom) of NL5901, α-Syn;β-Syn, α-Syn;V70M and α-Syn;P123H strains. Experiments were repeated at least 3 times, 20 worms were used for each condition. **Pmedian lifespan (NL5901 vs α-Syn;β-Syn) = 0.0034, **Pmedian lifespan (NL5901 vs α-Syn;V70M) = 0.0016, *Pmedian lifespan (NL5901 vs α-Syn;P123H) = 0.0135. Data are presented as mean ± SD, one-way ANOVA was used for multiple experimental groups without adjustment. *P < 0.05; **P < 0.01.. bf At least three independent experiments were performed with similar results. Source data are provided as a Source Data file.
Fig. 6
Fig. 6. Rationally designed β-Syn derived peptides inhibit the LSPS of α-Syn and protect against α-Syn-induced neurodegeneration.
a A simulated low-energy binding conformation of α-Syn and β-Syn complex. The interaction surface is shown in the zoomed box. b Workflow for the screening and evaluation of peptides that inhibit α-Syn phase separation. c Representative confocal images of α-Syn (100 μM, 10% Rho-α-Syn) in the presence of β-Syn (100 μM) or peptides (500 μM). α-Syn labeled with Rhodamine B (Rho) exhibits red fluorescence. Scale bar, 5 μm. The experiments were carried out in the presence of 20% PEG. d Normalized FRAP recovery curves of α-Syn (100 μM) condensates in the presence of β-Syn (100 μM) or antagonistic peptides (500 μM), n = 6 condensates per group. The experiments were carried out in the presence of 20% PEG. e Representative confocal images of NL5901 head with or without peptides. α-Syn fused with YFP gives green fluorescence. Scale bar, 100 μm. f Normalized FRAP recovery curves of α-Syn inclusions in NL5901 after treated with or without peptides (100 μM), n = 6 inclusions per group. g Effects of antagonistic peptides (100 μM) on thrashing movement of NL5901. Experiments were repeated 3 times, 10 worms were used for each condition. **PThrashing (NL5901 vs NL5901 + P0) < 0.0001, **PThrashing (NL5901 vs NL5901 + P1) < 0.0001, **PThrashing (NL5901 vs NL5901 + P3) < 0.0001, **PThrashing (NL5901 vs NL5901 + P4) < 0.0001, **PThrashing (NL5901 vs NL5901 + P5) < 0.0001. h, i Effects of peptides (100 μM) on survival curves and median lifespan of NL5901. Experiments were repeated at least 3 times, 20 worms were used for each condition. **Pmedian lifespan (NL5901 vs NL5901 + P0) = 0.0004, **Pmedian lifespan (NL5901 vs NL5901 + P1) = 0.001, **Pmedian lifespan (NL5901 vs NL5901 + P3) = 0.0004, **Pmedian lifespan (NL5901 vs NL5901 + P4) < 0.0001, **Pmedian lifespan (NL5901 vs NL5901 + P5) < 0.0001. j A working model of β-Syn effect on α-Syn liquid-liquid phase separation (LLPS) and liquid-solid phase separation (LSPS). Wildtype β-Syn facilitates the LLPS of α-Syn and delays the LSPS of α-Syn, while β-Syn mutations lose this ability. And peptides derived from β-Syn can inhibit the aggregation of α-Syn. Data are presented as mean ± SD, one-way ANOVA was used for multiple experimental groups without adjustment. **P < 0.01; ns, no significance. ci At least three independent experiments were performed with similar results. Source data are provided as a Source Data file.

Similar articles

Cited by

References

    1. Shin, Y. & Brangwynne, C. P. Liquid phase condensation in cell physiology and disease. Science357, eaaf4382 (2017). - PubMed
    1. Agarwal, A., Arora, L., Rai, S. K., Avni, A. & Mukhopadhyay, S. Spatiotemporal modulations in heterotypic condensates of prion and α-synuclein control phase transitions and amyloid conversion. Nat. Commun.13, 1154 (2022). - PMC - PubMed
    1. Chakraborty, P. & Zweckstetter, M. Role of aberrant phase separation in pathological protein aggregation. Curr. Opin. Struct. Biol.82, 102678 (2023). - PubMed
    1. Castillo-Barnes, D. et al. Nonlinear weighting ensemble learning model to diagnose Parkinson’s disease using multimodal data. Int J. Neural Syst.33, 2350041 (2023). - PubMed
    1. Rey, N. L. et al. Widespread transneuronal propagation of α-synucleinopathy triggered in olfactory bulb mimics prodromal Parkinson’s disease. J. Exp. Med.213, 1759–1778 (2016). - PMC - PubMed

Publication types

MeSH terms

LinkOut - more resources