. 2024 Oct 9;14(1):23646.
doi: 10.1038/s41598-024-70702-1.

Colorectal cancer-associated bacteria are broadly distributed in global microbiomes and drivers of precancerous change

Affiliations

Colorectal cancer-associated bacteria are broadly distributed in global microbiomes and drivers of precancerous change

Samuel S Minot et al. Sci Rep. .

Abstract

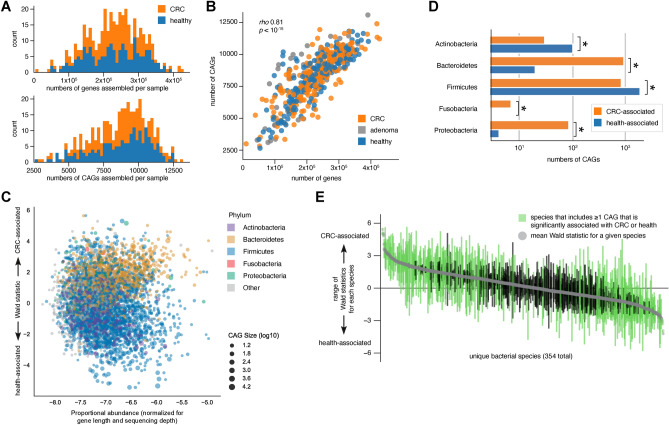
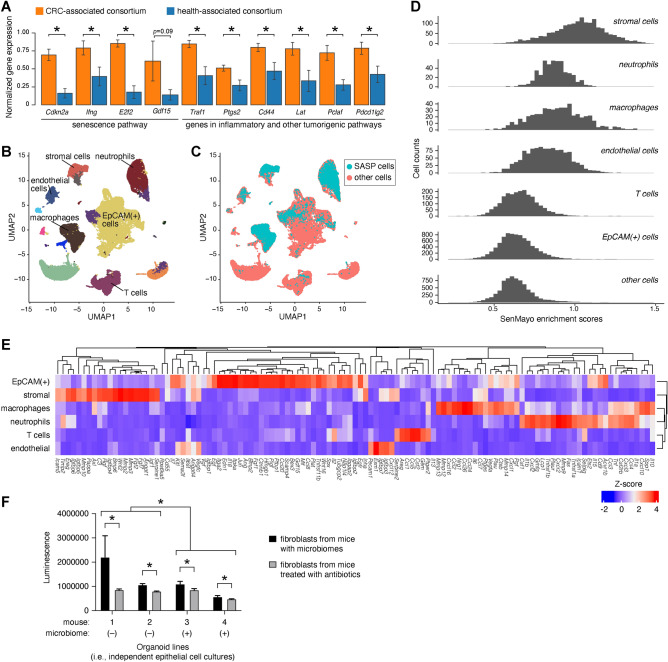
The gut microbiome is implicated in the pathogenesis of colorectal cancer (CRC), but the full scope of this dialogue is unknown. Here we aimed to define the scale and membership of the body of CRC- and health-associated gut bacteria in global populations. We performed a microbiome-CRC correlation analysis of published ultra-deep shotgun metagenomic sequencing data from global microbiome surveys, utilizing a de novo (reference-agnostic) gene-level clustering approach to identify protein-coding co-abundant gene (CAGs) clusters. We link an unprecedented ~ 23-40% of gut bacteria to CRC or health, split nearly evenly as CRC- or health-associated. These microbes encode 2319 CAGs encompassing 427,261 bacterial genes significantly enriched or depleted in CRC. We identified many microbes that had not previously been linked to CRC, thus expanding the scope of "known unknowns" of CRC-associated microbes. We performed an agnostic CAG-based screen of bacterial isolates and validated predicted effects of previously unimplicated bacteria in preclinical models, in which we observed differential induction of precancerous adenomas and field effects. Single-cell RNA sequencing disclosed microbiome-induced senescence-associated gene expression signatures in discrete colonic populations including fibroblasts. In organoid co-cultures, primary colon fibroblasts from mice with microbiomes promoted significantly greater growth than fibroblasts from microbiome-depleted mice. These results offer proof-of-principle for gene-level metagenomic analysis enabling discovery of microbiome links to health and demonstrate that the microbiome can drive precancer states, thereby potentially revealing novel cancer prevention opportunities.


Conflict of interest statement

S.S.M. and N.D. are named inventors on a pending US non-provisional patent application (18/320,878: Bacterial Gene-Associated Methods and Compositions for Diagnosing and Treating Colorectal Cancer). All other authors declare no competing interests.

Figures

Fig. 1
Fig. 1
Association of diverse microbial CAGs with CRC and health. (A) Stacked histogram depicting numbers of genes assembled per sample (top) and CAGs per sample (bottom). (B) Correlation between numbers of CAGs and genes across the aggregated training dataset, color-coded by cohort. The gray dots, which represent metagenomes from individuals with adenomas, were not used in generating our CAG-based model. (C) Bacterial CAGs that are enriched in CRC or in health are encoded in the genomes of phylogenetically diverse bacteria observed at varying abundances, from extremely rare to highly prevalent. (D) Phylum-level differences between CRC-associated and health-associated CAGs. (E) CRC-association Wald statistics of all identified CAGs, collapsed by species-level taxonomic classifications and rank ordered by mean Wald statistic.
Fig. 2
Fig. 2
Divergence of CRC-associated CAGs and health-associated CAGs. (A) Proportion of metagenomic shotgun sequencing reads from CRC cohorts vs healthy cohorts that align to CRC-associated or health-associated CAGs. (B) Log ratio of CRC-vs-health-associated CAG aligning proportions of reads in the training dataset. (C) Proportion of reads within samples aligning to CRC-associated or health-associated CAGs in the training dataset. (D) Significant correlations between CRC-associated CAGs, between health-associated CAGs, and between CRC-associated and health-associated CAGs. (E) Circos plot showing significant correlations between top CRC-associated and health-associated CAGs. Ribbon widths indicate correlation coefficients. Correlations between health-associated CAGs and between CRC-associated CAGs are represented by blue and orange ribbons, respectively, while a single significant correlation between a CRC-associated CAG (CAG3) and health-associated CAG (CAG170) is shown in green. (F) Proportions of individual RefSeq genomes aligning to CAGs with Wald statistic of > 1 or <  − 1 using a ≥ 1% genome alignment threshold. (G) Genomes of 9 Enterobacteriaceae aligned to both CRC-associated and health-associated CAGs.
Fig. 3
Fig. 3
Metagenome-based CRC-association scoring of individuals with CRC, adenoma, or history of advanced adenoma compared to healthy controls. (A) Significantly different CRC-association scores in CRC versus healthy cohorts in the datasets analyzed here. (B) CRC-association scores of fecal microbiomes from individuals with adenoma or CRC compared to healthy cohorts in two published studies. (C) Validation of CRC-association scores in local cohorts of individuals with CRC, history of advanced adenoma, or neither (i.e., healthy controls). A bimodal distribution of scores was seen in individuals with a history of advanced adenoma (adenomahigh and adenomalow). In this plot, each individual is represented only once (first time point [T1] sample only) to avoid pseudoreplication in the statistical analysis. (D) Fecal microbiomes collected from individuals with history of advanced adenoma as a part of this study, rank-ordered by CRC-association scores (dot plot, top), and underlying abundances of top 10 CRC-associated CAGs and top 10 health-associated CAGs (heatmap, bottom).
Fig. 4
Fig. 4
CRC-association scores predict microbiome-induced tumorigenicity. (A) CRC-association scores and underlying Wald metrics of genome-aligned CAGs for a panel of bacterial strains. Consortium members highlighted. (B) CRC-or-health signatures seen in metagenomic sequencing of fecal pellets collected from gnotobiotic mice colonized with CRC-associated or health-associated consortia. (C) Small intestinal tumor burden in gnotobiotic mice colonized with CRC-associated consortium or health-associated consortium.
Fig. 5
Fig. 5
The microbiome induces senescence in specific colonic cell populations, which then drives epithelial cell growth phenotypes. (A) Differentially expressed genes in healthy-appearing non-tumor colonic tissue harvested from mice colonized with a CRC-associated or health-associated consortium. (BC) Single-cell RNAseq of healthy-appearing colons reveals discrete cell clusters of SASP cells, as shown in these UMAP plots. (D) Distribution of SenMayo enrichment scores and (E) expression of different subsets of SenMayo genes in different cell populations of the colon. (F) Microbiome conditioning of fibroblasts drives increased epithelial cell growth in an in vitro organoid model.

References

    1. Sung, H. et al. Global cancer statistics 2020: GLOBOCAN estimates of incidence and mortality worldwide for 36 cancers in 185 countries. CA Cancer J. Clin.71, 209–249 (2021). - PubMed
    1. Burkitt, D. P. Epidemiology of cancer of the colon and rectum. Cancer28, 3–13 (1971). - PubMed
    1. Wirbel, J. et al. Meta-analysis of fecal metagenomes reveals global microbial signatures that are specific for colorectal cancer. Nat. Med.25, 679 (2019). - PMC - PubMed
    1. Wu, S. et al. A human colonic commensal promotes colon tumorigenesis via activation of T helper type 17 T cell responses. Nat. Med.15, 1016–1022 (2009). - PMC - PubMed
    1. Bonnet, M. et al. Colonization of the human gut by E. coli and colorectal cancer risk. Clin. Cancer Res.20, 859–867 (2014). - PubMed

LinkOut - more resources