. 2024 Oct 10;15(1):8766.
doi: 10.1038/s41467-024-53136-1.

Disordered regions of human eIF4B orchestrate a dynamic self-association landscape

Affiliations

Disordered regions of human eIF4B orchestrate a dynamic self-association landscape

Bikash Chandra Swain et al. Nat Commun. .

Abstract

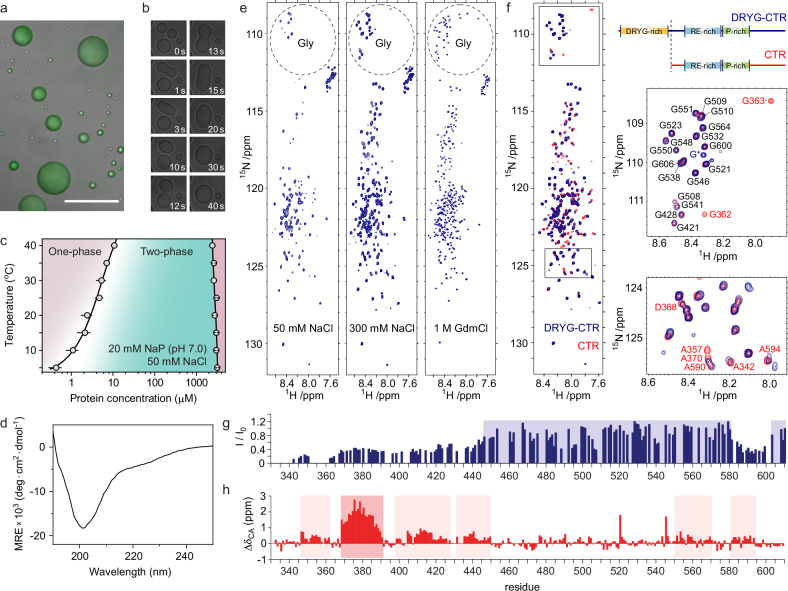
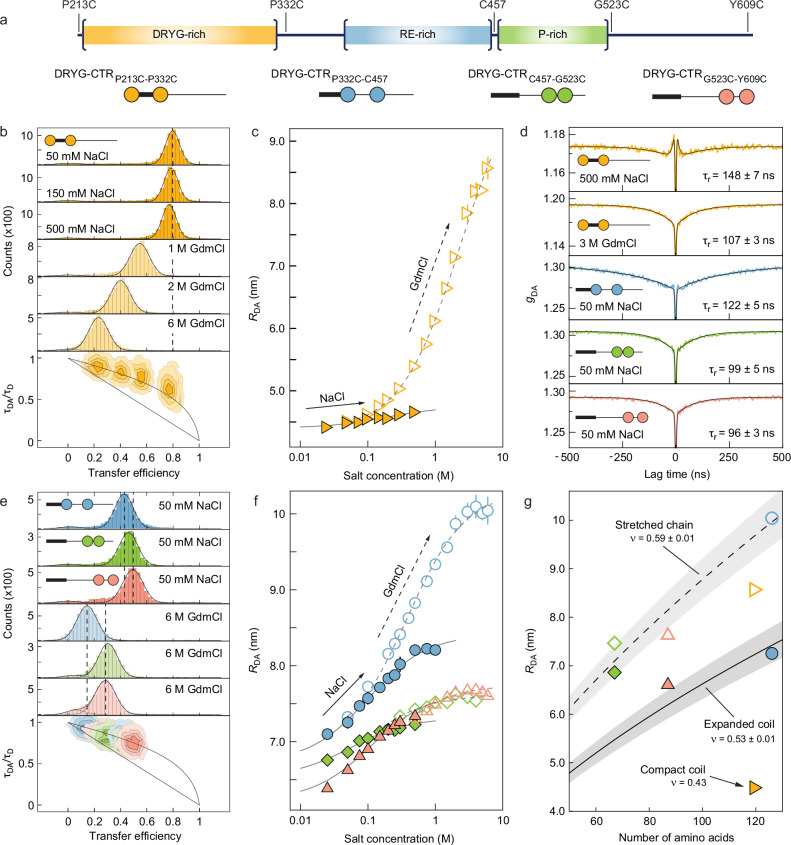
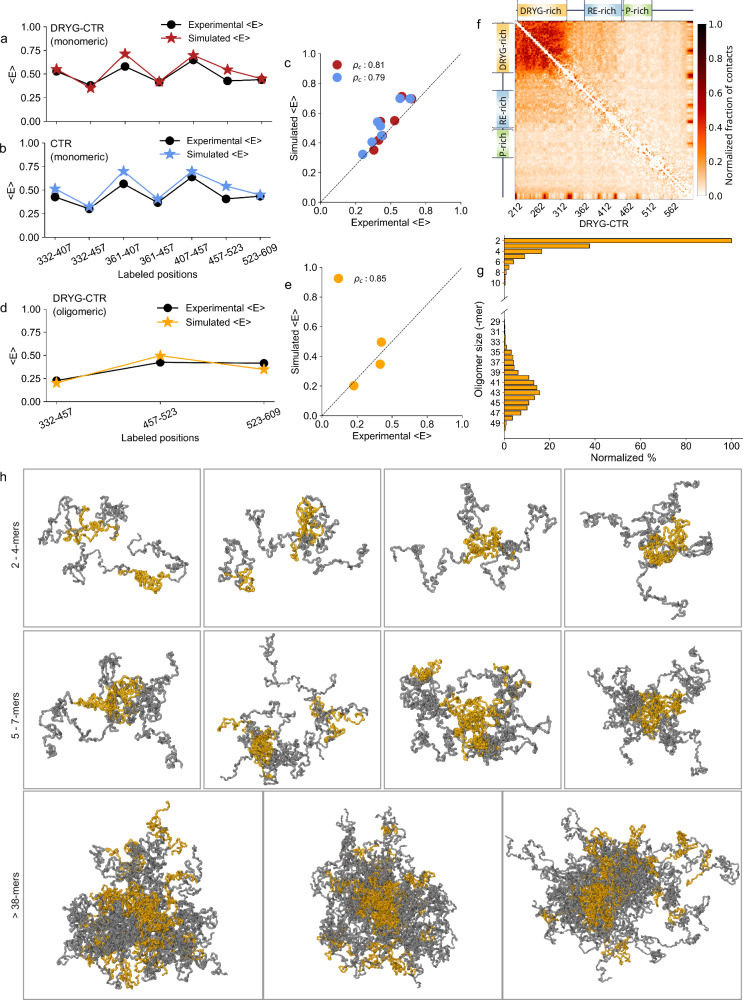
Eukaryotic translation initiation factor eIF4B is required for efficient cap-dependent translation, it is overexpressed in cancer cells, and may influence stress granule formation. Due to the high degree of intrinsic disorder, eIF4B is rarely observed in cryo-EM structures of translation complexes and only ever by its single structured RNA recognition motif domain, leaving the molecular details of its large intrinsically disordered region (IDR) unknown. By integrating experiments and simulations we demonstrate that eIF4B IDR orchestrates and fine-tunes an intricate transition from monomers to a condensed phase, in which large-size dynamic oligomers form before mesoscopic phase separation. Single-molecule spectroscopy combined with molecular simulations enabled us to characterize the conformational ensembles and underlying intra- and intermolecular dynamics across the oligomerization transition. The observed sensitivity to ionic strength and molecular crowding in the self-association landscape suggests potential regulation of eIF4B nanoscopic and mesoscopic behaviors such as driven by protein modifications, binding partners or changes to the cellular environment.


Conflict of interest statement

The authors declare no competing interests.

Figures

Fig. 1
Fig. 1. An overview of sequence and structural characteristics of eIF4B.
a Cartoon representation of human eIF4B based on the RRM domain structure (PDB: 2J76) and predicted IDR structural propensity from AlphaFold2. b Schematic domain representation of human eIF4B, together with a disorder prediction plot based on IUPred3 (dark blue) and the prediction of polyproline II secondary structure propensity (gray). The structured RRM domain and short disordered N-terminal tail are shadowed in gray. The boundaries of protein constructs used in this work are also indicated. c Amino acid distribution plots for negative (D and E, shown in red and purple, respectively), positive (R and K, shown in teal and light blue, respectively), aromatic (Y, F and W, shown in orange, brown and yellow, respectively), glycine (G, shown in black) and proline (P, shown in green) residues, particularly highlighting clustering of these residues within several subregions, i.e. DRYG-rich region (residues 214–327; highlighted in light orange), RE-rich region (residues 367–455; highlighted in light blue) and the P-rich region (residues 460–522; highlighted in light green). Source data are provided as a Source Data file.
Fig. 2
Fig. 2. The structural and phase separation behavior of eIF4B IDR.
a An overlay of DIC and fluorescence images of liquid-like droplets forming upon phase separation of DRYG-CTR. The image is representative of results from 3 independent experiments. The scale bar indicates 20 μm. b A time course of DIC images showing rapid fusion of protein droplets. c Phase diagram of DRYG-CTR in 20 mM NaP, 50 mM NaCl (pH 7.0), showing the temperature dependence of csat (left branch) and cdense (right branch). Each data point was measured in 3 independent replicates; the data are presented as mean values +/− SD. The black solid lines are included as visual guides to emphasize the boundaries between the one-phase (highlighted in purple) and two-phase (highlighted in cyan) regimes. d Far-UV CD spectrum of DRYG-CTR in 20 mM NaP, 75 mM NaCl (pH 7.0), highlighting the low secondary structure content in DRYG-CTR. e 1H,15N-HSQC spectra of DRYG-CTR in 20 mM NaP (pH 7.0) buffer with 50, 300 mM NaCl and 1 M GdmCl. The dashed circles highlight resonance peaks for glycine residues. f The overlay of HSQC spectra for DRYG-CTR (blue) and CTR (red) constructs in 20 mM NaP, 150 mM NaCl (pH 7.0). The right panel shows the schematics of DRYG-CTR and CTR constructs, together with closeup segments of the overlaid HSQC spectra. g The ratio of peak intensities for DRYG-CTR and CTR constructs, the light blue shaded areas indicate the protein regions with comparable peak heights between the two constructs. h Secondary chemical shift values for 13Cα in CTR, based on Biological Magnetic Resonance Bank (BMRB) entry 51957 and random coil values calculated by the online ncIDP server. The regions of increased secondary structure propensity are highlighted in shades of light red. Source data are provided as a Source Data file.
Fig. 3
Fig. 3. Different regions of eIF4B IDR have distinct compactness and dynamics.
a A schematic representation of the DRYG-CTR construct, highlighting the cysteine residues used for fluorescent labeling. The bottom panel shows icons for four fluorescently labeled constructs used in smFRET experiments. b Transfer efficiency, E, histograms of DRYG-CTRP213C-P332C at different concentrations of NaCl and GdmCl. The dashed line indicates mean E at 50 mM NaCl. The bottom panel shows donor lifetime-E histograms, under the same conditions as the E histograms. The diagonal and curved lines indicate the dependence expected for fixed distance and broad distance distribution, respectively. c The mean inter-residue distance, RDA, for DRYG-CTRP213C-P332C depending on NaCl (orange filled symbols) and GdmCl (orange open symbols) concentration. The solid and dashed lines show the fits to an empirical binding isotherm. d nsFCS donor-acceptor correlation curves for DRYG-CTRP213C-P332C at 500 mM NaCl and 3 M GdmCl (orange), and for DRYG-CTRP332C-C457 (blue), DRYG-CTRC457-G523C (green) and DRYG-CTRG523C-Y609C (pink) at 50 mM NaCl. The solid black lines are fits used to determine the τr reconfiguration times, as indicated (see “Methods” for details). e Transfer efficiency histograms of DRYG-CTRP332C-C457, DRYG-CTRC457-G523C and DRYG-CTRG523C-Y609C at 50 mM NaCl and 6 M GdmCl. The dashed lines indicate mean E for DRYG-CTRP332C-C457 and DRYG-CTRG523C-Y609C in the presence of NaCl and GdmCl. The bottom panel shows donor lifetime-E histograms, under the same conditions as the E histograms. f The RDA for DRYG-CTRP332C-C457 (blue), DRYG-CTRC457-G523C (green) and DRYG-CTRG523C-Y609C (pink) depending on NaCl (filled symbols) and GdmCl (open symbols) concentration. The solid and dashed lines show the fits to an empirical binding isotherm. Each data point in (c, f) was acquired in 3 independent replicates and are presented as mean values +/− SD. g The dependence of RDA for DRYG-CTRP213C-P332C (orange), DRYG-CTRP332C-C457 (blue), DRYG-CTRC457-G523C (green) and DRYG-CTRG523C-Y609C (pink) on sequence separation (Naa), at 50 mM NaCl (filled symbols) and 6 M GdmCl (open symbols). The solid and dashed lines indicate the RDA - Naa dependence with ν = 0.53 and ν = 0.59, respectively. The gray bands show the expected range considering ±0.01 uncertainty of ν. Source data are provided as a Source Data file.
Fig. 4
Fig. 4. eIF4B IDR undergoes self-association and forms large-size oligomers, with weak dependence on ionic strength.
a A schematic of the FCS oligomerization assay, based on a titration of sub-nanomolar labeled DRYG-CTR with micromolar concentrations of unlabeled protein. b A set of FCS curves at 75 mM NaCl obtained in the presence of increasing protein concentration (from dark red to dark blue). The arrow highlights a shift of FCS curves towards higher times, indicating a growing size of diffusing species. c The dependence of relative diffusion rates (normalized to the diffusion rate of monomeric protein) on protein concentration, acquired in buffers containing 75 (light purple circles), 150 (purple rhombi) and 300 (violet triangles) mM NaCl, indicates a reduction of protein association affinity with increasing buffer ionic strength. Each data point was measured in 3 independent replicates; the data are presented as mean values +/− SD. The solid lines show global fits to the Hill equation. The right axis shows the size of oligomers, considering the D ~ 1/N1/3 dependence (see “Methods” for details). d The dependence of apparent dissociation constant on buffer ionic strength. Error bars are represented by standard errors of the fits in (c) and are smaller than plot symbols, thus may not be visible. The black solid line is a fit with the Lohman–Record model. Source data are provided as a Source Data file.
Fig. 5
Fig. 5. Oligomerization of eIF4B IDR and underlying conformational dynamics.
ac Transfer efficiency histograms of DRYG-CTRP332C-C457 (blue), DRYG-CTRC457-G523C (green) and DRYG-CTRG523C-Y609C (pink) constructs at increasing concentrations of unlabeled protein. The dashed lines indicate mean E of unbound DRYG-CTR (monomeric) and bound DRYG-CTR (oligomeric), for each construct, respectively. The bottom panels show donor lifetime - E histograms for each construct in the absence (light colored) and presence (dark colored) of unlabeled protein, corresponding to monomeric and oligomeric states, as respectively indicated. The diagonal and curved lines indicate the static and dynamic lines, as in Fig. 3. d The fraction of oligomer-bound DRYG-CTRP332C-C457 (blue) as a function of overall protein concentration. Each data point was measured in 3 independent replicates; the data are presented as mean values +/− SD. The black line is a fit to the Hill equation. e The mean transfer efficiencies of DRYG-CTRC457-G523C (green) and DRYG-CTRG523C-Y609C (pink) as a function of overall protein concentration. Each data point was measured in 3 independent replicates; the data are presented as mean values +/− SD. The black lines are fits to the Hill equation. f Plot of DRYG-CTR association kinetics in the presence of 4 μM unlabeled protein, showing the relaxation of bound (dark blue) and unbound (light blue) states over time. Each data point was measured in three independent replicates; the data are presented as mean values +/− SD. The solid lines show global fits with single relaxation rates, as indicated alongside the corresponding plots. Dashed lines show the kinetic behavior in the absence of protein association (i.e. originating from the occurrence of new molecules only). Source data are provided as a Source Data file.
Fig. 6
Fig. 6. Coarse-grained ensembles of eIF4B IDR suggest a direct role of the DRYG-rich region in driving oligomer formation.
a, b Experimental (black) and simulated (red and blue) mean transfer efficiencies, E as a function of labeled positions for monomeric DRYG-CTR (a) and CTR (b) at an ionic strength of I = 192 mM (corresponding to buffer ionic strength of 20 mM NaP with 150 mM NaCl). c Correlations between the experimental and simulated E. The concordance correlation coefficients (ρc) are reported in the legend for DRYG-CTR and CTR, respectively. d Experimental (black) and simulated (orange) E as a function of labeled positions for DRYG-CTR simulated at an ionic strength of I = 117 mM (corresponding to buffer ionic strength of 20 mM NaP with 75 mM NaCl) and conditions favoring formation of oligomers (see “Methods” for details). e Correlation between the experimental and simulated E, with the concordance correlation coefficients (ρc) reported in the legend. f Difference in the fraction of contacts between monomeric and oligomeric DRYG-CTR, at an ionic strength of I = 117 mM, as observed in experiments. Darker regions indicate the intermolecular contacts when DRYG-CTR is in its oligomeric state, with an increase in inter-chain contacts particularly seen within the DRYG region (residues 213–331). g Bar plot showing the size of oligomers obtained from the simulations of DRYG-CTR in the oligomeric state at I = 117 mM. Each oligomer size is expressed as a percentage of the simulated trajectory and normalized considering the size of the smallest oligomer (2-mer). h Representative conformations of oligomeric clusters of eIF4B IDR. The DRYG-rich region is represented as gold, whilst the CTR is shown in gray. Source data are provided as a Source Data file.
Fig. 7
Fig. 7. Disordered segments of eIF4B define its phase separation behavior.
a Schematics of DRYG-CTR and truncated constructs used in phase separation experiments. b Bar chart showing the csat values for DRYG-CTR and truncated constructs at 20 mM NaP, 50 mM NaCl (pH 7.0), 20 °C. c Phase diagrams of DRYG-CTR (purple circles), DRYG-CTR-N (blue hexagons) and DRYG-CTR-C (green pentagons) constructs based on csat values (filled symbols) and KD values (open symbols, as in Fig. 4c and Supplementary Fig. 15) as a function of NaCl concentration and total ionic strength (right axis). Each csat data point was measured in 3 independent replicates; the data are presented as mean values +/− SD. The solid colored lines are fits to an empirical dose-response function. The solid black lines are fits with the Lohman–Record model. The one-phase and two-phase regimes of the phase diagram are indicated. d Schematic phase diagram defined by protein concentration and ionic strength indicative of the self-association landscape of eIF4B IDR and underlying transitions across monomeric, oligomeric and condensed droplet states. e Phase diagrams of the DRYG-CTR construct based on csat values (filled circles) and KD values (open symbols) as a function of NaCl concentration and total ionic strength (right axis), in the absence (purple cicles) and presence (purple rhombi and triangles) of crowding agent PEG. Each csat data point was measured in 2 independent replicates; the data are presented as mean values +/− SD. The solid purple lines are fits to an empirical dose-response function. The solid black lines are fits with the Lohman–Record model. The dark red point indicates the average eIF4B concentration in HeLa cells and a range of physiological ionic strength. The shaded area shows the mean deviation along both axes. The regions of the phase diagrams in (ce) corresponding to monomers, oligomers, and droplets are highlighted in shades of purple, orange, and red, respectively. Source data are provided as a Source Data file.

References

    1. Jackson, R. J., Hellen, C. U. & Pestova, T. V. The mechanism of eukaryotic translation initiation and principles of its regulation. Nat. Rev. Mol. Cell Biol.11, 113–127 (2010). - PMC - PubMed
    1. Hinnebusch, A. G. The scanning mechanism of eukaryotic translation initiation. Annu Rev. Biochem83, 779–812 (2014). - PubMed
    1. Merrick, W. C. eIF4F: a retrospective. J. Biol. Chem.290, 24091–24099 (2015). - PMC - PubMed
    1. Aitken, C. E. & Lorsch, J. R. A mechanistic overview of translation initiation in eukaryotes. Nat. Struct. Mol. Biol.19, 568–576 (2012). - PubMed
    1. Sokabe, M. & Fraser, C. S. Toward a kinetic understanding of eukaryotic translation. Cold Spring Harb Perspect Biol.11, a032706 (2019). - PMC - PubMed

Publication types

MeSH terms

Substances

LinkOut - more resources