. 2024 Oct 9;15(1):8747.
doi: 10.1038/s41467-024-53158-9.

CBFA2T3-GLIS2 mediates transcriptional regulation of developmental pathways through a gene regulatory network

Affiliations

CBFA2T3-GLIS2 mediates transcriptional regulation of developmental pathways through a gene regulatory network

Elizabeth A R Garfinkle et al. Nat Commun. .

Abstract

CBFA2T3-GLIS2 is a fusion oncogene found in pediatric acute megakaryoblastic leukemia that is associated with a poor prognosis. We establish a model of CBFA2T3-GLIS2 driven acute megakaryoblastic leukemia that allows the distinction of fusion specific changes from those that reflect the megakaryoblast lineage of this leukemia. Using this model, we map fusion genome wide binding that in turn imparts the characteristic transcriptional signature. A network of transcription factor genes bound and upregulated by the fusion are found to have downstream effects that result in dysregulated signaling of developmental pathways including NOTCH, Hedgehog, TGFβ, and WNT. Transcriptional regulation is mediated by homo-dimerization and binding of the ETO transcription factor through the nervy homology region 2. Loss of nerve homology region 2 abrogated the development of leukemia, leading to downregulation of JAK/STAT, Hedgehog, and NOTCH transcriptional signatures. These data contribute to the understanding of CBFA2T3-GLIS2 mediated leukemogenesis and identify potential therapeutic vulnerabilities for future studies.


Conflict of interest statement

The authors declare no competing interests.

Figures

Fig. 1
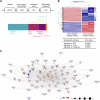
Fig. 1. CBFA2T3-GLIS2 drives the transformation of primary human megakaryoblasts.
A Generation of CBFA2T3-GLIS2-positive primary human megakaryoblasts. CD34+ stem cells were isolated from human cord blood, transduced with a lentivirus encoding the CBFA2T3-GLIS2 coding sequence and a GFP reporter, followed by differentiation to megakaryoblasts with human TPO and IL1β for 7–9 days. Cultures were sorted for GFP+ purity and transplanted into immunodeficient NSG-SGM3 mice. Recovered cells from transplantation were depleted for mouse CD45 cells, and GFP expression was confirmed by flow cytometry. B Serial transplantation (primary, N = 6; secondary, N = 11; and tertiary, N = 14) of fusion-positive megakaryoblasts induce AMKL within 200 days compared to empty vector megakaryoblasts (N = 6) which do not expand in vivo. Leukemia-free survival is shown. Source data are provided as a Source Data file. C t-SNE analysis of the gene expression profiles of in vitro cultured fusion-positive megakaryoblasts (light green), primary (red), secondary (blue), and tertiary (dark green) transplants, fusion-positive patient samples (orange), and AMKL patient samples harboring a different genetic driver other than the CBFA2T3-GLIS2 fusion (purple). Clusters are based on the top 1% of differentially expressed genes.
Fig. 2
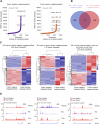
Fig. 2. CBFA2T3-GLIS2 binds at GC-rich promoter regions to alter gene expression.
A Summary of CUT&RUN-seq data from fusion immunoprecipitation. The percentage of fusion-bound genes that are expressed and differentially expressed in the cell is shown. Distribution of CUT&RUN-seq peak locations from fusion immunoprecipitation. UTR untranslated region, TSS transcription start site. Source data are provided as a Source Data file. B RNA extraction and gene expression profiling were performed on three technical replicates from fusion-negative megakaryoblasts cultured in vitro and fusion-positive leukemic megakaryoblasts recovered from two secondary transplantations. A heatmap of differentially expressed genes bound by the fusion at promoter regions is shown (N = 2657). Log2 fold change (FC) was calculated using a generalized linear model with a negative binomial distribution in DESeq2 and p-values derived from the Wald t-test and corrected using the Benjamini–Hochberg correction. Over-representation analysis using the Reactome database of differentially expressed genes bound by the fusion. p-values were calculated using a one-sided Fisher’s exact and adjusted for multiple comparisons using the Benjamini–Hochberg correction. C Top 74 nodes from transcription factor gene regulatory network (GRN) analysis.
Fig. 3
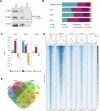
Fig. 3. CBFA2T3-GLIS2 alters super-enhancers.
A Averaged signal-ranking plots of H3K27ac bound genes were identified from CUT&RUN-seq in two fusion-negative megakaryoblast samples and two fusion-positive megakaryoblast samples from secondary transplants. Super-enhancer (SE) cut-off values are displayed on the graphs. Source data are provided as a Source Data file. B Venn diagram showing the overlap between SEs in fusion-negative megakaryoblasts (blue) and fusion-positive megakaryoblasts (red). C Heatmaps of differentially expressed SEs in fusion-negative megakaryoblasts (N = 222), fusion-positive megakaryoblasts (N = 187), and fusion-positive megakaryoblasts that are also bound by the fusion (N = 163). D H3K27ac binding profiles, fusion binding profiles, and corresponding RNA-sequencing tracks at the TESC, BCL2, and TCF7L2 SE. The TESC SE, essential for megakaryoblast differentiation, is lost in fusion-positive megakaryoblasts. BCL2, an anti-apoptotic gene, and TCF7L2, a member of the WNT signaling pathway, are upregulated super-enhancers exclusive to fusion-positive megakaryoblasts (generated using SparK v2.6.2).
Fig. 4
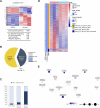
Fig. 4. ETO, CtBP1, and p300 associated with the CBFA2T3–GLIS2 transcriptional complex.
A Co-immunoprecipitations using fusion-positive leukemic megakaryoblasts confirm the association of ETO, CtBP1, and p300 with the fusion. All immunoprecipitations were repeated twice, representative blots are shown. Source data are provided as a Source Data file. B CUT&RUN-seq has performed in fusion-positive megakaryoblasts from two secondary transplants and fusion negative megakaryoblasts cultured in vitro for ETO, CtBP1, and p300. Distribution of CUT&RUN-seq peak locations for ETO, CtBP1, and p300. CBFA2T3-GLIS2 is included as a comparison. TSS transcription start site, TTS transcription termination site, UTR untranslated region. Source data are provided as a Source Data file. C Summary of ETO, CtBP1, and p300 bound genes retained, gained, and lost in fusion-positive megakaryoblasts compared to fusion-negative megakaryoblasts. Source data are provided as a Source Data file. D Heatmaps of enrichment for CBFA2T3-GLIS2 (CG-TY), H3K27ac, ETO, CtBP1, and p300 at genes bound by the fusion. E Venn diagram showing the overlap of genes bound at the promoters of ETO, CtBP1, and p300 exclusively in fusion-positive megakaryoblasts and their overlap with fusion-bound genes (Supplementary Data 3).
Fig. 5
Fig. 5. Loss of NHR2 disrupts ETO association and dimerization of the CBFA2T3–GLIS2 complex and abrogates leukemogenesis in vivo.
A–E Co-immunoprecipitation using 293T cells transfected with empty vector (MIG), wild-type fusion, or a fusion containing one or more of the mutations outlined in Fig. 4A. All immunoprecipitations were repeated twice, representative blots are shown. Source data for all blots are provided as a Source Data file. A Immunoprecipitation of ETO followed by staining with the TY-1 tag to detect CBFA2T3-GLIS2 and the reciprocal immunoprecipitation of CBFA2T3-GLIS2 via the TY-1 tag followed by staining for ETO is shown. B TY-1-tagged wild-type CBFA2T3-GLIS2 and one of three FLAG-tagged mutant constructs were co-transfected into 293T cells to evaluate the ability of the mutant constructs to dimerize with the wild-type fusion. Immunoprecipitation by TY-1 followed by staining for FLAG and the reciprocal immunoprecipitation of FLAG followed by staining for TY-1 is shown. C 293T cells were co-transfected with two mutant constructs, one FLAG-tagged and one TY-1-tagged, to verify the results shown in (B). Immunoprecipitation of TY-1-tagged NHR2 deletion mutant followed by staining for FLAG again revealed a reduction of dimerization. D TY-1-tagged wild-type and mutant fusion constructs were transfected into 293T cells. Cells were immunoprecipitated for CtBP1 followed by staining for the fusion via TY-1 and the reciprocal immunoprecipitation of the fusion followed by staining for CtBP1. E TY-1-tagged wild-type and mutant fusion constructs were transfected into 293T cells. Cells were immunoprecipitated for p300, followed by staining for the fusion via TY-1, and the reciprocal immunoprecipitation of the fusion followed by staining for p300. F, G Transplantation of immunodeficient NSG-SGM3 mice with primary megakaryoblasts transduced with the mutant fusion constructs (N = 5 per mutant construct, N = 9 wild type in panel F and 12 wild type in panel G). p < 0.0001 for NHR2 deletion and NHR1-2 (DL380,487AS) mutant constructs compared to wild type. p-values determined by log-rank test. Source data are provided as a Source Data file.
Fig. 6
Fig. 6. Impact of NHR2 deletion on CBFA2T3-GLIS2 transcription.
A RNA extraction and gene expression profiling were performed in technical triplicate on megakaryoblasts cultured in vitro transduced with either the fusion construct with NHR2 deleted or the wild-type fusion construct. In vitro, culturing was necessary due to the lack of expansion in vivo upon NHR2 deletion. A heatmap of all differentially expressed genes is shown (N = 1296). Significantly downregulated pathways, as determined by gene set enrichment analysis, are shown. For a full list of gene sets, please see supplementary data 4. Log2 fold change (FC) was calculated using a generalized linear model with a negative binomial distribution in DESeq2 and p-values derived from the Wald t-test and corrected using the Benjamini–Hochberg correction. False discovery rate (FDR) was calculated using the Benjamini–Hochberg correction. B CUT&RUN-seq was performed on NHR2 deletion mutants and compared to wild-type fusion cells. The proportion of sites where binding was lost, retained, and newly bound sites is shown. Source data are provided as a Source Data file. C Location of binding at newly bound targets, retained targets, and lost targets in NHR2 deletion mutants. Source data are provided as a Source Data file. D Gene Expression changes in NHR2 deletion mutants at sites where fusion binding was lost at the transcriptional start sites (N = 4059 genes). E Gene regulatory network of NHR2 deletion mutants.

References

    1. Gruber, T. A. & Downing, J. R. The biology of pediatric acute megakaryoblastic leukemia. Blood126, 943–949 (2015). - PMC - PubMed
    1. Taub, J. W. et al. Improved outcomes for myeloid leukemia of Down syndrome: a report from the Children’s Oncology Group AAML0431 trial. Blood129, 3304–3313 (2017). - PMC - PubMed
    1. Khan, I., Malinge, S. & Crispino, J. Myeloid leukemia in Down syndrome. Crit. Rev. Oncog.16, 25–36 (2011). - PMC - PubMed
    1. de Rooij, J. D. et al. Pediatric non-Down syndrome acute megakaryoblastic leukemia is characterized by distinct genomic subsets with varying outcomes. Nat. Genet.49, 451–456 (2017). - PMC - PubMed
    1. Gruber TA et al. An Inv(16)(p13.3q24.3)-encoded CBFA2T3-GLIS2 fusion protein defines an aggressive subtype of pediatric acute megakaryoblastic leukemia. Cancer cell22, 683–697 (2012). - PMC - PubMed

Publication types

MeSH terms

Associated data