. 2024 Oct 9;14(1):23526.
doi: 10.1038/s41598-024-73680-6.

Multicellular ovarian cancer spheroids: novel 3D model to mimic tumour complexity

Affiliations

Multicellular ovarian cancer spheroids: novel 3D model to mimic tumour complexity

Inken Flörkemeier et al. Sci Rep. .

Abstract

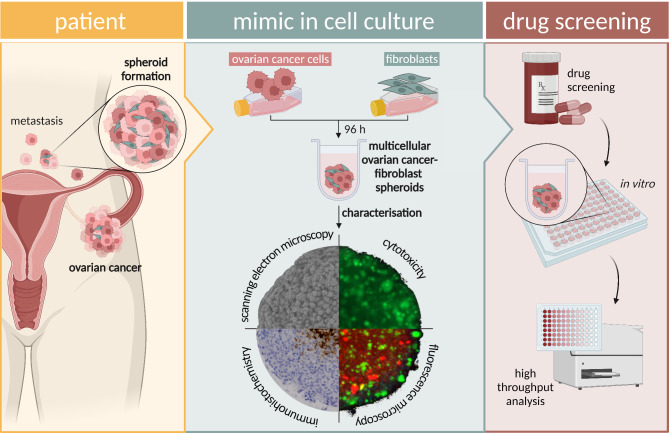
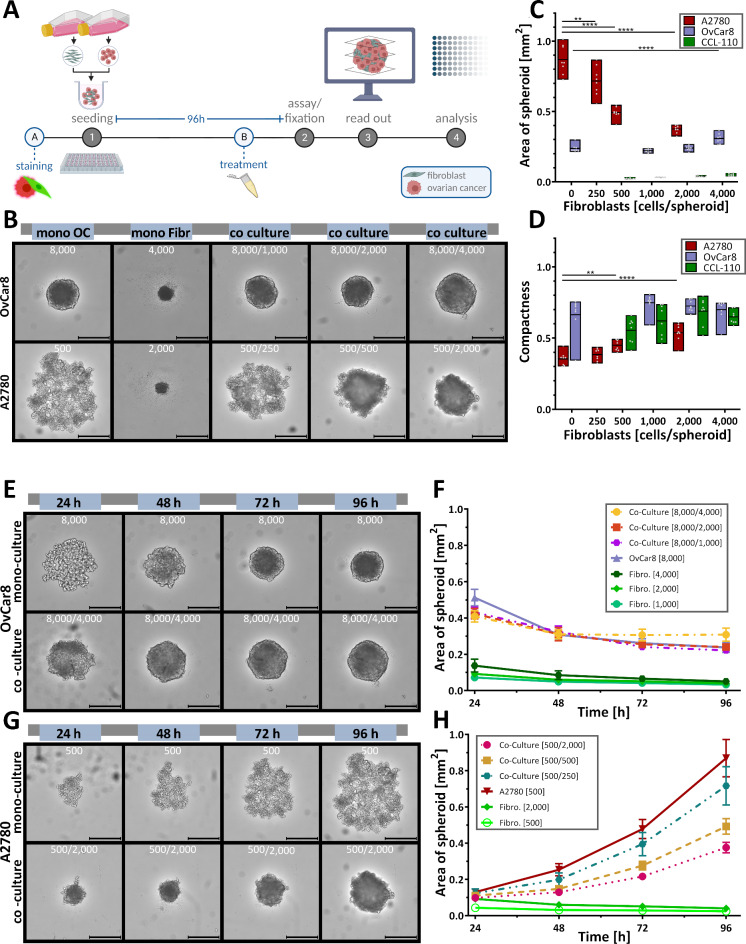
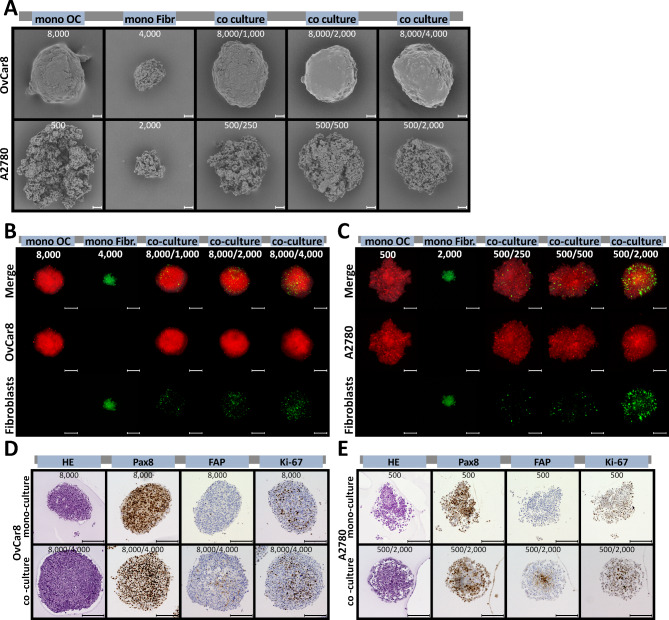
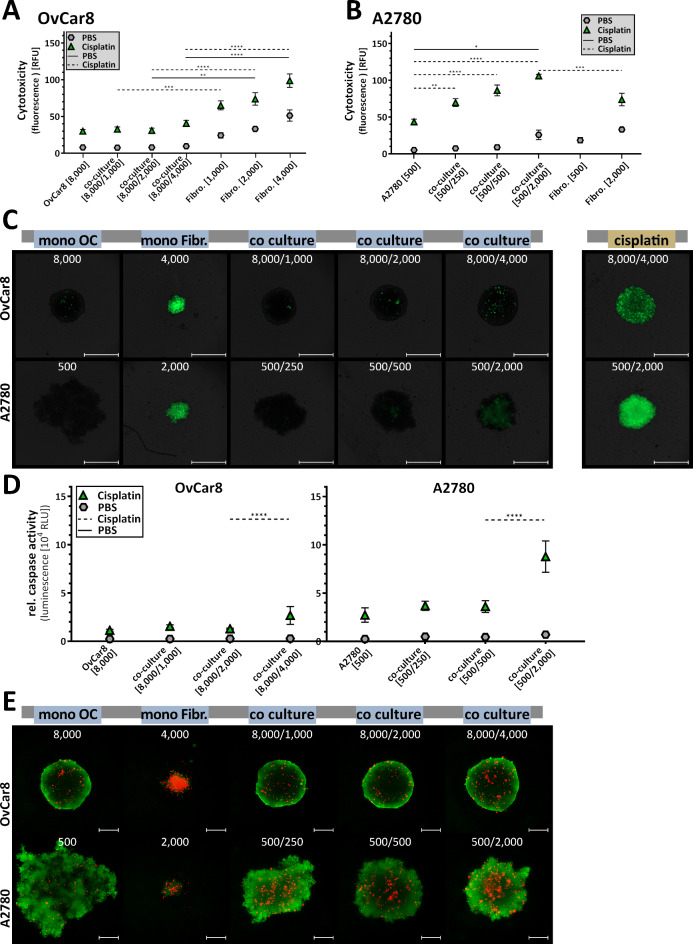
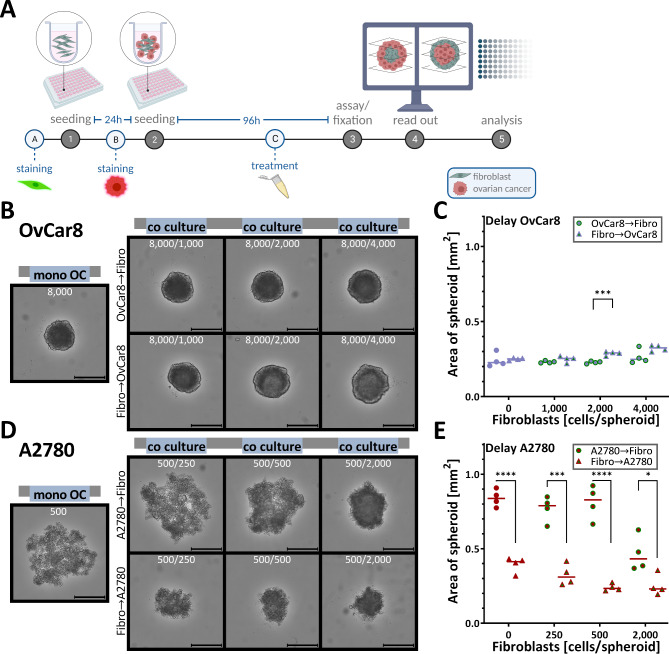
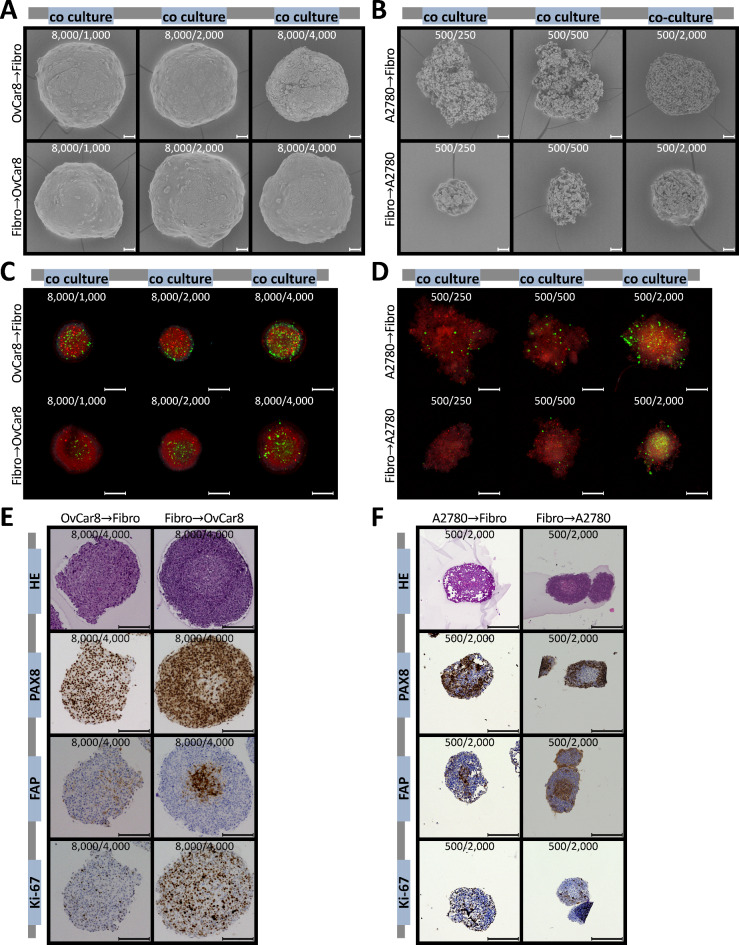
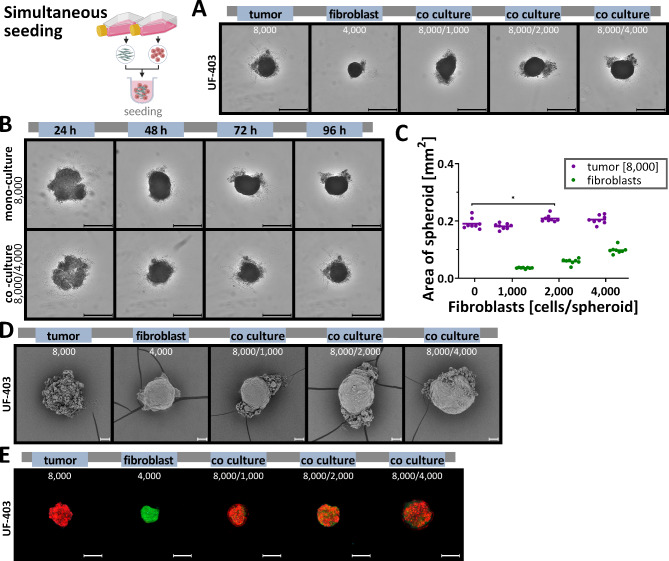
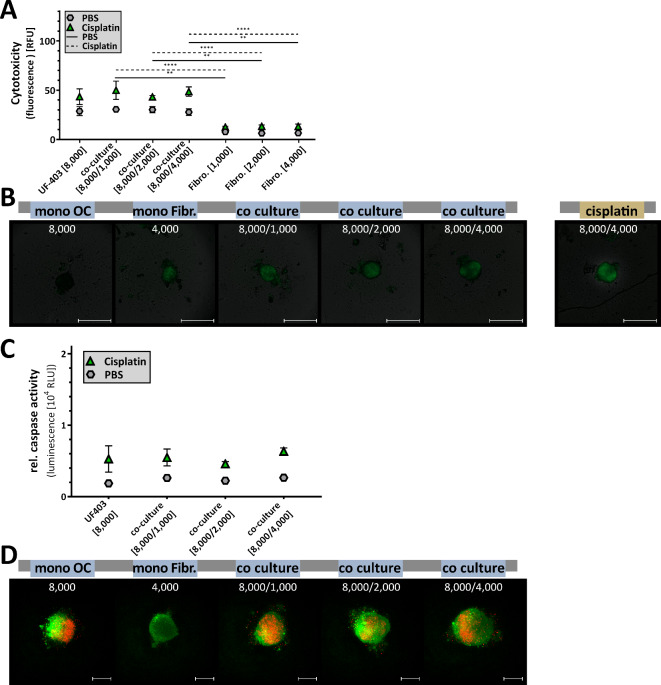
In vitro, spheroid models have become well established in cancer research because they can better mimic certain characteristics of in vivo tumours. However, interaction with the tumour microenvironment, such as cancer-associated fibroblasts, plays a key role in tumour progression. We initially focused on the interaction of tumour cells with fibroblasts. To model this interaction, we developed a spheroid model of ovarian cancer and fibroblasts. To this end, ovarian cancer cell lines and ex vivo primary cells were simultaneously and sequentially seeded with fibroblasts in a scaffold-free system at different ratios and subsequently characterized with respect to changes in morphology, proliferation, and viability. We demonstrated that co-cultures are able to form by far more compact spheroids, especially in cells that form aggregates in mono-culture. In addition, the co-cultures were able to increase proliferation and sensitivity to cisplatin. Simultaneous seeding led fibroblasts invade the core in both cell lines and primary cells. These results show differences in formation, firmness, and size between co-culture and mono-culture. Our model is designed to better represent and characterize the mutual influencing factors of fibroblasts and tumour cells. Fibroblast-supplemented multicellular spheroids are a valuable tool for tumour microenvironment interaction and new drug discovery.

Keywords: Co-culture model; Ovarian cancer and fibroblast; Spheroids; Tumour microenvironment.


Conflict of interest statement

The authors declare no competing interests.

Figures

Fig. 1
Fig. 1
Conceptual representation of the multicellular ovarian cancer-fibroblast spheroid model. In the in vivo setting of ovarian cancer, the TME, including fibroblasts, has a significant impact on tumour characteristics and fibroblasts play an important role in both primary tumour formation and metastasis. CAFs play a crucial role, especially in the formation of heterotypic spheroids. To incorporate this into a model, a spheroid culture of ovarian cancer cells and fibroblasts was developed. For this purpose, cells were co-cultivated for 96 h in ultra-low attachment plates and characterised by scanning electronic microscopy, immunohistochemistry, fluorescence microscope and cytotoxicity assays. Systematic characterization of the generated spheroids (cell viability, spheroid geometry and morphology) is essential to ensure the suitability for drug screening.
Fig. 2
Fig. 2
Growth progression and growth kinetics of simultaneously seeded mono and co-cultured spheroids. (A) Schematic creation of the co-cultivated spheroids, including tumour cells and human fibroblasts. Spheroids were cultured in mono-culture and in co-culture with ovarian cancer cells (OC) and different cell numbers of fibroblasts (fibr.). OvCar8 and Detroit 551 cells, A2780 and Detroit 551 cells were seeded stained or unstained simultaneously into ULA plate and grown for 96 h. After 96 h of growth, different read outs were performed. (B) Representative microscopic images of monocellular and co-cultivated spheroids after 96 h of growth. Scale bar 500 μm. (C) Quantitative differences in the size of spheroids after 96 h. Data in floating bar plot (line at mean), one-way ANOVA, ** (p < 0.01), *** (p < 0.001), **** (p < 0.0001). (D) Quantitative differences in the compactness of spheroids after 96 h. Data in floating bar plot (line at mean), one-way ANOVA, ** (p < 0.01), **** (p < 0.0001). (E-H) Growth over time. Representative images of OvCar8 (E) and A2780 (G) mono-cultured and co-cultured spheroids with fibroblast. Scale bar 500 μm. Quantification of spheroid size over time of OvCar8 (F) and A780 (H) monocellular and co-cultivated spheroids. Data are means ± SD, N = 3.
Fig. 3
Fig. 3
Microscopic characterisation of the structure of simultaneously seeded mono and co-cultured spheroids. OvCar8 (OC), A2780 (OC) and Detroit 551 (Fibr.) monocellular and OvCar8 and Detroit 551, A2780 and Detroit 551 multi-cellular spheroids were cultured for 96 h as described in Fig. 2A. (A) Spheroids were examined by scanning electron microscopy after 96 h of growth. Scale bar 50 μm. (B,C) Prior to cultivation, the cells were stained with fluorescence dyes in order to subsequently assign them to a cell type during cultivation. These spheroids were fixed, cleared and imaged after 96 h of growth using LSM. Red/Cell Tracker Deep Red: ovarian cancer cells; green/CellTracker Green CMFDA: fibroblasts. Scale bar 200 μm. (D, E) Histological and immunohistochemical analysis of spheroid morphology and protein expression of OvCar8 (D) and A2780 (E) spheroids after 96 h of growth. Ki-67 is a proliferation marker, while PAX8 is marker for ovarian cancer cells and fibroblast activation protein markers fibroblasts, respectively. Scale bar 200 μm.
Fig. 4
Fig. 4
Cytotoxicity and apoptosis of simultaneously seeded mono and co-cultured ovarian cancer spheroids. OvCar8 (OC), A2780 (OC) mono-cultured and co-cultured spheroids with fibroblasts (Fibr.) were cultured in ULA plates for 96 h as shown in Fig. 2A. Spheroids were treated after 72 h for 24 h with 100 µM cisplatin or PBS (A-C) Cell toxicity was measured by fluorescence microscopy using CellTox Green (timepoint 96 h after seeding). The fluorescence signals after treatment were quantified (relative fluorescence units RFU) (A: OvCar8, B: A2780). Quantitative data are means ± SEM, N = 3, one-way ANOVA, * (p < 0.05), ** (p < 0.01), *** (p < 0.001), **** (p < 0.0001). Representative images are shown (C). Scale bars, 500 μm. (D) Following cultivation, viability and caspase activity were measured after 96 h of growth (relative luminescence units RLU). Quantitative data are means ± SEM, N = 3, one-way ANOVA, **** (p < 0.0001). (E) A further cell viability assay of spheroids was performed using a live/dead staining with propidium iodide and calcein AM. Viable cells appear as green, while nonviable cells appear as red. Scale bars, 200 μm.
Fig. 5
Fig. 5
Growth kinetics of sequentially seeded co-cultured spheroids. (A) Workflow of the newly developed co-cultured spheroids with staggered seeding (with 24 h delay). OvCar8 and Detroit 551 cells, A2780 and Detroit 551 cells were seeded stained or unstained sequential (with 24 h delay) into ULA plates and grown for 96 h (from the time of the first seeding). Ovarian cancer cells were seeded first and then fibroblasts, so also vice versa (first seeded → second seeded). These reverse seeding processes were analysed and compared to each other. (B) Representative microscopic images of sequential seeded multi-cellular OvCar8-fibroblast spheroids after 96 h of growth. Scale bar 500 μm. (C) Quantitative differences in the size of different OvCar8-fibroblast spheroids after 96 h of growth. Quantitative data, t-test, *** (p < 0.001). (D) Representative microscopic images of sequential seeded multi-cellular A2780-fibroblast spheroids after 96 h of growth. Scale bar 500 μm .(E) Quantitative differences in the size of different A2780-fibroblast spheroids after 96 h. Quantitative data, t-test, * (p < 0.05), *** (p < 0.001), **** (p < 0.0001).
Fig. 6
Fig. 6
Morphological characterisation of sequential seeded co-cultured spheroids. OvCar8 and Detroit 551, A2780 and Detroit 551 co-cultured spheroids were seeded time-shifted and cultured for 96 h as described in Fig. 2A. (A,B) Spheroids were examined by scanning electron microscopy after 96 h of growth. Scale bar 50 μm. (C,D) Prior to cultivation, the cells were stained with different fluorescence dyes in order to subsequently assign them to a cell type during cultivation. These spheroids were fixed, cleared and imaged after 96 h of growth using LSM. Red/Cell Tracker Deep Red: ovarian cancer cells; green/CellTracker Green CMFDA: fibroblasts. Scale bar 200 μm. (E,F) Histological and immunohistochemical analysis of spheroid morphology and protein expression of spheroids after 96 h of growth. Ki-67 is a proliferation marker, while PAX8 is marker for tumour cells and fibroblast activation protein markers fibroblasts, respectively. Scale bar 200 μm.
Fig. 7
Fig. 7
Cytotoxicity and apoptosis of sequential seeded co-cultured ovarian cancer spheroids. OvCar8 and Detroit 551, A2780 and Detroit 551 co-cultured spheroids were seeded time-shifted and cultured for 96 h as described in Fig. 2A. Spheroids were treated after 72 h for 24 h with 100 µM cisplatin or PBS. (A,B) Cell toxicity of OvCar8-fibroblast (A) and A2780-fibroblasts (B) spheroids was measured by fluorescence microscopy using CellTox Green 24 h after treatment. Scale bars, 500 μm. The fluorescence signals after treatment were quantified (relative fluorescence units RFU). Quantitative data are means ± SEM, N = 3, t-test * (p < 0.05). (C,D) Viability and caspase activity were measured after 24 h treatmet (C: OvCar8, D: A2780) (relative luminescence units RLU). Quantitative data are means ± SEM, N = 3, t-test * (p < 0.05), ** (p < 0.01), **** (p < 0.0001). (E,F) Viable cells were stained with calcein-AM in green, while death cells appear in red by propidium iodide (E: OvCar8, F: A2780). Scale bars, 200 μm.
Fig. 8
Fig. 8
Characterisation of growth and morphology of simultaneously seeded mono and co-cultured spheroids from primary patient cells. Primary ovarian cancer cells and human peritoneal fibroblasts of the same patent were seeded stained or unstained simultaneously into ULA plate and grown for 96 h. Spheroids were cultured in mono-culture and in co-culture with ovarian cancer cells and different cell numbers of fibroblasts. After growth, various assays were performed. (A) Representative microscopic images of mono-cultured and co-cultured spheroids after 96 h of growth. Scale bar 500 μm. (B) Representative microscopic images of mono-cultured and co-cultured spheroids at 24-hour intervals. Scale bar 500 μm. (C) Quantitative differences in the size of spheroids after 96 h of growth, one-way ANOVA, * (p < 0.05). (D) Spheroid surface were analysed by scanning electron microscopy after 96 h of growth. Scale bar 50 μm. (E) Prior to cultivation, the cells were stained with different fluorescence dyes in order to subsequently assign them to a cell type during cultivation. These spheroids were then imaged after 96 h using LSM. Red/Cell Tracker Deep Red: ovarian cancer cells; green/CellTracker Green CMFDA: fibroblasts. Scale bar 200 μm.
Fig. 9
Fig. 9
Cytotoxicity and apoptosis of simultaneously seeded mono and co-cultured spheroids from primary patient cells. Primary ovarian cancer cells and human peritoneal fibroblasts of the same patient were seeded into ULA plate and grown for 96 h as described above. Spheroids were treated after 72 h for another 24 h with 100 µM cisplatin or PBS. (A, B) Cell toxicity of UF-403-co-culture spheroids was measured by fluorescence microscopy using CellTox Green 24 h after treatment. (A) The fluorescence signals after treatment were quantified (relative fluorescence units RFU). Quantitative data are means ± SEM, N = 3, one-way ANOVA, ** (p < 0.01), **** (p < 0.0001). (B) Representative microscopic images of monocellular and multicellular spheroids after CellTox Green staining. Scale bar 500 μm. (C) Viability and caspase activity were measured after 24 h treatment (relative luminescence units RLU). Quantitative data are means ± SEM, N = 3, one-way ANOVA. (D) Viable cells were stained with calcein-AM in green, while death cells were marked in red with propidium iodide. Scale bars, 200 μm.

References

    1. Sung, H. et al. Global cancer statistics 2020. CA Cancer J. Clin.71, 209–249 (2021). - PubMed
    1. Torre, L. A. et al. Ovarian cancer statistics, 2018. CA: A Cancer. J. Clin.68, 284–296 (2018). - PMC - PubMed
    1. Masoodi, T. et al. Genetic heterogeneity and evolutionary history of high-grade ovarian carcinoma and matched distant metastases. Br. J. Cancer. 122, 1219–1230 (2020). - PMC - PubMed
    1. Lawrenson, K. & Gayther, S. A. Ovarian cancer: A clinical challenge that needs some basic answers. PLoS Med.6, e25 (2009). - PMC - PubMed
    1. Kurnit, K. C., Fleming, G. F. & Lengyel, E. Updates and new options in advanced epithelial ovarian cancer treatment. Obstet. Gynecol.137, 108–121 (2021). - PMC - PubMed

LinkOut - more resources