Randomized Controlled Trial
. 2024 Oct 9;14(1):23592.
doi: 10.1038/s41598-024-73211-3.

Music therapy with adult burn patients in the intensive care unit: short-term analysis of electrophysiological signals during music-assisted relaxation

Affiliations
Randomized Controlled Trial

Music therapy with adult burn patients in the intensive care unit: short-term analysis of electrophysiological signals during music-assisted relaxation

Jose Cordoba-Silva et al. Sci Rep. .

Abstract

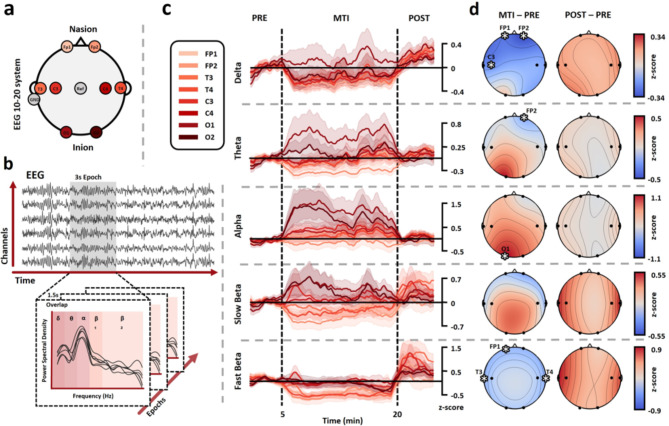
Burn patients often face elevated pain, anxiety, and depression levels. Music therapy adds to integrative care in burn patients, but research including electrophysiological measures is limited. This study reports electrophysiological signals analysis during Music-Assisted Relaxation (MAR) with burn patients in the Intensive Care Unit (ICU). This study is a sub-analysis of an ongoing trial of music therapy with burn patients in the ICU. Electroencephalogram (EEG), electrocardiogram (ECG), and electromyogram (EMG) were recorded during MAR with nine burn patients. Additionally, background pain levels (VAS) and anxiety and depression levels (HADS) were assessed. EEG oscillation power showed statistically significant changes in the delta (p < 0.05), theta (p = 0.01), beta (p < 0.05), and alpha (p = 0.05) bands during music therapy. Heart rate variability tachograms high-frequencies increased (p = 0.014), and low-frequencies decreased (p = 0.046). Facial EMG mean frequency decreased (p = 0.01). VAS and HADS scores decreased - 0.76 (p = 0.4) and - 3.375 points (p = 0.37) respectively. Our results indicate parasympathetic system activity, attention shifts, reduced muscle tone, and a relaxed state of mind during MAR. This hints at potential mechanisms of music therapy but needs to be confirmed in larger studies. Electrophysiological changes during music therapy highlight its clinical relevance as a complementary treatment for ICU burn patients.Trial registration: Clinicaltrials.gov (NCT04571255). Registered September 24th, 2020. https//classic.clinicaltrials.gov/ct2/show/NCT04571255.

Keywords: Burn patients; Electrocardiogram (ECG); Electroencephalogram (EEG); Electromyogram (EMG); Intensive care unit (ICU); Music therapy.


Conflict of interest statement

The authors declare no competing interests.

Figures

Fig. 1
Fig. 1
Frequency analysis for EEG. (a) Electroencephalogram following 10–20 international system was reduced to 8 electrodes. (b) One patient example of data segmentation into epochs of 3 s with an overlap of 1.5 s. For each epoch, power spectral analysis was performed, and the spectrum was divided into 5 frequency bands. (c) Time evolution of the power z-scores in all frequency bands is presented in rows 1 to 5, respectively (refer to the "Methods" section for frequency band range values). For each frequency band, the eight channels were plotted, with corresponding color labels displayed in the upper left corner. The colored lines represent the mean power value across all recordings for each channel in the time series. The shadow of the line corresponds to the standard error of all patients in the time series. The vertical dashed lines indicate the recording periods. (d) Topographic plots showing the changes in power spectral densities for all frequency bands are presented in rows 1 to 5, respectively. The left plot represents the average change across all patients between MTI and PRE, while the right plot represents the average change between POST and PRE. Consequently, values are relative to RPE, where increases are represented with red colors, and decreases are represented with blue colors. Significant changes (FDR corrected, p-values < 0.05) are marked with an asterisk (*) and labeled with the corresponding electrode name.
Fig. 2
Fig. 2
Time, Non-linear, and frequency analysis for ECG. (a) ECG example of artifact remotion and R peak detection. (b) Tachogram extraction example for patient 3 session 1. R-R time segments were computed in the time series, miss detections were excluded, and then interpolated. (c) Normalized Poincaré plot for PRE, MTI, and POST for all patients. Confidence ellipses were plotted with SD1 as perpendicular radius and SD2 as parallel radius to the identity lines, represented by dashed lines. (d) Power spectral density plots average across all patients for PRE, MTI, and POST. The three plots are logarithmic scale and share the same axes. (e) Boxplots to compare PRE, MTI, and POST. The plots are arranged from top to bottom as follows: LF, HF, and the LF/HF ratio. Black lines at the top indicate significant differences between periods (*p-value < 0.05, **p-value < 0.01).
Fig. 3
Fig. 3
Amplitude and frequency analysis for EMG. (a) EMG example for patient 3 sessions data segmentation into epochs of 2 s with an overlap of 1 s (b) Time evolution of all patients average RMS calculated for each epoch. The shadow of the line corresponds to the standard error of all patients in the time series. (c) For each epoch, power spectral analysis was performed, and the mean frequency was calculated. (d) EMG average normalized power spectral density across all patients for PRE, MTI, and POST. The average mean frequency across patients is marked with a black line. The behind shadow plot represents another period power spectral analysis. The three plots share the same axes. (e) Box plots summarizing the distribution of MNF and RMS values obtained from individual recordings during the MT intervention. Black lines indicate significant differences between periods (*p-value < 0.05, **p-value < 0.01).

References

    1. World Health Organization. Burns [Internet]. 2018 [cited 2023 Aug 31]. https://www.who.int/en/news-room/fact-sheets/detail/burns.
    1. Logsetty, S. et al. Mental health outcomes of burn: A longitudinal population-based study of adults hospitalized for burns. Burns 42, 738–44 (2016). - PubMed
    1. Jeschke, M. G. et al. Burn injury. Nat. Rev. Dis. Primers 6, 11 (2020). - PMC - PubMed
    1. Pavoni, V., Gianesello, L., Paparella, L., Buoninsegni, L. T. & Barboni, E. Outcome predictors and quality of life of severe burn patients admitted to intensive care unit. Scand. J. Trauma Resusc. Emerg. Med. 18, 24 (2010). - PMC - PubMed
    1. Woo, A. K. Depression and anxiety in Pain. Rev. Pain 4, 8–12 (2010). - PMC - PubMed

Publication types

Associated data