. 2024 Oct 9;8(1):228.
doi: 10.1038/s41698-024-00716-5.

Single cell analysis revealed SFRP2 cancer associated fibroblasts drive tumorigenesis in head and neck squamous cell carcinoma

Affiliations

Single cell analysis revealed SFRP2 cancer associated fibroblasts drive tumorigenesis in head and neck squamous cell carcinoma

Qiwei Wang et al. NPJ Precis Oncol. .

Abstract

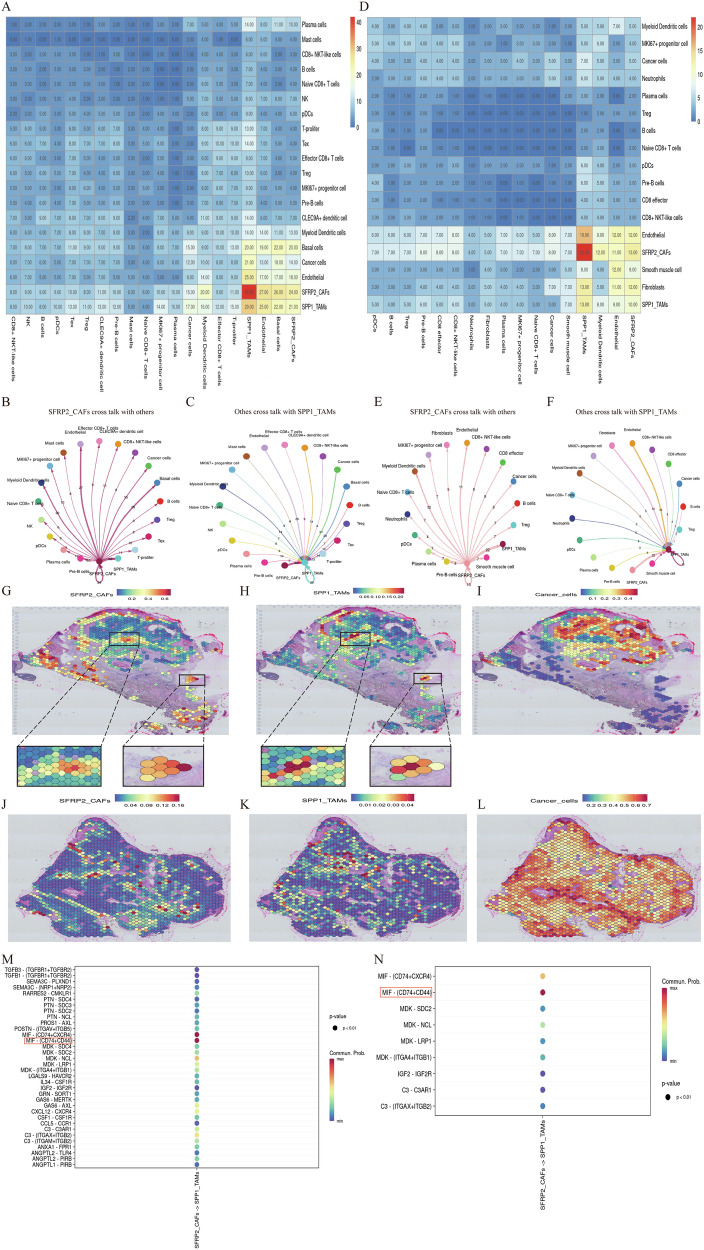
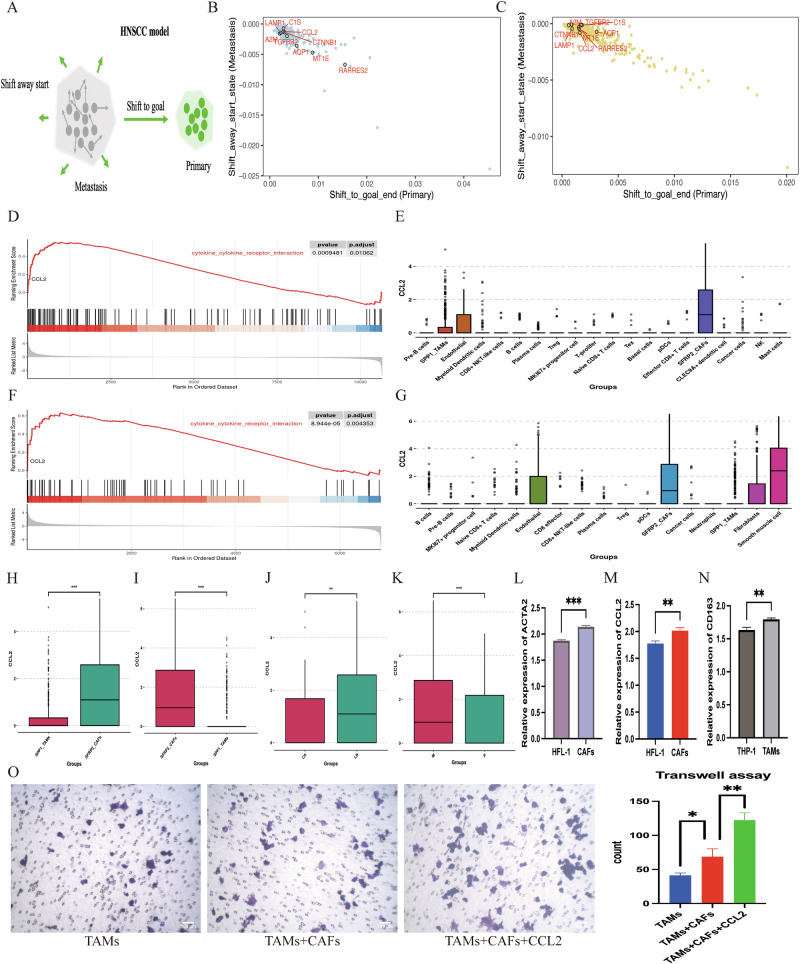
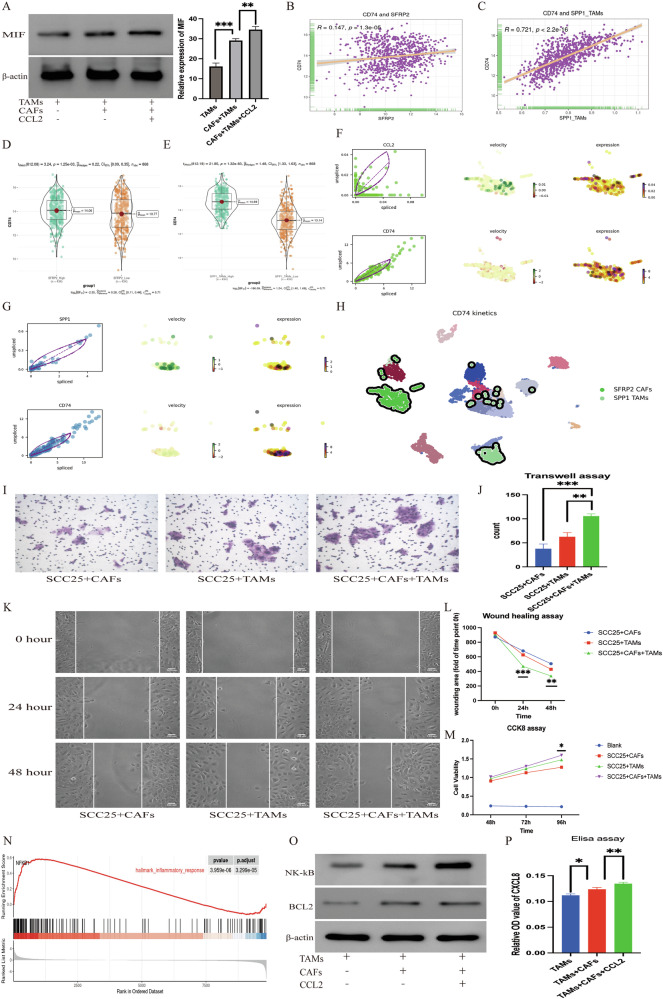
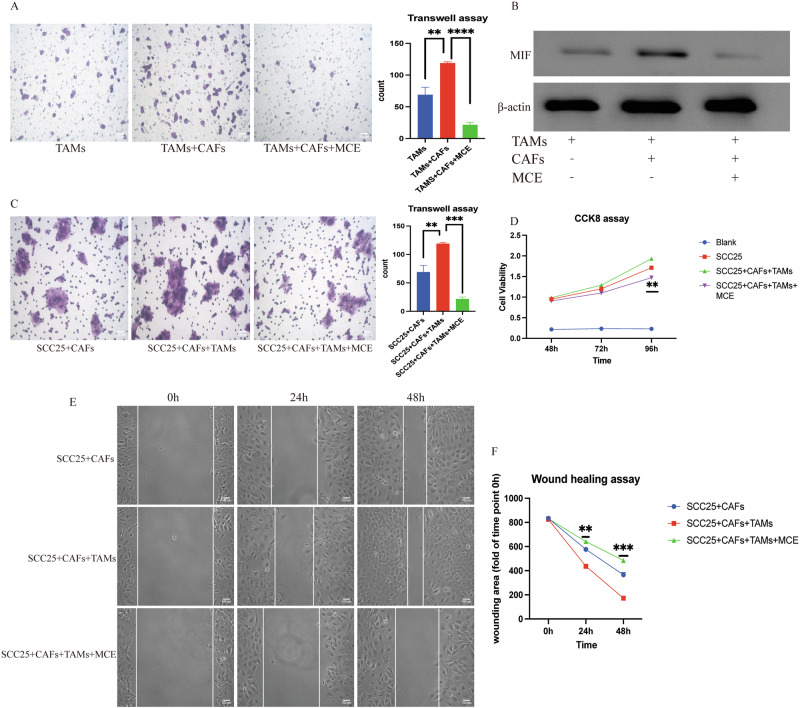
Understanding the mechanisms of invasion and metastasis in head and neck squamous cell carcinoma (HNSCC) is crucial for effective treatment, particularly in metastatic cases. In this study, we analyzed multicenter bulk sequencing and comprehensive single-cell data from 702,446 cells, leading to the identification of a novel subtype of cancer-associated fibroblasts (CAFs), termed Secreted Frizzled-Related Protein2 CAFs (SFRP2_CAFs). These cells, originating from smooth muscle cells, display unique characteristics resembling both myofibroblastic CAFs and inflammatory CAFs, and are linked to poorer survival outcomes in HNSCC patients. Our findings reveal significant interactions between SFRP2_CAFs and SPP1 tumor-associated macrophages, which facilitate tumor invasion and metastasis. Moreover, our research identifies Nuclear factor I/X (NFIX) as a key transcription factor regulating SFRP2_CAFs behavior, confirmed through gene regulatory network analysis and simulation perturbation.


Conflict of interest statement

The authors declare no competing interests.

Figures

Fig. 1
Fig. 1. SFRP2_CAFs contribute to the poor clinical outcome of HNSCC.
A In the study of HNSCC single-cell dataset GSE181919, 20 distinct cell types were identified. B In another HNSCC single-cell dataset GSE188737, 17 distinct cell types were identified. C UMAP representation highlighting the starting cell (blue) with the lowest SFRP2 expression (left), the terminal cells (red) as predicted by Palantir in GSE188737 (median) and cell type annotation (right). D Velocities derived from the dynamical model for GSE188737 HNSCC single cell dataset are visualized as streamlines in a UMAP-based embedding. E Seven Ecotyper-Fibroblast subtypes were identified, with three subtypes significantly associated with multivariate cox analysis (Fibroblast_S03, p = 0.02124; Fibroblast_S01, p = 0.00455; and Fibroblast_S08, p = 0.00333). FH Correlation analysis revealed a significant association between SFRP2, SFRP2_CAFs, and Ecotyper-Fibroblasts_S03 (R = 0.75, p < 2.2e−16, R = 0.823, p < 2.2e−16, R = 0.809, p < 2.2e−16). E Three subtypes significantly associated with multivariate cox analysis (Fibroblast_S03, p = 0.02124; Fibroblast_S01, p = 0.00455; and Fibroblast_S08, p = 0.00333). IL Elevated expression of SFRP2 was consistently associated with poor overall survival across different datasets (meta; p = 0.019, HR = 0.75, 95% CI = 0.6–0.96. TCGA-HNSC; p = 0.002, HR = 0.56, 95% CI = 0.38–0.81. GSE65858; p = 0.035, HR = 0.72, 95% CI = 0.53–0.98. GSE41613; p = 0.022, HR = 0.28, 95% CI = 0.09–0.9). M Gene Set Enrichment Analysis (GSEA) analysis revealed high expression of SFRP2 associated with myogenesis, angiogenesis, and epithelial-mesenchymal transition pathways activated.
Fig. 2
Fig. 2. Cross-talk between SFRP2_CAFs and SPP1_TAMs are major contributors to the tumor microenvironment of HNSCC metastatic lesions.
AC In GSE181919, cell communication revealed that SFRP2_CAFs and SPP1_TAMs play a dominant role in the tumor microenvironment of HNSCC metastases (the “communication score” between SFRP2_CAFs and SPP1_TAMs = 42, much higher than the “communication score” between any other pair of cells). Moreover, SFRP2_CAFs are the most active cell type in signaling within the entire microenvironment, while SPP1_TAMs are the most responsive cell type. DF The same phenomenon was observed in single-cell data from GSE188737. GI Spatial plots showed cell abundance and location of selected cell types estimated by RCTD deconvolution in invasive regions of the tumor. They are SFRP2_CAFs, SPP1_TAMs and Cancer cells. JL Spatial plots showed cell abundance and location of selected cell types estimated by RCTD deconvolution in the inner regions of the tumor. M, N The communication between SFRP2_CAFs and SPP1_TAMs are primarily mediated through the MIF-CD74 ligand-receptor interaction in both GSE181919 and GSE188737.
Fig. 3
Fig. 3. SFRP2_CAFs secrete chemokine CCL2 to recruit SPP1_TAMs.
A Using the Geneformer fine-tuned module to distinguish between metastatic and primary cells in HNSCC. The embedding positions of cellular states are defined. Subsequently, silico deletion or activation of random genes is carried out to determine which gene alterations would cause cellular states from metastatic site (gray cloud) to lean towards the primary site (green cloud). B After silico knockout, cellular embedding shows a negative value indicating movement away from the metastatic foci state and a positive value indicates movement towards the primary foci state. The positions of RARRES2, MT1E, AQP1, TGFBR2, CTNNB1, C1S, LAMP1, A2M, and CCL2 among the 402 silico targets in GSE188737. C The positions of RARRES2, MT1E, AQP1, TGFBR2, CTNNB1, C1S, LAMP1, A2M, and CCL2 among the 430 silico targets in GSE234933. D CCL2 exhibited a significant positive regulatory effect of cytokine-cytokine-receptor signaling pathways in SFRP2_CAFs, GSE181919, p = 0.00009481. E CCL2 expression in all cell types of GSE181919. F CCL2 exhibited a significant positive regulatory effect of cytokine-cytokine-receptor signaling pathways in SFRP2_CAFs, GSE188737, p = 8.944e−05. G CCL2 expression in all cell types of GSE188737. H, I CCL2 expression in SFRP2_CAFs and SPP1_TAMs within GSE181919 and GSE188737. J CCL2 expression in CA (the primary tumor site) and LN (the metastatic tumor site) within GSE181919. K CCL2 expression in M (the metastatic tumor site) and P (the primary tumor site) within GSE188737. L, M Bar graph displaying the expression of ACTA2 and CCL2 in HFL-1 and CAFs. N Bar graph displaying the expression of CD163 in THP-1 and TAMs. O (Left) The transwell assay results of the TAM recruitment experiment showed CAFs could secrete CCL2 to enhance the recruitment of TAMs. (Right) The cell counting for transwell assay. P value = (* <0.05; ** <0.01; *** <0.001, **** <0.0001).
Fig. 4
Fig. 4. CCL2 enhances the interaction between MIF-CD74 receptor ligands present on CAFs and TAMs, thereby increasing tumor-promoting abilities of HNSCC.
A (left) The western blotting results of MIF across three groups. (right) The graphical representation of the western blotting results. B The correlation (R = 0.147, p = 1.3e−05) between CD74 and SFRP2 in meta cohort. C The correlation (R = 0.721, p < 2.2e−16) between CD74 and SPP1_TAMs in meta cohort. D CD74 expression in the meta cohort’s high and low SFRP2 expression groups (p = 1.25e−03). E CD74 expression in the meta cohort’s high and low SPP1_TAMs expression groups (p = 1.32e−83). F CCL2 and CD74 as SFRP2_CAFs putative driver genes (left) are identified by high likelihoods. Phase portraits of temporal dynamics along latent time (median) and expression (right) for these driver genes characterize their activity. G SPP1 and CD74 as SPP1_TAMs putative driver genes (left) are identified by high likelihoods. Phase portraits of temporal dynamics along latent time (median) and expression (right) for these driver genes characterize their activity. H CD74 kinetics in all cell types showed only a unique and exclusive similarity between SFRP2_CAFs and SPP1_TAMs. I (left) The transwell assay results showed remarkable enhancement in the invasive capacity of HNSCC cells when co-cultured with CAFs and TAMs. J The cell counting for transwell assay. K The wound healing assay results showed remarkable variations in the migration capacity of HNSCC cells when co-cultured with CAFs and TAMs. L The wounding area for wound healing assay. M The CCK8 assay results showed remarkable enhancement in the cytotoxicity capacity of HNSCC cells when co-cultured with CAFs and TAMs. N NF-κB exhibited a significant positive regulatory effect of immune response signaling pathways in TAMs, p = 3.959e−06. O The western blotting results of NF-κB and BCL2 across three groups. P The Elisa results of CXCL8 across three groups. P value = (* <0.05; ** <0.01; *** <0.001, **** <0.0001).
Fig. 5
Fig. 5. Inhibiting CCL2 leads to a decrease in MIF expression and attenuates the invasive and metastatic abilities of HNSCC.
A (Left) The transwell assay results of the TAM recruitment experiment showed CCL2-CCR2 inhibitor MCE could mitigates the recruitment of TAMs induced by the secretion of CCL2 from CAFs. (Right) The cell counting for transwell assay. B The western blotting results of MIF across three groups. C (Left) The transwell assay results demonstrated that MCE effectively reverses the invasive capacity of HNSCC cells when co-cultured with CAFs and TAMs. (Right) The cell counting analysis further supported these findings. D The CCK8 assay results showed MCE reduces the heightened viability of HNSCC cells when co-cultured with CAFs and TAMs. E (Left) The wound healing assay results showed MCE could mitigate the increased migratory capacity of HNSCC cells induced by the co-culture of CAFs and TAMs. F The wounding area for wound healing assay. P value = (* <0.05; ** <0.01; *** <0.001, **** <0.0001).
Fig. 6
Fig. 6. The CCL2 expression in SFRP2_CAFs may be regulated by NFIX.
A SCENIC transcription factors correlation and clustering results showed 12 distinct modules labeled as M1-12 in GSE181919. B The UMAP embedding plot for M1 module in GSE181919. C Integrating the JASPAR database with the SCENIC results revealed 36 common transcription factors in GSE181919. D The UMAP embedding plot for SFRP2_CAFs annotation and NFIX in GSE181919. E SCENIC transcription factors correlation and clustering results showed 14 distinct modules labeled as M1-14 in GSE188737. F The UMAP embedding plot for M1 module in GSE188737. G Integrating the JASPAR database with the SCENIC results revealed 37 common transcription factors in GSE188737. H The UMAP embedding plot for SFRP2_CAFs annotation and NFIX in GSE188737. I Dot plot of CCL2 features according to the GSE181919 cell types, the scaled mean expression value within each cell type, visualized by dot color; the dot size represents the fraction of cells in the cluster with corresponding values. J Dot plot of CCL2 features according to the GSE188737 cell types, the scaled mean expression value within each cell type, visualized by dot color; the dot size represents the fraction of cells in the cluster with corresponding values. K The correlation (R = 0.304, p = 3.38e−12) between CCL2 and NFIX in TCGA-HNSC cohort. L The bar graph demonstrates that the transfection efficiency of siNFIX is excellent in CAFs. M, N The qPCR and western blot results indicate alterations in the expression levels of CCL2 following the siNFIX perturbation. P value = (* <0.05; ** <0.01; *** <0.001, **** <0.0001).
Fig. 7
Fig. 7. Transcription factor NFIX perturbation regulate the identity of SFRP2_CAFs.
A CCL2 gene’s network score in GSE181919. Note: degree centrality is defined as the number of links incident upon gene nodes; betweenness centrality quantifies a gene node acts as a bridge along the shortest path between two other gene nodes, eigenvector centrality is defined as relative scores to all nodes in the network based on the concept that connections to high-scoring gene nodes contribute more to the score of the gene node in question than equal connections to low-scoring gene nodes. Weight is calculated by the R package Igraph. B NFIX gene’s network score in GSE181919. C CellOracle simulation cell-state transitions in the NFIX knockout (KO) simulation; The resulting cell-state transition vectors were summarized and projected onto a force-directed graph; red box; GSE181919. D CCL2 gene’s network score in GSE188737. E NFIX gene’s network score in GSE188737. F CellOracle simulation cell-state transitions in the NFIX knockout (KO) simulation; The resulting cell-state transition vectors were summarized and projected onto a force-directed graph; red box; GSE188737. G CCL2 gene’s network score in GSE234933. H NFIX gene’s network score in GSE234933. I CellOracle simulation cell-state transitions in the NFIX knockout (KO) simulation; The resulting cell-state transition vectors were summarized and projected onto a force-directed graph; red box; GSE234933.
Fig. 8
Fig. 8. Workflow of this study.
We crafted Fig. 8 utilizing Adobe Illustrator 2023 and Servier Medical Art (https://smart.servier.com). The picture unveiled the presence of SFRP2_CAFs in HNSCC, which secrete CCL2 to recruit SPP1_TAMs. These interactions are mediated by MIF-CD74, thereby facilitating tumor invasion, metastasis, apoptosis resistance and immune evasion. The transcription factor NFIX is identified as a key regulatory factor for SFRP2_CAFs.

References

    1. Ferlay, J. et al. Estimating the global cancer incidence and mortality in 2018: GLOBOCAN sources and methods. Int J. Cancer144, 1941–1953 (2019). - PubMed
    1. Sung, H. et al. Global Cancer Statistics 2020: GLOBOCAN Estimates of Incidence and Mortality Worldwide for 36 Cancers in 185 Countries. CA Cancer J. Clin.71, 209–249 (2021). - PubMed
    1. Binnewies, M. et al. Understanding the tumor immune microenvironment (TIME) for effective therapy. Nat. Med24, 541–550 (2018). - PMC - PubMed
    1. Chhabra, Y. & Weeraratna, A. T. Fibroblasts in cancer: Unity in heterogeneity. Cell186, 1580–1609 (2023). - PMC - PubMed
    1. Peltanova, B., Raudenska, M. & Masarik, M. Effect of tumor microenvironment on pathogenesis of the head and neck squamous cell carcinoma: a systematic review. Mol. Cancer18, 63 (2019). - PMC - PubMed

LinkOut - more resources