. 2024 Nov;10(11):1801-1813.
doi: 10.1038/s41477-024-01812-x. Epub 2024 Oct 9.

A promiscuous mechanism to phase separate eukaryotic carbon fixation in the green lineage

Affiliations

A promiscuous mechanism to phase separate eukaryotic carbon fixation in the green lineage

James Barrett et al. Nat Plants. 2024 Nov.

Abstract

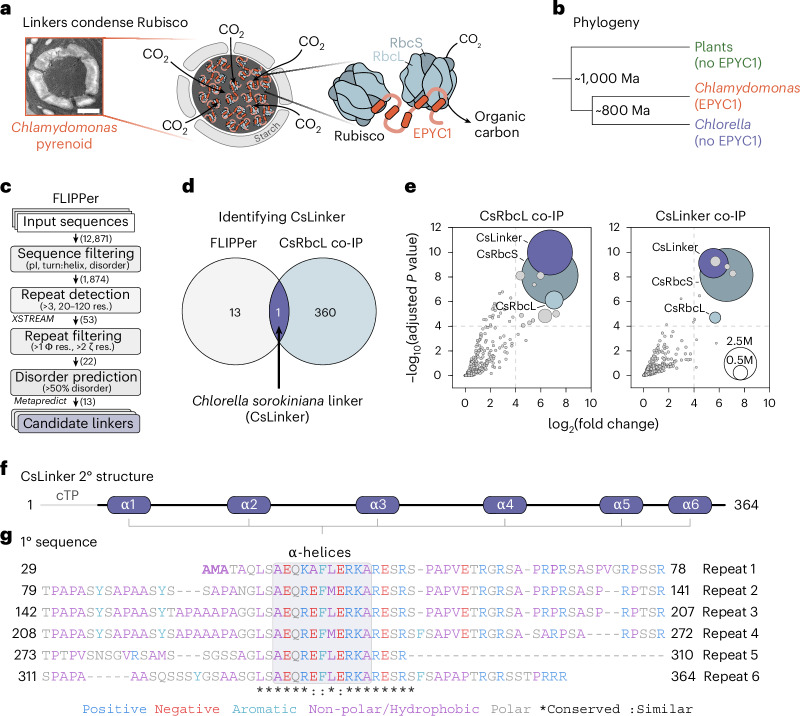
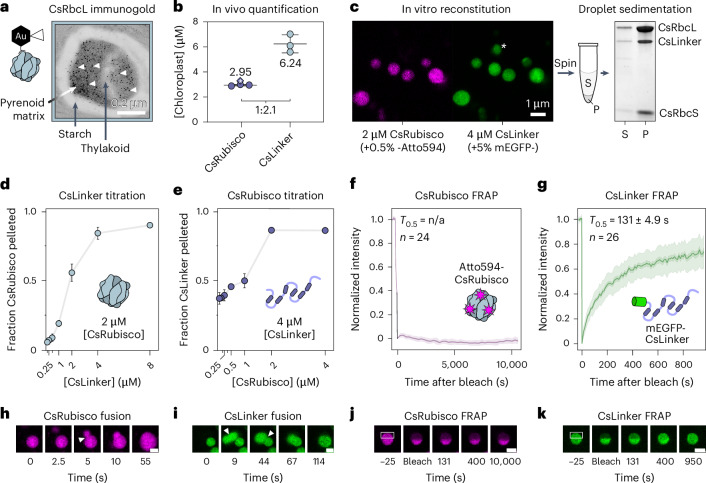
CO2 fixation is commonly limited by inefficiency of the CO2-fixing enzyme Rubisco. Eukaryotic algae concentrate and fix CO2 in phase-separated condensates called pyrenoids, which complete up to one-third of global CO2 fixation. Condensation of Rubisco in pyrenoids is dependent on interaction with disordered linker proteins that show little conservation between species. We developed a sequence-independent bioinformatic pipeline to identify linker proteins in green algae. We report the linker from Chlorella and demonstrate that it binds a conserved site on the Rubisco large subunit. We show that the Chlorella linker phase separates Chlamydomonas Rubisco and that despite their separation by ~800 million years of evolution, the Chlorella linker can support the formation of a functional pyrenoid in Chlamydomonas. This cross-species reactivity extends to plants, with the Chlorella linker able to drive condensation of some native plant Rubiscos in vitro and in planta. Our results represent an exciting frontier for pyrenoid engineering in plants, which is modelled to increase crop yields.


Conflict of interest statement

Competing interests The authors declare no competing interests.

Figures

Fig. 1
Fig. 1. Identification of the Chlorella sorokiniana linker protein (CsLinker).
a, TEM of the Chlamydomonas reinhardtii pyrenoid (n = 1, single observation), with adjacent schematic of Rubisco condensation in the pyrenoid by interaction of EPYC1 helices with the Rubisco small subunits (RbcSs). Condensed Rubisco fixes CO2 to organic carbon. Scale bar, 1 μm. b, Phylogeny of Chlamydomonas, Chlorella and plants. Estimated divergence points from a time-calibrated phylogeny. c, Schematic representation of FLIPPer used to identify candidate linkers that share features with EPYC1. Where relevant, the programme used is indicated. The number of sequences remaining after each filtering step of the Chlorella sorokiniana UTEX1230 genome is indicated. pI, isoelectric point; res., residue; Φ, hydrophobic; ζ, electrostatic. d, Venn diagram demonstrating identification of CsLinker from FLIPPer and CsRbcL co-immunoprecipitation followed by mass spectrometry (co-IP). e, Reciprocal co-IP experiments performed using antibodies raised to the Rubisco large subunit (left) and CsLinker (right). Dashed lines indicate arbitrary significance thresholds (−log10[adjusted P value] > 4, log2[fold change] > 4), above which points are sized according to their summed intensity (M, millions) following the inset key, from 3 biological replicates. f, Predicted secondary structure of CsLinker from AlphaFold modelling (Supplementary Fig. 1). The predicted chloroplast transit peptide (cTP) and α-helices (α1–6) are indicated. g, Primary sequence alignment of the six repeat regions of CsLinker, coloured by residue property.
Fig. 2
Fig. 2. CsLinker phase separates Rubisco at physiological conditions.
a, Representative immunogold TEM of the Chlorella pyrenoid after primary incubation with the RbcL antibody. A subset of gold nanoparticles are indicated by white arrowheads. b, Absolute quantification of CsRubisco holoenzyme (derived from CsRbcL) and CsLinker in vivo (n = 3). The ratio between CsRubisco and CsLinker is indicated at the bottom (see Supplementary Fig. 6 for details). Mean ± s.d. of 3 biological replicates. The asterisked point indicates the independent quantification from western blotting (Supplementary Fig. 2b). c, Left: confocal fluorescence microscopy image of droplets in the in vitro reconstitution of the Chlorella pyrenoid formed at concentrations of CsRubisco and CsLinker close to that of the chloroplast (2 μM and 4 μM, respectively). Asterisk indicates a droplet that settled between imaging of the two channels. Atto594-CsRubisco and mEGFP-CsLinker were incorporated at 0.5% and 5% molar concentrations, respectively. Single, non-repeated observation. Right: droplets can be sedimented by centrifugation and the composition of the pellet (P) relative to the supernatant (S) analysed by SDS–PAGE (repeated observation; see Supplementary Figs. 8 and 9). This experiment format was used to generate datapoints in d and e. d, Titration droplet sedimentation assays with fixed CsRubisco concentration. e, Titration droplet sedimentation assays with fixed CsLinker. Where visible in d and e, data are mean ± s.d. of 2 technical replicate experiments completed concurrently (Supplementary Fig. 7b,c). f, Average full-scale normalized half-FRAP recovery curve of Atto594-CsRubisco in droplets formed as in c. g, Average full-scale normalized half-FRAP recovery curve of mEGFP-CsLinker in droplets with the same composition. In f and g, the mean, s.e.m. and s.d. of the indicated number of technical replicates are represented by the line, the smaller shaded region and the larger shaded region, respectively. h, Time series of 0.5% (molar ratio) Atto594-CsRubisco-labelled droplets formed as in c, undergoing fusion (arrowhead) and relaxation. i, 5% mEGFP-CsLinker-labelled droplets undergoing consecutive fusions. j, Time series of a representative CsRubisco FRAP experiment, as quantified in f. The white box indicates the region bleached. k, Representative CsLinker FRAP experiment, as quantified in g. Scale bars for hk, 1 μm. All in vitro droplet experiments in ck were completed in a 50 mM Tris-HCl pH 8.0, 50 mM NaCl buffer. Source data
Fig. 3
Fig. 3. CsLinker binds to the RbcL.
a, α3–α4 forms a stable complex with CsRubisco. Representative native PAGE gel-shift assay (left) demonstrating formation of higher-order α3–α4–CsRubisco complex in a 50 mM Tris-HCl pH 8.0, 50 mM NaCl buffer. Mean ± s.d. of 2 technical replicate experiments completed independently (right) taken from Supplementary Fig. 10h. b, Schematic of SPR experiments (left) used to determine binding affinity of α3 and α3–α4 for CsRubisco (right). SPR response normalized to Bmax value obtained from fit of raw data; n = 3; error bars, s.d. c, Top (left) and side (right) views of surface representations of cryo-EM determined structure of the α3–α4–CsRubisco complex. The modelled α-helix of α3 is superimposed on each CsRbcL on the basis of the coordinates built into one axis of the C1 map, as shown in d. d, Density map of the α3–α4 region in the C1 complex map, carved with a radius of 2 from the built coordinates, at a contour level of 0.033. e, Molecular interactions at the interface. Shortest range electrostatic interactions highlighted by PDBePISA (left) and residues contributing to the hydrophobic interface (right). The surface of CsRbcL is coloured according to hydrophobicity. Residues are numbered according to their position in the full-length CsLinker. f, Map of the interactions between the α-helices of α3–α4 and the two interfaces on CsRbcL. Dashes indicate salt bridges, wedges represent significant contributions to the hydrophobic interface, with italicized and bolded residues contributing the same interfaces, respectively. g, Native PAGE gel-shift assays showing that mutation of α3–α4 disrupts binding to CsRubisco. The sequence of the α-helices in each fragment is provided above each image. From a single, non-repeated observation. Source data
Fig. 4
Fig. 4. CsLinker can functionally replace EPYC1 in the Chlamydomonas pyrenoid.
a, Alignment of the CsLinker-binding interface sequences from Chlorella (Cs) RbcL and the equivalent region of the Chlamydomonas (Cr) RbcL. Interacting residues are shown in black and stylized by interaction type according to Fig. 3f. Conserved residues are indicated by asterisks. b, Confocal fluorescence microscopy image of droplets formed with Chlamydomonas Rubisco (CrRubisco) and EPYC1, in which 5% (molar ratio) of the EPYC1 was GFP tagged (E-GFP). Scale bar, 5 μm. c, Confocal fluorescence microscopy image of WT Chlamydomonas (CC-4533) expressing EPYC1-Venus and CrRbcS-mCherry. Scale bar, 2 μm. d, Left: growth phenotype of WT Chlamydomonas grown on TP minimal media under elevated (3%) and ambient (Air) levels of CO2. Right: schematic representation of the pyrenoid. e, Confocal fluorescence microscopy image of CrRubisco alone. Scale bar, 5 μm. f, Confocal fluorescence microscopy image of ΔEPYC1 Chlamydomonas strain expressing CrRbcS-mCherry. Scale bar, 2 μm. g, Left: growth phenotype of ΔEPYC1 Chlamydomonas strain. Right: schematic representation of pyrenoid region. h, Droplets formed with Chlamydomonas Rubisco (CrRubisco) and CsLinker, in which 5% (molar ratio) of the CsLinker was GFP tagged (CsL-GFP). Scale bar, 5 μm. i, Confocal fluorescence microscopy image of ΔEPYC1 Chlamydomonas strain expressing CrRbcS-mCherry and mVenus-CsLinker. Scale bar, 2 μm. j, Left: growth phenotype of ΔEPYC1 Chlamydomonas strain complemented with untagged CsLinker. Right: schematic representation of pyrenoid. Results in b and h were observed on multiple independent occasions (see Extended Data Fig. 8), as were results in c, f and i (see Extended Data Fig. 6 and Supplementary Fig. 19). The result in e was from a single, non-repeated observation.
Fig. 5
Fig. 5. CsLinker condenses native plant Rubisco in vitro and in planta.
a, Alignment of the CsLinker-binding interface sequences from algal and plant RbcLs. Interacting residues are shown in black and stylized by interaction type according to Fig. 3f. Substitutions of interacting residues are shown in red. b, Confocal fluorescence microscopy images of droplets formed with different Rubiscos and either CsLinker or EPYC1. c, Images of droplets formed with Solanaceae Rubisco and either CsLinker or EPYC1. Scale bars in b and c, 5 μm. Results in b and c were from single, non-repeated observations. d, Confocal fluorescence microscopy images of CsLinker-tGFP and NbRbcS-mCherry transiently expressed in N. benthamiana chloroplasts, condensed into Rubisco puncta in planta. Results in d were from multiple repeated observations (see Extended Data Fig. 10).
Extended Data Fig. 1
Extended Data Fig. 1. Low CO2 inducibility of CsLinker.
a, Differential gene expression analysis completed using publicly available RNA-seq data (PRJNA343632) comparing transcript abundance at high CO2 (5%) and 30 minutes after switching to 0.01% CO2 culture conditions. Homologues of low CO2 induced CCM genes in Chlamydomonas are indicated alongside CsLinker. b, Western blot analysis of CsLinker and CsRbcL protein abundance under low (0.04%) and high (3%) CO2 conditions. Tubulin was used as a loading control on the same blot, and detected with a separate secondary antibody. This observation was from a single, non-repeated experiment.
Extended Data Fig. 2
Extended Data Fig. 2. Localization of CsRubisco and CsLinker in the pyrenoid.
a, Protocol used for the enrichment of pyrenoids from Chlorella cells. Fractions are labelled according to their analysis in b. b, Western blot analysis of CsRbcL and CsLinker in fractions throughout pyrenoid enrichment. The membrane was cut following Ponceau staining and incubated separately with the indicated primary antibodies. The granule-bound starch synthase (CSI2_123000003711, 59.7 kDa homolog of STA2 from Chlamydomonas) is putatively annotated as a major component of pyrenoid starch, visible in the Coomassie and Ponceau panels. c, Immunofluorescence localization of CsRbcL in pyrenoid-enriched fractions. Confocal microscopy images of immunolabelled fraction ‘9’ from panels d/e. The immunofluorescent signal from CsRbcL is present within the surrounding starch sheath, indicating a pyrenoid matrix localization. d, Immunofluorescence localization of CsLinker in pyrenoid-enriched fractions. Although the degree of labelling is lower due to the poorer antigenicity of the primary antibody, the localization pattern is again consistent with the pyrenoid matrix. e, Confocal microscopy image of the unlabeled pyrenoid-enriched fraction, showing a lack of signal. f, Confocal microscopy image of pyrenoid-enriched fractions immunolabelled with both RbcL and Tubulin primary antibodies, detected with separate secondary antibodies. The low level of non-specific fluorescence from the Tubulin antibody does not co-localize with the RbcL signal, indicating specific labelling by the RbcL and CsLinker antibodies in panels g and h. All results were obtained from a single non-repeated pyrenoid-enrichment protocol of a single biological replicate.
Extended Data Fig. 3
Extended Data Fig. 3. FRAP analysis of Chlorella and Chlamydomonas in vitro reconstitutions.
a, Average FRAP recovery curve from whole FRAP experiments completed according to reference images adjacent where the bleach region is indicated by the box and the scale bar = 1 μm. The arrow highlights recovery of the signal from the periphery of the droplet, indicating external exchange. The standard error of the T0.5 is indicated in the plot and the dashed lines indicate the T0.5 on the plot. b, Correlation of T0.5 with the area of the bleached region in whole and half FRAP experiments of CsLinker, explaining the longer T0.5 in whole FRAP experiments. c, Variance of T0.5 values derived from individual fits of recovery curves. Errors bars represent standard error of the mean for n = 24, 6, 14 and 10 technical replicate measurements in each sample respectively. d, Average half FRAP recovery curve of Atto594-CrRubisco in the Chlamydomonas reconstitution. e, Average half FRAP recovery curve of EPYC1-mEGFP in the Chlamydomonas reconstitution In panels a, b, d and e the mean, S.E.M and S.D. of the indicated number of technical replicates are represented by the line, the smaller shader region, and the larger shaded region respectively.
Extended Data Fig. 4
Extended Data Fig. 4. Cryo-EM data processing of the D4 map (PDB: 8Q04).
a, 2D classes after manual picking of 465 particles, used for autopicking from all grids. b, Representative micrograph shown without (left) and with (right) autopicked particles (green circles). Autopicking resulted in 237,035 particles that were used in subsequent 2D classification. c, Selected 2D classes after classification, resulting in 224,593 particles that were used for 3D classification. d, Top view of the five 3D classes following classification, shown at the same contour level (0.01). Class 3 was used for subsequent refinements to create the final D4 map. Arrows indicate the regions of additional low resolution density at the equator of Rubisco. e, Post-processed map following refinement of class 3 with C1 symmetry imposed during refinement. f, Post-processed map following refinement with D4 symmetry. Maps in e and f are shown at a contour level of 0.032. g, Post-processed map following CTF refinement and Bayesian polishing with D4 symmetry imposed during refinement. The map is displayed at a contour level of 0.0553. h, Phenix local resolution estimate for the D4 CsRubisco map. i, Example density of residues 238–245 of the CsRbcL with the corresponding model coordinates, carved with a radius of 2 at a contour level of 0.0415. j, Overlay of cryo-EM structures of Rubisco from Chlorella solved in this study and from Chlamydomonas reinhardtii solved in a previous study. k, Fourier shell correlation (FSC) curve showing the resolution estimate for the D4 refined map with FSC cut-off of 0.143 (dashed lines).
Extended Data Fig. 5
Extended Data Fig. 5. Cryo-EM data processing of the α3-α4-CsRubisco map (PDB: 8Q05).
a, Sharpened (B-factor: 45) post-processed map of the C1 symmetry-refined α3-α4-CsRubisco complex using the D4 symmetry expanded particle dataset. The soft featureless mask used for the classification is shown in purple, over the region of additional density, into which the predicted helix of α3 is built. Shown at a contour level of 0.0496. The 3D class (class 3) from which the particle dataset was D4 symmetry expanded is shown inset, and the mask is schematically represented over a region of additional density. b, C1 symmetry 3D classification of sub-particles using the soft featureless mask. The selected class with α3-α4 density is shown in blue, with the discarded classes in grey below. At this resolution, the density shows clearly helical nature. c, Second round of 3D classification using the selected sub-particles from the first round. The selected sub-particles from this round were used for reconstruction of the α3-α4-CsRubisco map. d, Phenix local resolution estimate of the α3-α4-CsRubisco map, shown at a contour level of 0.0293. e, Map density of the α3-α4 region in the unsharpened, post-processed C1, symmetry expanded map shown at contour level 0.0293 (top), and the unsharpened, post-processed D4, non-symmetry expanded map, shown at a contour level of 0.0174. Both maps are carved with a radius of 2 around the modelled helical region. f, Histogram showing the distribution of α3-α4 occupancy in the sub-particles of the particles used for the reconstruction of the α3-α4-CsRubisco map. g, Fourier shell correlation (FSC) curve showing the resolution estimate for the α3-α4-CsRubisco map with FSC cut-off of 0.143 (dashed lines). h, Model of α3-α4 in the density displayed with the side chains of residues with no density support displayed in green (top) and removed in the final coordinates (bottom). i, Coordinates at the α3-α4-CsRubisco interface displayed in the map density at a contour level of 0.0304 and carved with a radius of 2. j, Nomenclature of RbcL regions at the α3-α4-CsRubisco interface. k, A potential hydrogen bond network between Gln170 of α3-α4 and Glu93 and Gln95 of the CsRbcL CD loop shown with and without map density shown at a contour level of 0.0396. l, α3-α4-CsRubisco interaction map.
Extended Data Fig. 6
Extended Data Fig. 6. CsLinker expression recovers pyrenoid formation in ΔEPYC1 Chlamydomonas.
a, Example of Rubisco partitioning calculation using integrated density analysis in Fiji, according to ref. . b, Rubisco partitioning in the condensate in the WT (CrRbcS-mCherry/EPYC1-Venus), ΔEPYC1 (CrRbcS-mCherry) and ΔEPYC1 (CrRbcS-mCherry/CsLinker) lines, quantified from the images in e and Supplementary Fig. 15 using the method outlined in a. Statistical significance from unpaired t-tests are indicated; **** = p < 0.0001. c, Area of the Rubisco condensate as measured in Fiji, according to region ‘A’ in a. For the ΔEPYC1 (CrRbcS-mCherry), the largest condensed fluorescence signal at the canonical position was measured. *** = p < 0.001. The median and quartile values are represented by the solid and dashed horizontal lines in each plot. d, Estimated volume distributions of the Rubisco condensates in the three lines, assuming sphericity of the condensate and calculating from the cross-sectional area in b. *** = p < 0.001. e, Confocal fluorescence microscopy images of tagged RbcS and CsLinker in the ΔEPYC1 background. Scale bars = 1 μm. f, Western blot confirmation of CsLinker variant expression in WT and ΔEPYC1 background lines. g, Western blot confirmation of CsLinker expression in ΔEPYC1 background relative to the empty vector and background strains. RbcL was used as a loading control.
Extended Data Fig. 7
Extended Data Fig. 7. Spot test of CsLinker replacement lines.
Images of spot test plates following 5 days of growth at the indicated conditions. Images used in Fig. 4 were taken from the pH 8.0 dataset.
Extended Data Fig. 8
Extended Data Fig. 8. Cross-reactivity of CsLinker with green lineage Rubiscos.
a, Droplet sedimentation assays comparing the cross-reactivity of CsLinker and EPYC1 fixed at 4 μM and green Rubiscos fixed at 2 μM. In these experiments, tagged linker was also included at 5% molar ratio as completed in the accompanying microscopy experiments in Fig. 5. The amount of Rubisco and Linker pelleted in each reaction is indicated below, with the numbers colored green if droplet formation was observed in the accompanying microscopy experiments in Fig. 5. b, Confocal fluorescence microscopy and brightfield images of droplets formed with CsLinker fixed at 2 μM, with Rubiscos from the green lineage fixed at 1 μM. mEGFP-CsLinker was included at a 5% molar ratio. c, Images of droplets formed with EPYC1 fixed at 2 μM ( + 5% EPYC1-mEGFP molar ratio), with Rubiscos from the green lineage fixed at 1 μM. Scale bar in b and c is 5 μm. d, Droplet sedimentation assays comparing the cross-reactivity of CsLinker and EPYC1 fixed at 2 μM, with Rubiscos from the green lineage fixed at 1 μM. The amount of Rubisco and Linker pelleted in each reaction is indicated below, with the numbers colored green if droplet formation was observed in the accompanying microscopy experiments in b and c. Abbreviations: Cs = Chlorella sorokiniana, Cr = Chlamydomonas reinhardtii, Um = Ulva mutabilis, Ar = Adiantum raddianum (Fern), So = Spinacia oleracea, Nb = Nicotiana benthamiana, D86H = Chlamydomonas reinhardtii with D86H mutation made in RbcL.
Extended Data Fig. 9
Extended Data Fig. 9. Variation of the CsLinker-interacting interface in plant RbcLs and potential alternative interactions at the interface.
a, Alignment of the consensus sequences of the CsLinker-binding interface in the RbcLs of major plant groups. Consensus sequences were produced from alignment of the indicated number of sequences in each class from NCBI. b, Alignment of the CsLinker-binding interfaces in the RbcLs of the 24 most valuable C3 crop plants (FAOSTAT data) alongside the algal and fern Rubiscos tested in this study. c, The possibly disrupted hydrogen bond network in the βC-D loop of the Ulva RbcL. The AlphaFold 2 structural prediction of the Ulva RbcL (green) is shown aligned with the Chlorella RbcL coordinates solved in this study (blue). The disrupted hydrogen bond is annotated in red, with the corresponding lengths of the cognate and disrupted hydrogen bonds shown in red and black respectively. d, Demonstration of the disrupted salt bridge in the Nicotiana RbcL due to the D86R substitution. e, A possible compensatory salt bridge in the K94 residue of the βC-D loop in the Nicotiana RbcL if an alternative residue conformer is occupied (K94*).
Extended Data Fig. 10
Extended Data Fig. 10. Transient expression of CsLinker in Nicotiana benthamiana.
a, Confocal microscopy image of turboGFP-tagged CsLinker transiently expressed alone in Nicotiana. b, Image of chloroplast-targeted (fused to Arabidopsis RbcS signal peptide; SP1A) turboGFP expressed alone, demonstrating a lack of puncta. c, Images of transient co-expression of CsLinker-turboGFP and mCherry-tagged Nicotiana benthamiana RbcS. d, Image of NbRbcS-mCherry transiently expressed alone in Nicotiana chloroplasts. Scale bars in a-d = 5 μm. The results presented in panels a, b and d were from single non-repeated experiments. The results in panel c (and Fig. 5d) were from two independent experiments.

Comment in

References

    1. Field, C. B., Behrenfeld, M. J., Randerson, J. T. & Falkowski, P. Primary production of the biosphere: integrating terrestrial and oceanic components. Science281, 237–240 (1998). - PubMed
    1. Bar-Even, A. et al. The moderately efficient enzyme: evolutionary and physicochemical trends shaping enzyme parameters. Biochemistry50, 4402–4410 (2011). - PubMed
    1. Shih, P. M. et al. Biochemical characterization of predicted Precambrian RuBisCO. Nat. Commun.7, 10382 (2016). - PMC - PubMed
    1. Bouvier, J. W., Emms, D. M. & Kelly, S. Rubisco is evolving for improved catalytic efficiency and CO2 assimilation in plants. Proc. Natl Acad. Sci. USA121, e2321050121 (2024). - PMC - PubMed
    1. Tcherkez, G. G. B., Farquhar, G. D. & Andrews, T. J. Despite slow catalysis and confused substrate specificity, all ribulose bisphosphate carboxylases may be nearly perfectly optimized. Proc. Natl Acad. Sci. USA103, 7246–7251 (2006). - PMC - PubMed

Publication types

MeSH terms

Substances