. 2025 Sep;43(9):1539-1547.
doi: 10.1038/s41587-024-02431-9. Epub 2024 Oct 9.

One-step nanoscale expansion microscopy reveals individual protein shapes

Affiliations

One-step nanoscale expansion microscopy reveals individual protein shapes

Ali H Shaib et al. Nat Biotechnol. 2025 Sep.

Abstract

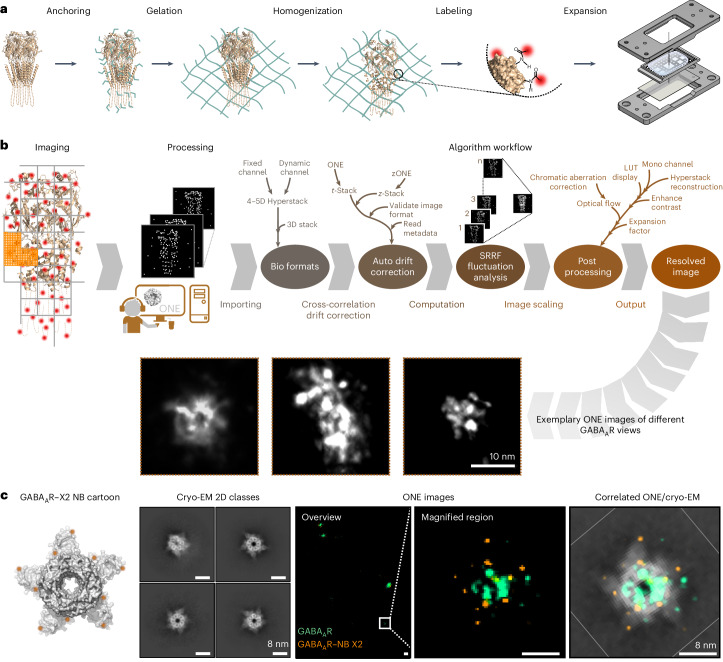
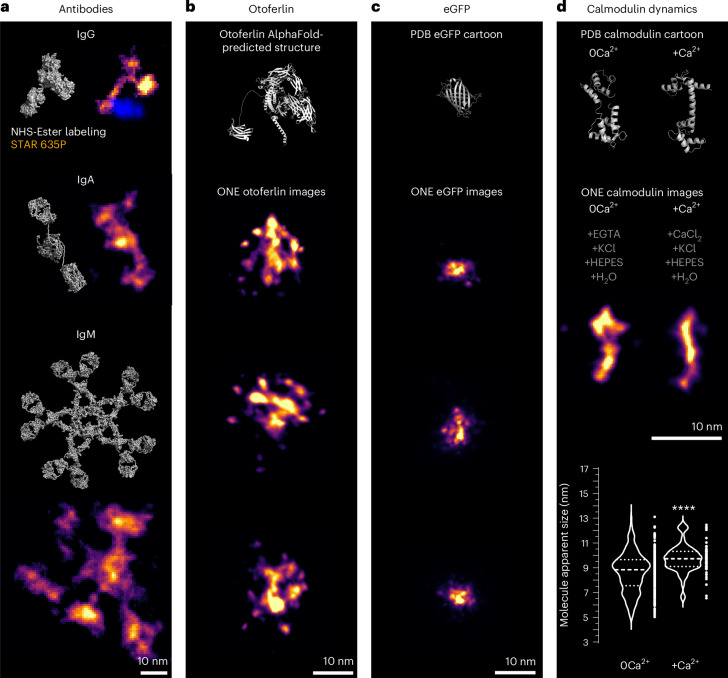
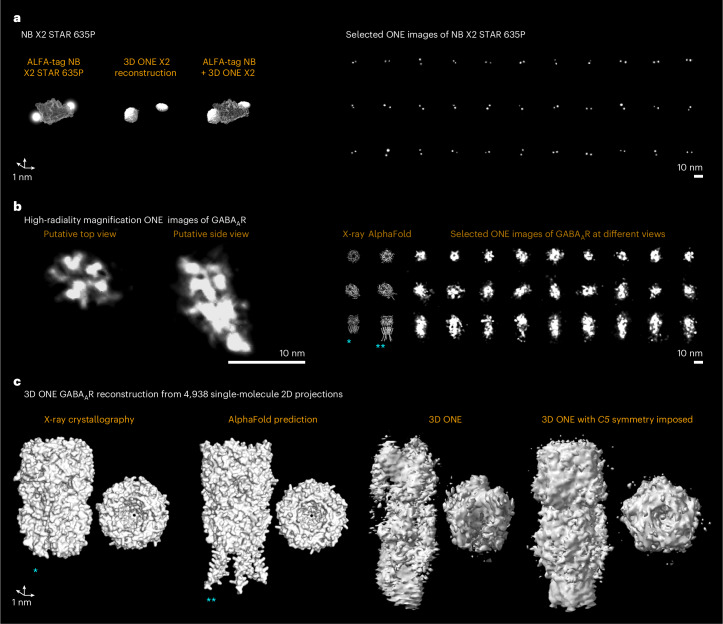
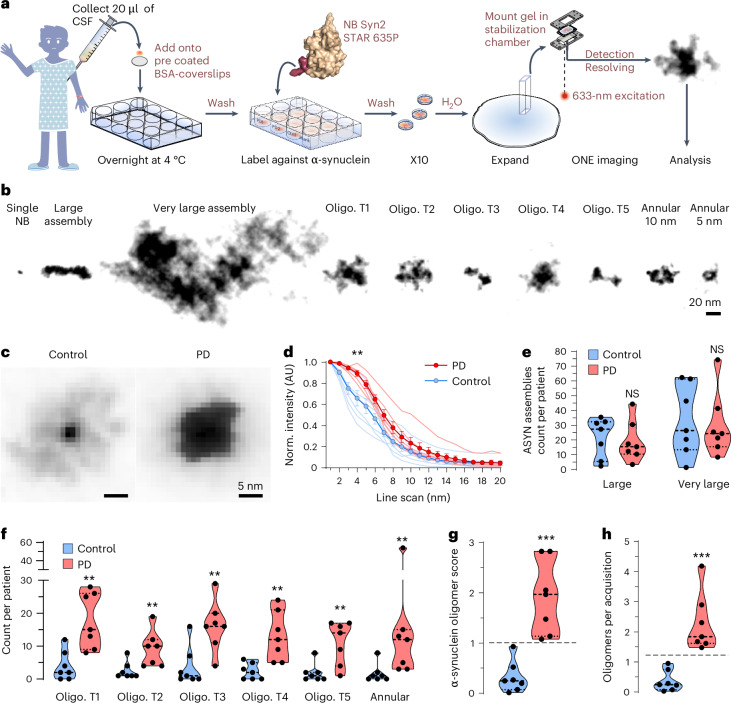
The attainable resolution of fluorescence microscopy has reached the subnanometer range, but this technique still fails to image the morphology of single proteins or small molecular complexes. Here, we expand the specimens at least tenfold, label them with conventional fluorophores and image them with conventional light microscopes, acquiring videos in which we analyze fluorescence fluctuations. One-step nanoscale expansion (ONE) microscopy enables the visualization of the shapes of individual membrane and soluble proteins, achieving around 1-nm resolution. We show that conformational changes are readily observable, such as those undergone by the ~17-kDa protein calmodulin upon Ca2+ binding. ONE is also applied to clinical samples, analyzing the morphology of protein aggregates in cerebrospinal fluid from persons with Parkinson disease, potentially aiding disease diagnosis. This technology bridges the gap between high-resolution structural biology techniques and light microscopy, providing new avenues for discoveries in biology and medicine.


Conflict of interest statement

Competing interests: S.O.R. and F.O. are shareholders of NanoTag Biotechnologies GmbH. E.S.B. is an inventor on multiple patents related to ExM and co-founder of a company working on commercial applications of ExM. The other authors declare no competing interests. Ethics statement: Animals (Wistar rats, P0–P1) were treated according to the regulations of the local authority, the Lower Saxony State Office for Consumer Protection and Food Safety (Niedersächsisches Landesamt für Verbraucherschutz und Lebensmittelsicherheit), under the license Tötungsversuch T09/08. The informed consent of all of participants was obtained at the Paracelsus Elena Klinik, following the principles of the Declaration of Helsinki.

Figures

Fig. 1
Fig. 1. ONE microscopy concept.
a, Biological samples are linked to gel anchors, relying on Acryloyl-X, followed by X10 gel formation and homogenization, which is achieved either by proteinase K digestion or by proteolysis induced by autoclaving in alkaline buffers. Full expansion is achieved by repeated washes with distilled H2O and is followed by mounting gel portions in a specially designed chamber. b, Expansion separates the fluorophores spatially, allowing them to fluctuate independently. Repeated imaging is performed (up to 3,000 images) in any desired imaging system (confocal, epifluorescence, etc.) to detect signal fluctuations, which are then computed through an open-source JAVA plugin (ONE platform) based on the SRRF algorithm, before assembling the final super-resolved exemplary images (here, GABAARs). The analysis routine is explained in Supplementary Fig. 1 and a flowchart of the software implementation is shown in Supplementary Fig. 2. Further details on image acquisition and image processing can be found in the Methods. c, Superimposition of ONE microscopy images and cryo-EM data. A cartoon view of a complex consisting of a GABAAR bound simultaneously by five Nbs (GABAAR–Nb, PDB 5OJM). The red dots represent the two fluorophores on each Nb. The four cryo-EM images are representative 2D classes of the GABAAR–Nb complexes, derived from the same samples as used for ExM. The overview panel shows an exemplary ONE image (from a total 648 ONE images, acquired from at least six gels) of GABAAR–Nb that are postexpansion labeled with NHS-ester dyes described in Supplementary Fig. 3, followed by a magnified region of a single receptor. The last panel shows a cryo-EM–ONE overlay.
Fig. 2
Fig. 2. ONE analysis of single molecules.
To delineate protein shapes, gels containing proteins were labeled with NHS-ester fluorescein after homogenization. a, ONE images of isolated immunoglobulins (secondary anti-mouse IgG conjugated to STAR 635P, human IgA and IgM and their respective PDB structures: 1HZH, 1IGA and 2RCJ) obtained from three independent experiments. Immunoglobulin ONE images were analyzed by a different fluctuation analysis, TRPPM, unlike the TRAC4 (ref. ) approach used in most other figures. Unlike TRAC4, which aims to separate the individual fluorophores, TRPPM enhances the cohesiveness of the fluorophores decorating the single antibodies, resulting in cloud-like signals. Overviews and more analysis can be found in Supplementary Fig. 10. b, ONE examples of otoferlin images obtained from at least three independent experiments. The otoferlin model is an AlphaFold prediction. Overviews, control experiments and the otoferlin gallery can be found in Supplementary Fig. 11. c, GFP ONE images obtained from three independent experiments and the PDB 1EMA structure. Overviews, size measurements and the GFP gallery can be found in Supplementary Fig. 12. d, Structures (PDB 1CLL and 1CFD) of the Ca2+ sensor calmodulin, in the presence or absence of its ligand, respectively, along with ONE images after proteinase K-based homogenization and expansion. The expected elongation by ~1 nm was reproduced, as shown by the quantification, which indicates measurements of the longest axis of the calmodulin molecules, performed across all molecules, from all conditions, in a blind fashion (P < 0.0001, two-tailed nonparametric Mann–Whitney test; n = 66–197). Similar analysis, after homogenization using autoclaving (P = 0.0006, n = 70–155; Supplementary Fig. 13). The violin plot shows the median, the 25th percentile and the range of values. Source data
Fig. 3
Fig. 3. 3D ONE reconstruction using unsupervised ab initio artificial intelligence architecture.
To reconstruct 3D models from 2D ONE images, segmented single molecules were transferred to a modified cryoFIRE neural network (the neural network workflow can be found in Supplementary Fig. 22a). a, To run a sanity test on the reconstructed images, we used ONE images of 279 ALFA tag Nb STAR 635P with two fluorophores at known positions. This experiment used the inherent signal of the X2 STAR 635P fluorophores, foregoing additional labeling. The panel on the left shows the following: left, a model for the ALFA tag Nb structure (PDB 6I2G) in mesh representation, carrying two fluorophores; middle, 3D ONE X2 reconstruction; right, a view of both the 3D ONE X2 reconstruction and the Nb. The panel on the right shows selected ONE images of Nb X2 STAR 635P. The generated 3D positions of X2 fluorophores were at 4.6-nm distance, which correlates well with the measured line scans of 2D ONE images at 4.5 nm (Supplementary Fig. 14a–e). b, ONE images of NHS-ester fluorescein-labeled GABAAR in top and side views, obtained with high-radiality magnification (Supplementary Discussion). A gallery of GABAAR in different positions is shown. c, 3D representations of GABAAR generated by crystal structure (PDB 4COF), by an AlphaFold-Multimer prediction, by 3D ONE (raw) and by 3D ONE after imposing C5 symmetry to the molecule. Side and top views are shown. The crystallography structure does not indicate segments that are shown in the AlphaFold model. These segments are visible in the 3D ONE reconstruction. The increased length of the 3D ONE reconstruction, when compared to the AlphaFold model, is probably accounted for by the fact that AlphaFold predicts a substantial unfolded coil in this region, which is not depicted (full AlphaFold-predicted models and error estimates can be found in Supplementary Fig. 23). 3D ONE reconstructions and AlphaFold-predicted models are provided in the Supplementary Information (PDB or MRC files; all reconstruction files have self-explanatory names). Fourier shell correlation analysis indicated that the 3D ONE reconstruction is generated at a resolution of 16 Å. The cyan asterisks indicate the following: *components known to be missing in the PDB 4COF structure; **AlphaFold prediction unclear in this area, as AlphaFold cannot reliably predict disordered domains.
Fig. 4
Fig. 4. Detection of ASYN oligomers in human CSF.
a, CSF probes were obtained from persons with PD and controls and 20-µl volumes were placed on BSA-coated coverslips, followed by ONE imaging after immunolabeling ASYN using a specific Nb. b, A gallery of typical ASYN species observed in the CSF samples. Only the fluorophores contained by the Nbs are visualized here (no postexpansion labeling). c, Average ASYN assemblies from a person with PD and a control. d, An analysis of the spot profiles detects significant differences, with the average control object being smaller than the average PD object. All ASYN assemblies for the control and persons with PD were averaged from three independent experiments. Significant differences were determined by a Friedman test followed by Dunn–Šidák correction (P = 0.0237); errors show the s.e.m. AU, arbitrary units. e, An analysis of the number of larger assemblies in CSF samples. No significant differences were determined according to Mann–Whitney tests (P= 1 and 0.7104). NS, not significant. f, An analysis of the number of oligomers in CSF samples. All comparisons indicated significant differences according to Mann–Whitney tests followed by a Benjamini–Hochberg multiple-testing correction with a false discovery rate of 2.5% (P = 0.0105, 0.0023, 0.0111, 0.0012 and 0.0012, in the respective order of datasets). g,h, Analyses of the number of oligomers as a proportion of all ASYN assemblies analyzed (g) or as the number per acquisition (h). Both procedures discriminate fully between the persons with PD and the controls. For the second procedure, the lowest PD value is 50% larger than the highest control. Significant differences were determined by a two-tailed nonparametric Mann–Whitney test (P < 0.0001 for h,g); n = 7 persons with PD and n = 7 controls. Source data

References

    1. Balzarotti, F. et al. Nanometer resolution imaging and tracking of fluorescent molecules with minimal photon fluxes. Science355, 606–612 (2017). - PubMed
    1. Gwosch, K. C. et al. MINFLUX nanoscopy delivers 3D multicolor nanometer resolution in cells. Nat. Methods17, 217–224 (2020). - PubMed
    1. Sahl, S. J. et al. Direct optical measurement of intra-molecular distances down to the Ångström scale. Preprint at bioRxiv10.1101/2023.07.07.548133 (2023).
    1. Reinhardt, S. C. M. et al. Ångström-resolution fluorescence microscopy. Nature617, 711–716 (2023). - PMC - PubMed
    1. Lelek, M. et al. Single-molecule localization microscopy. Nat. Rev. Methods Primers1, 39 (2021). - PMC - PubMed

LinkOut - more resources