. 2024 Nov;635(8037):219-228.
doi: 10.1038/s41586-024-07955-3. Epub 2024 Oct 9.

The interplay of mutagenesis and ecDNA shapes urothelial cancer evolution

Affiliations

The interplay of mutagenesis and ecDNA shapes urothelial cancer evolution

Duy D Nguyen et al. Nature. 2024 Nov.

Abstract

Advanced urothelial cancer is a frequently lethal disease characterized by marked genetic heterogeneity1. In this study, we investigated the evolution of genomic signatures caused by endogenous and external mutagenic processes and their interplay with complex structural variants (SVs). We superimposed mutational signatures and phylogenetic analyses of matched serial tumours from patients with urothelial cancer to define the evolutionary dynamics of these processes. We show that APOBEC3-induced mutations are clonal and early, whereas chemotherapy induces mutational bursts of hundreds of late subclonal mutations. Using a genome graph computational tool2, we observed frequent high copy-number circular amplicons characteristic of extrachromosomal DNA (ecDNA)-forming SVs. We characterized the distinct temporal patterns of APOBEC3-induced and chemotherapy-induced mutations within ecDNA-forming SVs, gaining new insights into the timing of these mutagenic processes relative to ecDNA biogenesis. We discovered that most CCND1 amplifications in urothelial cancer arise within circular ecDNA-forming SVs. ecDNA-forming SVs persisted and increased in complexity, incorporating additional DNA segments and contributing to the evolution of treatment resistance. Oxford Nanopore Technologies long-read whole-genome sequencing followed by de novo assembly mapped out CCND1 ecDNA structure. Experimental modelling of CCND1 ecDNA confirmed its role as a driver of treatment resistance. Our findings define fundamental mechanisms that drive urothelial cancer evolution and have important therapeutic implications.


Conflict of interest statement

B.M.F.: consulting or advisory role for QED therapeutics, Boston Gene, Astrin Biosciences Merck, Immunomedics/Gilead, QED therapeutics, Guardant and Janssen; patent royalties from Immunomedics/Gilead; research support from Eli Lilly; and honoraria from Urotoday. O.E.: stock and other ownership interests from Freenome, OneThree Biotech, Owkin and Volastra Therapeutics, and personal fees from Pionyr Immunotherapeutics and Champions Oncology. S.T.T.: consulting or advisory role for 4D Pharma, Abbvie, AIkido Pharma, Amgen, Astellas Pharma, Bayer, Blue Earth Diagnostics, Clarity Pharmaceuticals, Clovis Oncology, Convergent Therapeutics, Dendreon, Endocyte, Genentech, Genomic Health, Gilead Sciences, Immunomedics, Janssen, Karyopharm Therapeutics, Medivation, Myovant Sciences, Novartis, Pfizer, POINT Biopharma, QED Therapeutics, Sanofi, Seagen, Telix Pharmaceuticals and Tolmar; research funding from Abbvie, Amgen, Astellas Pharma, AstraZeneca, AVEO, Bayer, Boehringer Ingelheim, Bristol-Myers Squibb, Clovis Oncology, Dendreon, Endocyte, Exelixis, Genentech, Immunomedics, Inovio Pharmaceuticals, Janssen, Karyopharm Therapeutics, Lilly, Medivation, Merck, Millennium, Newlink Genetics, Novartis, POINT Biopharma, Progenics, Rexahn Pharmaceuticals, Sanofi and Stem CentRx; patents, royalties, other intellectual property or patent royalty from Immunomedics/Gilead; travel, accommodation and expenses from Amgen, Immunomedics and Sanofi; and uncompensated relationships from ATLAB Pharma and Phosplatin Therapeutics. D.M.N.: consulting or advisory role for AstraZeneca, and research funding from AstraZeneca, Boehringer Ingelheim, Clovis Oncology, Exelixis, Immumedics, Janssen, Novartis, Pfizer and Zenith Epigenetics. J.T.N.: consulting or advisory role for AIQ Solutions, and travel, accommodation or expenses from Digital Science Press. C.N.S.: consulting or advisory role for Astellas Pharma, AstraZeneca, Bayer, Bristol-Myers Squibb/Medarex, Foundation Medicine, Genzyme, Immunomedics, IMPAC Medical Systems, Incyte, Medscape, Merck, MSD, Pfizer, Roche and UroToday. A.M.M.: consulting or advisory role for Eisai, Exelixis and Janssen. J.M.M.: research funding from Personal Genome Diagnostics, and travel, accommodation or expenses from Personal Genome Diagnostics. D.S.: research funding from Urogen Pharma, Cepheid, Anchiano and CryoLife. P.A.: stock and other ownership interests with Abyost Pharmaceuticals; consulting or advisory role for ArTara Therapeutics; research funding from Adaptive Biotechnologies, Janssen Oncology and natera; and patents, royalties or other intellectual property from intravesical imidazolium compounds and urine biomarkers patent application. D.D.N., W.F.H., T.R.C., H.G., J.M.S., M. Shah, Z.R.G., L.W., A.H., M. Sigouros, J. Manohar, J. Moyer, M.A.A., A. Semaan, S.C., F.M.R., D.W., M.O., R.R.S., W.L., H.L.V., A. Sboner, G.I. and N.R. declare no competing interests.

Figures

Fig. 1
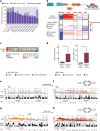
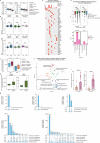
Fig. 1. Timing mutagenic processes in UC evolution.
a, Phylogenetic tree depicting UC evolution for patient WCMIV063. Each node represents SNVs (centre), mean CCF across all SNVs within the node (blue numbers) and genes affected by high-impact SNVs. SBS, DBS and ID signature proportions are represented as concentric circles (periphery to the centre, respectively) within each node. The number of samples collected from different tumour sites is indicated on the human body diagram. Illustration of a human adapted from ref. , Springer Nature America. b, Leaf/trunk variant fold change of platinum chemotherapy-induced and APOBEC-induced variants. n = 12 tumours, P = 5.91 × 10⁻⁵. c, Clonality fold change of APOBEC3 (SBS2 and SBS13), chemotherapy (SBS31 and SBS35) and ageing (SBS1) mutational signatures in 44 post-chemotherapy tumours. n = 28 (ageing), n = 29 (chemotherapy), n = 42 (APOBEC). Early/late APOBEC–chemotherapy: P = 2.1 × 10−7; early/late ageing–chemotherapy: P = 1.8 × 10−4; clonal/subclonal APOBEC–chemotherapy: P = 4.3 × 10⁻⁴. d, Velocity fold change of APOBEC3-induced, chemotherapy-induced and ageing-associated mutagenesis. n = 34 (APOBEC SBS), n = 30 (chemotherapy SBS), n = 28 (APOBEC DBS), n = 24 (chemotherapy DBS) patients. APOBEC SBS–chemotherapy SBS: P = 0.0139; APOBEC DBS–chemotherapy DBS: P = 7.0 × 10−4. e, Upset and alluvial plots depicting shared SBS2 and SBS13 mutations (top, vertical bars) between normal urothelium and metastatic UC tumours in patient WCMIVG010. S on the y axis of the bottom plot indicates the sample identifier. Alluvial y axes represent SNV counts. Image of human bladder created by Servier (https://smart.servier.com/) and adapted from Bioicons (https://bioicons.com/), under a CC BY 3.0 licence. f, Maximum likelihood estimates of dN/dS ratios for significant genes (q < 0.1). Circle size represents coding SNV counts across the cohort. Colour indicates the proportion of APOBEC3-induced coding mutations. TP53 had the highest dN/dS values (inset, top-right corner). Two-sided Wilcoxon rank-sum test was used in bd. Unless otherwise specified, boxes show the median and the interquartile range (IQR); the lower whisker indicates Q1 – 1.5 × the IQR; the upper whisker indicates Q3 + 1.5 × the IQR. *P < 0.05, **P < 0.01, ***P < 0.001, ****P < 0.0001, NS, not significant. Source Data
Fig. 2
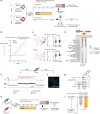
Fig. 2. The interplay between APOBEC3 and platinum chemotherapy-induced mutagenesis and ecDNA during UC evolution.
a, Heatmap displaying junction burdens of complex SVs (y axis) in 71 UC tumours (x axis). Tyfonas, BFBs and DMs are grouped by their association with ecDNA. The heatmap is normalized to the average junction burden of our cohort and scaled in the natural log. Other complex SVs, from top to bottom, include chromothripsis, chromoplexy, TICs, quasi-reciprocal pairs, rigma and pyrgo. b, Schematic depicting the impact of APOBEC3 and chemotherapy-induced mutagenesis on ecDNA biogenesis during cancer evolution. Images of chromosomes were created by KKT Madhusanka and adapted from Adobe Stock (https://stock.adobe.com). c, Proportion of kataegic events co-localizing with SVs. DM (non-ecDNA) events were identified by JaBbA but not classified as ‘cyclic’ by AmpliconArchitect. d, Kataegic events on ecDNA-forming SVs showed a significantly shorter median distance to the nearest breakpoint compared to kataegis on other non-ecDNA SVs and kataegis without SV association. ecDNA-forming SVs median size in this cohort was 5.56 Mb, used as the upper limit of the distance to the closest breakpoints for kyklonas. The median distance of all mutations within a kataegic event was collapsed to one measurement per event. Two-sided Wilcoxon rank-sum test. e, Violin plots of VAF distributions for APOBEC3-induced kyklonic mutations (n = 147) and chemotherapy-induced SNVs (n = 716) on ecDNA-forming SVs. Plots extend between the maximum and minimum of the distribution. Two-sided Wilcoxon rank sum test. P < 2.22 × 10−16. f, Contributions of mutational signatures with sample/VAF tranche combinations in all ecDNA-forming SVs. Only tranches with >100 mutations are displayed. g, ecDNA-forming SVs harbouring ≥1 kyklonic event in patient WCMIVG035S01. CN track: JaBbA genome graph showing CNs for rearranged DNA segments (grey vertices) with SV junctions (aqua blue edges) within circular ecDNA events. Kyklonas track: normalized VAF of kyklonic mutations. Non-clustered track: normalized VAF of non-clustered APOBEC3-induced and platinum-induced signature mutations on ecDNA-forming SVs. Source Data
Fig. 3
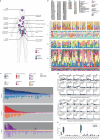
Fig. 3. Increased complexity and CN of CCND1 ecDNA amplicons following systemic therapy.
a, Distribution of circular, heavily rearranged, linear or non-cyclic amplicons in samples with CCND1 amplification from our WCM bladder cancer (BLCA-WCM) cohort, BLCA-TCGA cohort and TCGA/PCAWG pan-cancer subset cohorts analysed in a previous study. b, Top, schematic of the p16–cyclin D1–CDK4/6–Rb pathway. Bottom, normalized CN alteration heatmap of chromosomal regions 9p21.3 (CDKN2A), 11q13.3 (CCND1) and genes CDK4 and CDK6 and RB1 in 71 UC tumours. Chromosomal regions and genes are not drawn to scale. c, Normalized CCND1 and LTO1 mRNA expression. d, ecDNA-forming SV events (up to 3 MB) in post-chemotherapy (post-chemo) tumours had significantly higher mean JCN (P = 0.016) and maximum JCN (P = 0.032) than ecDNA-forming SV events in pre-chemotherapy (pre-chemo) tumours. n = 15 events in 12 tumours. Two-sided Wilcoxon rank-sum test. Each dot represents one ecDNA-forming SV event. eh, Combined genome graphs of AmpliconArchitect (top track) with JaBbA (CN and read depth tracks). JaBbA tracks show the chromosomal locations and CN alteration for DNA segments (black vertices) and the corresponding JaBbA SV events (coloured edges) in patient WCMIV091 (e,f) and in patient WCMIV076 (g,h) before (e,g) and after (f,h) systemic therapy for primary bladder tumour. Patient WCMIV091 was treated with neoadjuvant abemaciclib, a CDK4/6 inhibitor, for 4 weeks as part of a clinical trial. Patient WCMIV076 received a neoadjuvant combination of gemcitabine (Gem) and cisplatin (Cis). Top right schematics show that in patient WCMIV091, FGFR1 was rearranged with CCND1 in the same ecDNA, whereas in patient WCMIV076, FGF19 and CCND1 were co-amplified in ecDNA. The chromosomal locations of CCND1, FGFR1 and FGF19 are highlighted in red. Source Data
Fig. 4
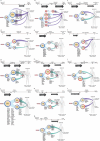
Fig. 4. CCND1 ecDNA drives adaptive fitness to cisplatin chemotherapy.
a, Schematic of experiments using non-integrating CCND1 episomal lentiviral vector transduction in the UMUC3 bladder cancer cell line and the competition assay, monitored by Incucyte live-cell imaging and single-cell 10x RNA sequencing. b, Ratio of mCherry CCND1 episomal ecDNA to GFP empty cells over 96 h, demonstrating a selective advantage for CCND1 ecDNA. n = 25 areas per well. Two-sided unpaired t-test. Data are mean ± s.d. At each 6-h point from 0–96 h, FDR-adjusted P = 0.02, 0.11, 0.12, 0.047, 0.022, 0.0083, 0.0013, 0.00031, 0.00021, 7.1 × 10−5, 8.0 × 10−6, 7.0 × 10−6, 7.0 × 10−6, 7.0 × 10−6, 7.0 × 10−6 and 1.3 × 10−5. c, Uniform manifold approximation and projection (UMAP) (left) and boxplot (right) comparing E2F target gene expression scores in single cells with GFP empty control (vehicle n = 7,602, cisplatin n = 8,177) and mCherry CCND1 ecDNA (vehicle n = 8,336, cisplatin n = 4,320) under cisplatin (P = 5.3 × 10−91) and vehicle (P = 8.3 × 10−49) treatment. Two-sided Mann–Whitney test. d, Bubble plot showing enriched gene sets for differentially expressed genes between GFP empty control and mCherry CCND1 ecDNA samples under vehicle and cisplatin treatments. Bubble sizes represent NES values. Black borders denote significance (FDR q < 0.01). e, JaBbA detection and AmpliconArchitect confirmation of cyclic ecDNA-forming DM events in SF295 cell lines. f, Metaphase FISH showing CCND1 amplification on ecDNA. n = 1 independent experiment. Scale bar, 10 µm. g, SDS–PAGE western blot validating CCND1 knockdown. n = 3 independent experiments. For gel source data, see Supplementary Fig. 1. h, Schematic of CCND1 shRNA and scramble shRNA control isogenic cell lines in a competition assay under cisplatin selection and monitoring by Incucyte live-cell imaging. i, Cell ratio after 96-h treatment of mCherry-positive cells with shRNA-mediated CCND1 knockdown versus GFP-positive cells with scramble shRNA control, showing reduced fitness of the CCND1 knockdown cells (P = 0.034). n = 25 areas per well. One-sided unpaired t-test. Data are mean ± s.d. Image of six-well plate created by KeHan and adapted from Bioicons (https://bioicons.com/), under a CC BY 1.0 licence. Source Data
Extended Data Fig. 1
Extended Data Fig. 1. Mutational signatures.
(a) Schematic of anatomical sites of primary and metastatic urothelial cancer samples. For each site, the number of tumours stratified by chemotherapy treatment status is listed. (b) Mutational signatures in 77 advanced urothelial carcinoma and 5 morphologically normal urothelium in the WCM-UC cohort. Two samples lacked calling of the DBS signature due to an insufficient number of DBS variants. One tumour exhibited an absence of any detected SV events. N/A: not applicable. (c) The landscape of mutational signatures induced by endogenous mutagenic processes and exogenous exposures in advanced urothelial carcinoma. From top to bottom, bar graphs represent the contribution of mutational signatures induced by APOBEC3, platinum chemotherapy, and tobacco smoking, respectively, in 77 urothelial tumours. Each panel includes associated SBSs (top bar plots) and DBSs (bottom bar plots) attributed to each mutagenic process. The samples are ordered by group (sex, chemotherapy status, and smoking status) and by the contribution of SBS signatures. (d) Pearson’s correlation of ID signatures with SBS contribution induced by APOBEC3 (top panels) and platinum chemotherapy (bottom panels). Each dot represents one tumour. Pre-chemotherapy tumours were excluded from this analysis. (e) Endogenous mutational signatures between paired primary and metastatic samples of four patients. The SBS contribution of multiple metastatic samples within a patient was collapsed to the mean. Two-sided paired Wilcoxon’s test. Source Data
Extended Data Fig. 2
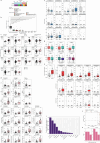
Extended Data Fig. 2. Phylogenetic trees from individual patients.
(am) Superimposed mutational signatures on nodal branching points in phylogenetic trees for patients with at least two tumour samples. (Top) Timeline and clinical course (vertical lines) in the natural history of the disease. (Bottom) Each node represents the number of SNVs (centre), mean CCF across all SNVs in the node (blue numbers), and genes affected by high-impact SNVs. SBS, DBS, and ID signature proportions are represented as concentric circles (periphery to center, respectively) within each node. The number of samples collected from different tumour sites is indicated on the human body diagram. Source Data
Extended Data Fig. 3
Extended Data Fig. 3. APOBEC3 and chemotherapy-induced mutations and DNA damage footprints.
(a) Clonality fold-change of mutations induced by the APOBEC3 (SBS2/13), platinum chemotherapy (SBS31/35), and aging (SBS1) mutational signatures in 44 post-chemotherapy tumours (dots) in the WCM-UC cohort. n = 28 (aging), n = 29 (chemo), n = 42 (APOBEC). Two-sided Wilcoxon rank sum test. Each line connects samples collected from the same patient. Early/late APOBEC-Chemo: P = 2.1 × 10−7, Early/late Aging-Chemo: P = 1.8 × 10−4, Clonal/subclonal APOBEC-Chemo: P = 4.3 × 10−4. (b) The clonality of detected mutational signatures in 70 pre- and post-chemotherapy samples. Each dot represents one tumour. n = 66 (APOBEC), n = 49 (aging), n = 11 (tobacco). Two-sided Wilcoxon’s test. (c) Velocity fold change of APOBEC3-, chemotherapy-induced and aging-associated mutagenesis. n = 34 patients. Two-sided Wilcoxon rank sum test. Each connecting line represents matched samples collected from the same patient. APOBEC SBS - chemo SBS: P = 0.0139, APOBEC DBS - chemo DBS: P = 7.0 × 10−4. (d) The mutagenic velocity fold change of APOBEC3-induced mutational signatures SBS2/13 and DBS11 compared to aging signatures SBS1 in current and former smokers (n = 36) versus never smokers (n = 14). Two-sided Wilcoxon’s test. (e) OncoPrint showing mutations attributed to platinum chemotherapy-induced signatures SBS31/35 on cancer genes (rows) in UC tumours treated with chemotherapy (columns). (f) Enriched pathways affected by mutations in post-chemotherapy UC samples. Each point represents a pathway in the NCI-Nature 2016 gene set library. The pathways are plotted based on the first two UMAP dimensions. Pathways with more similar gene sets are positioned closer together. Pathways are coloured by automatically identified clusters computed with the Leiden algorithm. Circles with black outlines indicate pathways with FDR-adjusted P value ≤ 0.002. Two-sided Fisher’s exact test. (g) Upset plots showing shared APOBEC3-induced SBS2/13 mutations (top, vertical bars) between different normal urothelium, primary metastatic UC tumours from each patient (bottom, vertical connected dots). From top-bottom, left-right: Patient IDs WCMIVG001, WCMIVG065, WCMIVG091, WCMIVG010, WCMIVG013. S##: sample ID. Different tumour samples are numbered. (h) (top) Cancer cell fraction (CCF) distributions and (bottom) Clonal and subclonal mutation count for APOBEC3-induced mutations in chromatin-modifying genes compared to Cancer Gene Consensus (CGC) genes and non-cancer genes. n = 1640 mutations across 70 samples. Two-sided unpaired Wilcoxon’s test, no correction for multiple testing. Each dot represents one variant. (i) Boxplot showing the percentage of pRPA-positive nuclei and γH2AX-positive nuclei under different treatments (DMSO: n replicates = 2 and Dox: n replicates = 4) with error bars representing standard error of the mean (SEM). Two-sided Mann-Whitney test. γH2AX: P = 5.1 × 10−7, pRPA: P = 1.3 × 10−21. Source Data
Extended Data Fig. 4
Extended Data Fig. 4. Complex SVs.
(a) The proportion of simple and complex SV events from 71 samples from 50 patients in our UC cohort. (b) Tyfonas events have a significantly higher junction burden than other complex SVs. n = 248 SV events. Two-sided Wilcoxon rank-sum test was used in panels b, d, e, f, g, and h. Each dot represents one event. In order from left to right: P = 0.0017, P = 7.8 × 10−5, P = 0.0002, P = 6.9 × 10−6, P = 4.7 × 10−6, P = 1.4 × 10−7, P = 3.2 × 10−6, P = 1 × 10−15. (c) The relationship between tumour mutation burden (TMB) and SV types in WCM-UC tumours. In panels c, d, e, n = 71 samples split by the presence or absence of JaBbA events. TMB: the total number of SNVs and insertion-deletion mutations (INDELs). (d) The association between genome-wide SBS/DBS/ID signature contributions and the presence of SV types called in 71 WCM-UC tumours. A total of 8 SBSs, 8 DBSs, and 13 IDs with at least 0.05 contribution in at least 10% of samples were filtered for comparisons. FDR-adjusted P value ≤ 0.25 was used to nominate significant hits, given the limited size of our cohort. (e) The copy number variant (CNV) features associated with SV types called in WCM-UC tumours. The top 16 associations with significant FDR-adjusted P value ≤ 0.25 are presented. The y axis represents the count of CNV segments assigned to the feature by SigProfilerMatrixGenerator and formatted as copy number: loss-of-heterozygosity status: segment length. (c-e) ecDNA-forming SVs: grouped tumours having tyfonas, BFB, and DM events that overlapped with an AmpliconArchitect cyclic call. Present: at least one event of the SV type was called in the sample. Absent: no calling of the SV event in the tumour. (f) The junction burden of simple and complex SVs in UC tumours stratified by APOBEC3-induced mutational loads. n = 71 samples split by APOBEC burden. (g) Multivariable correlation of clinical characteristics with the fraction of genome altered (FGA). n = 71 samples. (h) Enrichment of structural variants in TP53 mutant urothelial cancers. (Left) The fraction of genome altered is significantly higher (P = 1.5 × 10−5) in TP53-mutant UC tumours compared to TP53-wild-type (WT) tumours. n = 71 samples split by TP53 mutational status. (Right) 42 tumours harbouring TP53 high and moderate-impact mutations exhibited a significant increase in the number of total junctions (P = 4.9 × 10−7), deletions (P = 0.0028), duplications (P = 2 × 10−7), chromoplexy (P = 0.0036), TIC (P = 0.0086), and BFB (P = 4.6 × 10−5) compared to 28 TP53-wild-type tumours. (c-h), each dot represents one sample. (i) The bar plot depicts the proportion of JaBbA events that overlapped with AmpliconArchitect’s cyclic calls. (j) Comparison of one-way overlaps between JaBbA and AmpliconArchitect. Each point is an AmpliconArchitect ecDNA-forming SV event. Dotted lines indicate nested cutoffs. (k) Individual JaBbA event (x axis) with multiple overlapping nested AmpliconArchitect ecDNA-forming SV calls (y axis). ‘Nested’ is defined as ≥ 90% one-way AmpliconArchitect overlap and ≤ 30% one-way JaBbA overlap. Source Data
Extended Data Fig. 5
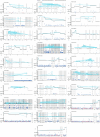
Extended Data Fig. 5. APOBEC3 and platinum chemotherapy-induced mutagenesis in ecDNA-forming SVs.
The graphs depict 28 ecDNA-forming SV events having at least one kyklonic event in addition to the events depicted in Fig. 2g. CN track: JaBbA genome graph showing CN for rearranged DNA segments (grey vertices) with SV junctions (aqua blue edges) within circular ecDNA-forming SV events. Kyklonas track: normalized VAF of APOBEC3-induced kyklonas. Non-clustered track: normalized VAF of non-clustered mutations assigned to APOBEC3-induced and platinum chemotherapy-induced signatures on ecDNA-forming SV. Chr: chromosome. Source Data
Extended Data Fig. 6
Extended Data Fig. 6. Mutational profiles of ecDNA-forming SVs.
(a) Mutational profiles of all mutations on ecDNA-forming SVs. (Top) SNV count and (Bottom) Mutational signature contributions to each sample with ecDNA-forming SV/VAF tranche combination. Only sample/VAF tranche combinations >100 mutations are displayed. Signatures with less than 10% contribution for a sample are marked as “Other”. (b) Comparison of APOBEC mutational burden between ecDNA-forming SV and non-ecDNA-forming SV regions within 27 samples harbouring at least one ecDNA-forming SV event. Two-sided paired Wilcoxon test. Source Data
Extended Data Fig. 7
Extended Data Fig. 7. CCND1 is commonly involved in recurrent putative ecDNA-forming complex SVs in urothelial carcinoma.
(a) Manhattan plot showing the significantly recurrent breakpoints (SRBs) identified by FishHook and their distance to the nearest Cancer Gene Consensus (CGC) genes in UC whole-genome sequences. Each dot represents an FDR-adjusted (Benjamini-Hochberg) P value, and a cutoff of 0.25 (horizontal solid line) was used to nominate significant hits. (b) JaBbA-classified SV events were overlapped with FishHook SRB hits to identify the frequency and class of SV events occurring in significantly recurrent breakpoint regions with the nearest CGC genes (left y axis) in each tumour (x axis). The panel was arranged by decreasing the total number of SV events in a particular chromosomal region. (c) Combined genome graphs of AmpliconArchitect (top track) with JaBbA (CN and read depth tracks). AmpliconArchitect classifies cyclic amplicons. JaBbA tracks show the chromosomal locations and copy-number alteration for DNA segments (black vertices) and the corresponding JaBbA SV events (coloured edges) in 4 samples with ERBB2 ecDNA amplification. CN: copy number, Chr: chromosome, BFB: breakage-fusion-bridge, TIC: templated-insertion chain. (d) Kaplan–Meier survival curves of overall survival (OS) (left) and disease-free survival (DFS) (right) in the TCGA Pan-Cancer Atlas stratified by CCND1 alteration and log-rank test P values showing worse OS and DFS in patients harbouring CCND1 alterations (gain and amplification). Source Data
Extended Data Fig. 8
Extended Data Fig. 8. Genetic maps of CCND1 ecDNA-forming structural variants.
(a) The putative reconstruction of representative ecDNA-forming SV amplicons harbouring CCND1 across the cohort. From the innermost to outermost ring: FANTOM5 promoters (promoters located on the positive strand in red, and minus strand in blue), FANTOM5 enhancers, super-enhancers, coverage, and oncogene models. Coverage is normalized by segment dosage. Gene directionality reflects transcription orientation relative to segment orientation. WCM: WCMIVG. (b) Visualization of the genic and regulatory elements contained within the commonly amplified region shared between CCND1 ecDNA-forming SVs. From top to bottom, tracks include GRCh38 coordinates, the 204 Kb common ecDNA region, NCBI RefSeq gene models, FANTOM5 transcription start site (TSS) peak, ENCODE H3K27Ac, H3K4Me1, and H3K4Me3 histone marks. Chromosome 11 regions involved in ecDNA amplicons are coloured purple. (c) Schematic of Oxford Nanopore Technologies (ONT) long-read WGS of a patient-derived bladder cancer tumour (WCMIVG101), followed by Flye read assembly to reconstruct ecDNA amplicons. (d) Circos plot reconstruction of a CCND1-ecDNA from ONT long-read sequencing. Annotation from inside to outside: assembled contiguous segment size, FANTOM5 promoters, FANTOM5 enhancers, super-enhancers, selected genes, coverage, and circular assembly aligned to GRCh38. (e) Read length and count of split-read alignments supporting both ends of the circularizing junctions of the assembled CCND1-ecDNA. Source Data
Extended Data Fig. 9
Extended Data Fig. 9. Putative reconstruction of ecDNA-forming SV amplicons across 50 bladder cancer patients.
Starting from the innermost ring, annotations include FANTOM5 promoters (promoters located on the positive strand are coloured red, and those on the minus strand are coloured blue), FANTOM5 enhancers, super-enhancers, coverage, and oncogene models. Coverage is normalized by segment dosage (e.g., the inclusion of two of the same genomic segments will halve the displayed coverage). The directionality of the genes corresponds to the direction in which they are transcribed relative to the orientation of the segment. Source Data
Extended Data Fig. 10
Extended Data Fig. 10. CCND1 amplification in UC tumour and UMUC3 cell line.
(a) Interphase FISH demonstrating CCND1 amplification (ratio >2) (left). n = 1 independent experiment. JaBbA and AmpliconArchitect reconstruction of a CCND1 ecDNA-forming SV event in WCMIVG101 UC tumour (right). (b) Metaphase FISH showing CCND1 chromosomal gain in UMUC3 bladder cancer cell line. Centromeric Ch11 (red) and CCND1 signals (green). n = 1 independent experiment. (c) Composite bar chart illustrating the mean cell cycle proportions of UMUC3 bladder cancer cells with episomal CCND1 compared to control cells. The cell cycle phases (G1, S, and G2/M) were quantified using flow cytometry of cells stained with DAPI and compared between cells with episomal CCND1 and controls under no-drug and cisplatin treatment conditions. Statistical significance was determined using a two-sided unpaired student’s t-test with FDR adjustment from six replicates. Source Data

References

    1. Faltas, B. M. et al. Clonal evolution of chemotherapy-resistant urothelial carcinoma. Nat. Genet.48, 1490–1499 (2016). - PMC - PubMed
    1. Hadi, K. et al. Distinct classes of complex structural variation uncovered across thousands of cancer genome graphs. Cell183, 197–210.e32 (2020). - PMC - PubMed
    1. Swanton, C., McGranahan, N., Starrett, G. J. & Harris, R. S. APOBEC enzymes: mutagenic fuel for cancer evolution and heterogeneity. Cancer Discov.5, 704–712 (2015). - PMC - PubMed
    1. Alexandrov, L. B. et al. The repertoire of mutational signatures in human cancer. Nature578, 94–101 (2020). - PMC - PubMed
    1. Roberts, S. A. et al. An APOBEC cytidine deaminase mutagenesis pattern is widespread in human cancers. Nat. Genet.45, 970–976 (2013). - PMC - PubMed

MeSH terms