. 2024 Oct;634(8036):1204-1210.
doi: 10.1038/s41586-024-07990-0. Epub 2024 Oct 9.

Biomolecular condensates mediate bending and scission of endosome membranes

Affiliations

Biomolecular condensates mediate bending and scission of endosome membranes

Yanning Wang et al. Nature. 2024 Oct.

Abstract

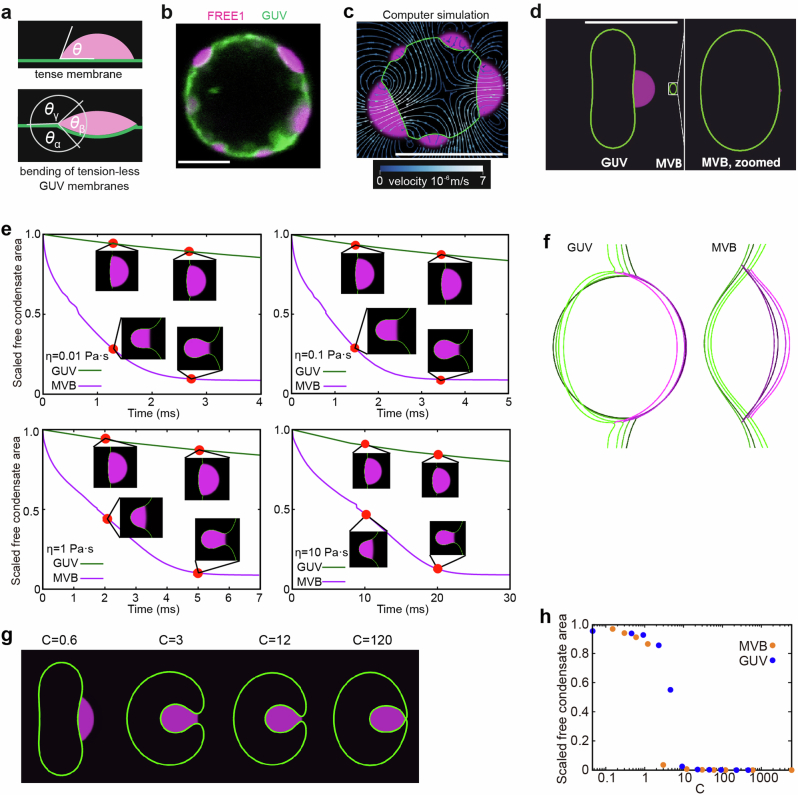
Multivesicular bodies are key endosomal compartments implicated in cellular quality control through their degradation of membrane-bound cargo proteins1-3. The ATP-consuming ESCRT protein machinery mediates the capture and engulfment of membrane-bound cargo proteins through invagination and scission of multivesicular-body membranes to form intraluminal vesicles4,5. Here we report that the plant ESCRT component FREE16 forms liquid-like condensates that associate with membranes to drive intraluminal vesicle formation. We use a minimal physical model, reconstitution experiments and in silico simulations to identify the dynamics of this process and describe intermediate morphologies of nascent intraluminal vesicles. Furthermore, we find that condensate-wetting-induced line tension forces and membrane asymmetries are sufficient to mediate scission of the membrane neck without the ESCRT protein machinery or ATP consumption. Genetic manipulation of the ESCRT pathway in several eukaryotes provides additional evidence for condensate-mediated membrane scission in vivo. We find that the interplay between condensate and machinery-mediated scission mechanisms is indispensable for osmotic stress tolerance in plants. We propose that condensate-mediated scission represents a previously undescribed scission mechanism that depends on the physicomolecular properties of the condensate and is involved in a range of trafficking processes. More generally, FREE1 condensate-mediated membrane scission in multivesicular-body biogenesis highlights the fundamental role of wetting in intracellular dynamics and organization.


Conflict of interest statement

The authors declare no competing interests.

Figures

Fig. 1
Fig. 1. FREE1 phase separates in vitro and forms functional condensates in vivo.
a, The protein domain structures of FREE1 and its variants (top). Bottom, intrinsically disordered and prion-like regions were predicted using the PONDR and PLAAC algorithms. b, In vitro phase-separation assay of 2.5 µM GFP-labelled FREE1 variants. c, Phase diagrams of FREE1 variants. The red dots indicate LLPS. The empty circles indicate no LLPS. d, Coalescing FREE1 condensates. Left, time-course imaging. Right, circularity of fusing condensates over time. The final diameter of condensates is 10–14 µm. Data are mean ± s.d. n = 7 condensates. e, FREE1 condensates in vivo. Left, representative images of A. thaliana protoplasts expressing GFP-labelled FREE1 variants. Right, quantification of the condensate number per cell. Black lines indicate the median. P values were calculated using two-tailed t-tests. n = 50, 53 and 53 protoplasts, respectively. The asterisks indicate significant differences. f, Seven-day-old A. thaliana seedlings of the indicated genotypes. Representative images of n = 3 (b, d and e) and n = 2 (f) independent experiments. Scale bars, 5 µm (b, d and e) and 1 cm (f). Source Data
Fig. 2
Fig. 2. FREE1 condensates bind to membranes and partition ESCRTs.
a, FREE1 condensation on wortmannin-induced large MVBs in A. thaliana root tip cells expressing GFP–FREE1 and the MVB marker mCherry–RHA1. b, Treatment of wortmannin-enlarged MVBs as described in a with 1,6-hexanediol (left). Right, the number of FREE1 condensates per MVB. Data are mean ± s.d. P values were calculated using two-tailed t-tests; asterisks indicate significant differences. n = 72, 68 and 68 protoplasts, respectively. c, Overview of the membrane flotation assay. d, Quantification of membrane-bound (MB) proteins indicated in c as determined by immunoblotting. ND, no signal detected. Data are mean ± s.e.m. P values were calculated using two-tailed t-tests. n = 3 experiments. The gel blot is shown in Extended Data Fig. 4d. e, Enhanced VPS23 association with membranes in the presence of FREE1 but not FUS-IDR–FREE1 condensates. The assay was performed as in d. Data are mean ± s.e.m. P values were calculated using two-tailed t-tests. n = 3 experiments. f, VPS23 (mCherry labelled) partitioning by FREE1 condensates in vitro. FREE1(ΔIDR) condensates formed at 10× concentration compared with FREE1. Data are mean ± s.d. P values were calculated using two-tailed t-tests; asterisks indicate significant differences. n = 45, 30 and 45 condensates, respectively. g, Colocalization of VPS23 (mCerulean labelled) with condensates of FREE1 variants in protoplasts. Data are mean ± s.d. P values were calculated using two-tailed t-tests; asterisks indicate significant differences. n = 14, 14 and 12 protoplasts, respectively. h, Accumulation of total ubiquitinated proteins in 10-day-old seedlings as determined by immunoblotting. Representative images of n = 3 (a) and n = 2 (h) independent experiments. Scale bars, 1 µm (a and b) and 5 µm (f). The unprocessed blots are provided in Supplementary Fig. 1. The schematic in c was created using Adobe Illustrator. Source Data
Fig. 3
Fig. 3. FREE1 condensates mediate ILV biogenesis by membrane wetting.
a, Mammalian COS-7 cells expressing the indicated proteins. Left, representative transmission EM (TEM) images. Scale bars, 100 nm. Right, ILV quantification. Data are mean ± s.d. P values were calculated using two-tailed t-tests; asterisks indicate significant differences. n = 64, 54 and 41 cells, respectively. b, Abbreviated phylogenetic tree of FREE1 homologues (Extended Data Fig. 6a) and the domain structure of FREE1 homologues. CC, coiled-coil domain. c, FREE1 condensates (magenta) mediate ILV-like invaginations (arrowheads) of GUV membranes (green). Scale bar, 5 µm. Inset: magnified ILV with membrane neck. n = 3 independent experiments. d, Dynamics of ILV formation in silico for varying ambient viscosities. The scaled free-condensate area (condensate/fluid surface area with respect to initial value) decreases over time. θ = 70°; membrane tension σαγ = 1.5 mN m−1; membrane tension σαβ = surface tension σβγ = 1.1 mN m−1. Condensate viscosity ηcond = 10 Pa s; ambient (cytosol or buffer) viscosity ηambient = 0.01–10 Pa s. Condensate diameters are 2 µm and 35 nm in the GUV-like and MVB-like simulations, respectively. e, MVB-ILV formation in silico time series for conditions as in d with ηcond/ηambient = 1 and line tension λ = 10 pN. The neck radius is 1.5 nm. Source Data
Fig. 4
Fig. 4. FREE1 condensates scission membranes.
a, Theoretical stability diagram of condensate-induced membrane scission as a function of line tension and variable ILV size. The blue line indicates the critical scission line tension λ*. Critical neck constriction force f* = 25 pN; bending rigidity κ = 10−19 J; DMVB = 200 nm. The grey dashed line indicates DILV = 35 nm. b, FREE1-condensate-filled (magenta) ILV freely diffusing inside the GUV (green) shown in Fig. 3c at a later timepoint. Inset: magnified ILV. Confocal section. Scale bar, 5 µm. c, Representative embryos at the indicated stages. Scale bars, 50 µm. d, Statistical analyses of the length of cotyledons and percentage of embryos arrested at different stages. The black lines indicate the median (left). Data are mean ± s.d. (right). P values were calculated using two-tailed t-tests; asterisks indicate significant differences. n = 3 experiments. e, Left, TEM images of MVBs in early-stage embryos of the indicated genotypes. Scale bars, 100 nm. Right, quantification of the number of ILVs per MVB. The black lines indicate the median. P values were calculated using two-tailed t-tests; asterisks indicate significant differences. n = 14 MVBs. Representative images of n = 3 independent experiments (b and c). Source Data
Fig. 5
Fig. 5. FREE1 condensation is indispensable for osmotic tolerance.
a, A. thaliana root tip cells expressing FREE1 were subjected to acute hyperosmotic treatments. Left, confocal sections. Right, the number of FREE1 condensates per cell. The black lines indicate the median. P values were calculated using two-tailed t-tests; asterisks indicate significant differences. n = 105 cells. b, A. thaliana seedlings germinating and growing under hyperosmotic conditions. Left, images of plants at 10 days. Right, survival rates. Data are mean ± s.d. P values were calculated using two-tailed t-tests; asterisks indicate significant differences. n = 3 experiments. Scale bars, 5 µm (a) and 1 cm (b). c, Diagram of FREE1-variant domain structures. The red sections indicate the PTAP-like motifs that mediate interactions with VPS23. d, A model of ESCRT-machinery-dependent and FREE1-condensate-mediated (magenta) ILV formation pathways from MVB membranes (green). i, membrane invagination; ii, membrane scission. Blue Y shapes indicate ubiquitinated cargoes. The schematic in d was created using Adobe Illustrator. Source Data
Extended Data Fig. 1
Extended Data Fig. 1. Identification of FREE1 as a phase separation-prone protein.
a, ESCRT components enriched by b-isox treatment of ten-day-old A. thaliana Col-0 seedlings (FREE1) or N. bethamiana leaves transiently expressing FLAG-tagged proteins. b, Immunoblot analyses of ESCRT proteins in total cell extracts, the lysates following b-isox enrichment (Sup) and b-isox precipitates using FREE1 or FLAG antibodies. Tubulin served as a loading control. c, Predicted intrinsically disordered regions by PONDR. d, Confocal microscopy images of GFP–FREE1 and mCherry-tagged ESCRT proteins at 5 µM concentration in 40 mM Tris-HCl pH 7.4, 150 mM NaCl. Scale bars, 5 µm. Representative images of 3 independent experiments. The unprocessed blots are provided in SI Fig. 1.
Extended Data Fig. 2
Extended Data Fig. 2. FREE1 and its variants phase separate in vitro and in vivo.
a,b,k, Confocal microscopy images of GFP–FREE1 (a), unlabelled FREE1 (b), and GFP–FUS-IDR–FREE1 (k) condensates formed at indicated protein and salt concentrations. c, Time lapse imaging of unlabelled FREE1 condensate coalescence. Scale bars, 5 µm. d, FRAP of FREE1 condensates. Top, first and last post-FRAP frames. Bottom, recovery kymograph (fire lookup table). Green scale bar, 5 s. e, Removal of MBP by TEV cleavage allows FREE1 LLPS. f, Treatment of FREE1 condensates in A. thaliana protoplast cells with 1,6-hexanediol. g, FREE1 condensates in COS-7 cells. h, Percentage of different amino acids classes within IDRs used in this study. i, Disorder of the prion-like domain predicted by the PLAAC algorithm. j, In vitro phase separation assay of 10 µM GFP-labelled FREE1 variants. Representative images of n independent experiments (n = 3 (a-g,j,k)). Scale bars, 5 µm.
Extended Data Fig. 3
Extended Data Fig. 3. Characterization of transgenic plants expressing chimeric FREE1 variants.
a, Illustration of the genomic FREE1 locus (top panel) and transgenic FREE1 constructs (bottom panel). Thick black boxes indicate exons, thin black boxes indicate UTRs and black lines indicate introns. Primers for genotyping are indicated by red arrows. b,f, Electrophoresis of PCR genotyping products using primers as indicated. c,d, Photographs of 3-week-old (c) and 6-week-old (d) plants of indicated genotypes. Scale bars, 2 cm. e, Seven-day-old A. thaliana seedlings of indicated genotypes. Scale bar, 1 cm. Representative images of n independent experiments (n = 2 (b,f), n = 3 (c-e)). For b and f, the unprocessed gels are provided in SI Fig. 1.
Extended Data Fig. 4
Extended Data Fig. 4. FREE1 condensates localise to PI3P-containing membranes in vivo and in vitro.
a, b, Confocal microscopy image showing the localization of FREE1 on the surface (a) and within (b) wortmannin-enlarged MVBs in A. thaliana root tip cells. c, Dot blot assay showing the binding of condensing and non-condensing FREE1 to PI3P. d, g, Immunoblot of total (T) and membrane-bound (MB) proteins. TEV protease cleavage of the solubility tag induces LLPS. e, Ion chromatogram (XIC) of PI3P peak at Rt = 4.79 min, separated from PI4P or PI5P peak at Rt = 5.67 min obtained from injecting indicated lipid extract (details of sample preparation is discussed in methods). f, Normalised PI3P levels. Error bars indicate mean ± SD. Wortmannin treatment reduced PI3P levels to 18.8% ± 1.4%. P values are indicated (two-tailed t test, n = 3 experiments). Asterisks indicate significant differences. h, Expression of FREE1 variants in Saccharomyces cerevisiae. Indicated variants of GFP–FREE1 (green) were expressed under the control of the GAP1 promoter and observed by confocal fluorescence microscopy (upper panels). Prior to visualization, yeast vacuolar membranes were stained with FM4-64 dye (magenta). Scale bars, 5 µm (white), 1 µm (yellow). Representative images of n independent experiments (n = 3 (a-e, g, h)). For c, d and g, the unprocessed blots are provided in SI Fig. 1. Source Data
Extended Data Fig. 5
Extended Data Fig. 5. Phase-separated FREE1 condensates partition ESCRT-I subunits.
a, Immunoblot of total (T) and membrane-bound (MB) VPS23. TEV protease cleavage of the MBP solubility tag induces LLPS (see Fig. 2e). b, Confocal microscopy images of A. thaliana protoplast cells co-expressing VPS23 with FREE1 variants (see Fig. 2g). c, Bottom panel, confocal microscopy images showing the enrichment of purified VPS proteins (magenta font and image, with C-terminal mCherry tags) by partitioning to FREE1 condensates (green font and image). Unlabelled VPS proteins (black) were added as indicated. Top panel, quantification of 561-nm emission (magenta) inside and outside of FREE1 condensates. Black dashed lines indicate median. P values are indicated (two-tailed t test, n = 32, 25, 34, 24, 28, 42 condensates, respectively). Asterisks indicate significant differences. d, Interactions between FREE1 variants and VPS23 as determined by yeast two hybrid assay. E.V., empty vector. e, Left, confocal microscopy images of indicated protoplast cells co-expressing VPS23 with RHA1. Right, quantification of the colocalization coefficient between VPS23 and RHA1. Error bars indicate mean ± SD. P values are indicated (two-tailed t test, n = 39, 38 cells, respectively). Asterisk indicates significant difference. Scale bars, 5 µm. Representative images of n independent experiments. (n = 3 (a-e)). For a, the unprocessed blots are provided in SI Fig. 1 Source Data.
Extended Data Fig. 6
Extended Data Fig. 6. FREE1 is conserved in land plants.
a, Phylogenetic tree of FREE1 homologs from indicated species. b, Multiple sequence alignment of FREE1 homologs from indicated species. c, A table showing the enrichment of FREE1 homologs by b-isox. d, Domain structure of FREE1 homologs. IDRs were predicted by PONDR.
Extended Data Fig. 7
Extended Data Fig. 7. Computer simulations of condensate-membrane wetting and ILV formation.
a, Capillary forces deform tension-free membranes. θ was computed via three contact angles of tension-less GUVs. b, FREE1 condensates (magenta) wet GUV membranes (green). These data were used to determine the wetting contact angle θ = 70° ± 20° (n = 11 condensates). c, Dynamic remodelling of GUV wetted by several 1–3 µm sized condensates assuming θ = 70°. Two-dimensional computer simulation allowed modelling the wetting of multiple condensates on a single GUV. Membrane tension σαγ = 1.5 mN/m, membrane tension σαβ = surface tension σβγ = 1.1 mN/m, viscosity η = 10 Pas. Streamlines coloured by velocity magnitude indicate capillary force-induced fluid flow, which the membrane follows consistently (there is no flow through the membrane). d, Initial state of axisymmetric 3D simulations to assess ILV formation dynamics. Condensate half circles were placed onto bending energy minimizing MVB and GUV shapes, which were determined by running condensate-free simulations. See also Supplementary Videos 1 & 2. e, Dynamics of condensate-mediated ILV formation in MVBs (magenta lines) and GUVs (green lines) for varying ambient viscosities ηambient = 0.01-10 Pas. Insets show intermediate morphologies as indicated. Scaled free condensate areas (ratio of condensate/fluid surface with respect to initial value) decrease over time. θ = 70°, membrane tension σαγ = 1.5 mN/m, membrane tension σαβ = surface tension σβγ = 1.1 mN/m, condensate viscosity ηcond = 10 Pas, ambient (cytosol or buffer) viscosity ηambient = 0.01-10 Pas. Condensate diameters are 2 µm and 35 nm in the GUV-like and MVB-like simulations, respectively. Obtained stationary neck radius is 6.5 nm for MVB. f, 3D simulation snapshots comparing membrane (green) and condensate (magenta) surface shapes at free condensate area = 0.5 and ηcondambient = 1 (darkest) to ηcondambient = 1000 (lightest). g, Stationary 3D shapes for wetting simulations of a large, single condensate (2 µm) and a GUV with increasing value of the parameter C=σβγDILV2/κ. h, Scaled free condensate area (ratio of condensate/fluid surface with respect to its initial value) demonstrates dependence of condensate invagination on C. Transition occurs at C≈1 for small MVB-sized (orange) and large GUV-sized (blue) condensates.
Extended Data Fig. 8
Extended Data Fig. 8. Line tension increases neck formation dynamics and induces membrane scission.
a, Dynamics of ILV formation for varying line tensions. Scaled free condensate area (ratio of condensate/fluid surface with respect to initial value) decreases over time. θ = 70°, membrane tension σαγ = 1.5 mN/m, membrane tension σαβ = surface tension σβγ = 1.1 mN/m. Viscosities ηcond = 10 Pas, ηambient = 0.01-10 Pas. Condensate diameter is 35 nm. b, Theoretical stability diagram of condensate-induced membrane scission for varying MVB size. Blue line, critical scission line tension λ*. Critical neck constriction force f* = 25 pN, bending rigidity κ = 10−19 J, DILV = 35 nm. Grey dashed line indicates DMVB = 200 nm. c, Theoretical stability diagram of condensate-induced membrane scission and varying membrane spontaneous curvature. Blue line, critical scission line tension λ*. Critical neck constriction force f* = 25 pN, bending rigidity κ = 10−19 J, DMVB = 200 nm, DILV = 35 nm. d-f, The line tensions required for scission for inward budding (solid line) and outward budding (dashed line) at three physiologically relevant condensate sizes (30 nm, 300 nm and 3000 nm) and a range of relative membrane sizes. Source Data
Extended Data Fig. 9
Extended Data Fig. 9. Phase separated FREE1 condensates wet membranes and form ILVs in cells.
a, Representative electron microscopy images of immunogold-labelled samples using GFP antibodies in COS-7 cells expressing GFP–FREE1. b, Mammalian COS-7 cells co-expressing full-length FREE1 or FREE1(∆IDR) with Rab5Q79L were fixed and imaged using a super resolution (structured illumination) microscope. c, Left, TEM analysis of MVBs in A. thaliana root cells of the indicated genotypes. Right, quantification of the diameter of ILVs. n = 90, 36, 47 MVBs, respectively. Error bars indicate mean ± SD. Asterisks indicate significant differences (P values are indicated, two-tailed t tests). d, Imaging of immuno-gold labelled of GFP–FUS-IDR–FREE1 in A. thaliana vps2.1 knock-out embryo cells. Representative images of n independent experiments. (n = 3 (a-d)). Scale bars, 1 µm (white), 100 nm (black).
Extended Data Fig. 10
Extended Data Fig. 10. The role of FREE1 condensation during osmotic stress.
a,b, Accumulation of FREE1 protein (a) and mRNA (b) upon NaCl treatment. c,d, A. thaliana seedlings subjected to abscisic acid (c) and osmotic (d) treatments. Left panels, images of ten-day-old A. thaliana plants. Right panels, individual survival rates (with mean ± SD). P values are indicated (two-tailed t test, n = 3 experiments). Asterisks indicate significant differences. e, Interactions between FREE1 variants and VPS23 as determined by the yeast two hybrid assay. f, VPS23 partitioning in condensates of FREE1 variants. Left, confocal images. Right, quantification of partitioning. Error bars indicate mean ± SD. P values are indicated (two-tailed t test, n = 30 condensates). Asterisks indicate significant differences. Representative images of n independent experiments (n = 2 (a, e), n = 3 (b)). Scale bars, 5 µm (white), 1 cm (black). For a, the unprocessed blots are provided in SI Fig. 1. Source Data

Comment in

References

    1. Hanson, P. I. & Cashikar, A. Multivesicular body morphogenesis. Annu. Rev. Cell Dev. Biol.28, 337–362 (2012). - PubMed
    1. Pfitzner, A. K., Moser von Filseck, J. & Roux, A. Principles of membrane remodeling by dynamic ESCRT-III polymers. Trends Cell Biol.31, 856–868 (2021). - PubMed
    1. Raiborg, C. & Stenmark, H. The ESCRT machinery in endosomal sorting of ubiquitylated membrane proteins. Nature458, 445–452 (2009). - PubMed
    1. Alonso, Y. A. M., Migliano, S. M. & Teis, D. ESCRT-III and Vps4: a dynamic multipurpose tool for membrane budding and scission. FEBS J.283, 3288–3302 (2016). - PubMed
    1. Henne, W. M., Buchkovich, N. J. & Emr, S. D. The ESCRT pathway. Dev. Cell21, 77–91 (2011). - PubMed

MeSH terms

Substances

LinkOut - more resources