. 2024 Oct;634(8034):626-634.
doi: 10.1038/s41586-024-08016-5. Epub 2024 Oct 9.

Single-neuron representations of odours in the human brain

Affiliations

Single-neuron representations of odours in the human brain

Marcel S Kehl et al. Nature. 2024 Oct.

Abstract

Olfaction is a fundamental sensory modality that guides animal and human behaviour1,2. However, the underlying neural processes of human olfaction are still poorly understood at the fundamental-that is, the single-neuron-level. Here we report recordings of single-neuron activity in the piriform cortex and medial temporal lobe in awake humans performing an odour rating and identification task. We identified odour-modulated neurons within the piriform cortex, amygdala, entorhinal cortex and hippocampus. In each of these regions, neuronal firing accurately encodes odour identity. Notably, repeated odour presentations reduce response firing rates, demonstrating central repetition suppression and habituation. Different medial temporal lobe regions have distinct roles in odour processing, with amygdala neurons encoding subjective odour valence, and hippocampal neurons predicting behavioural odour identification performance. Whereas piriform neurons preferably encode chemical odour identity, hippocampal activity reflects subjective odour perception. Critically, we identify that piriform cortex neurons reliably encode odour-related images, supporting a multimodal role of the human piriform cortex. We also observe marked cross-modal coding of both odours and images, especially in the amygdala and piriform cortex. Moreover, we identify neurons that respond to semantically coherent odour and image information, demonstrating conceptual coding schemes in olfaction. Our results bridge the long-standing gap between animal models and non-invasive human studies and advance our understanding of odour processing in the human brain by identifying neuronal odour-coding principles, regional functional differences and cross-modal integration.


Conflict of interest statement

K.O. is currently employed by dsm-firmenich. The company had no influence on the study design or interpretation of the results and did not provide any financial support. The other authors declare no competing interests.

Figures

Fig. 1
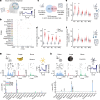
Fig. 1. Odours modulate human PC and MTL firing.
a, Odours activate olfactory sensory neurons (OSNs), which project to the olfactory bulb (OB). OB neurons innervate the PC, amygdala (Am) and putatively EC, which is connected to hippocampus (Hp) and PHC. b, Innermost clinical electrodes projected to the MNI-ICBM152 template. Sites are coloured as in a. c, The post-implantation computed tomography (CT) scan, co-registered onto the pre-implantation MRI scan, visualizes Behnke–Fried electrodes (left). Right, schematic (top right) and scalpel-trimmed microwire (bottom right; scanning electron microscopy (SEM)). Scale bar, 20 µm. d, Respiratory depth (mean ± s.e.m.) aligned to odour delivery. n = 13 sessions. a.u., arbitrary units. e, The odour rating and identification task: 15 odours (+1 odourless control) were presented 8 times in a pseudorandom order. Rating: during four presentation cycles, the participants rated (like or dislike) each odour. Identification: next, the participants identified the correct odour (four options; four times per odour). f, The behavioural performance per odour, showing ratings (left) and correct identification (right). n = 27 sessions. The box plots show the median values (centre lines), 25th–75th percentiles (box limits), and the whiskers span data within 1.5× the interquartile range. Statistical analysis of odour identification was performed using two-sided Wilcoxon signed-rank tests versus chance (25%; dashed line); for all 15 odours, P < 0.01. Colours are as in g. g, Example odour-modulated PC neuron. The firing rate varied significantly with odour identity (left; one-way analysis of variance (ANOVA), F15,112 = 13.8, P < 10−10, n = 128 trials). Right, spike-shape density (mean ± s.d.; white, polarity inverted for visualization). h, Odour-modulated neurons per session and region (mean ± s.e.m.). The PC, amygdala, EC and hippocampus host significant populations of odour-modulated neurons (PC, 39.5 ± 4.7%, n = 17 sessions, Z = 3.6, P = 0.00029; amygdala, 19.5 ± 2.7%, n = 27, Z = 4.3, P = 1.9 × 10−5; EC, 14.2 ± 3.2%, n = 22, Z = 2, P = 0.049; hippocampus, 12.1 ± 1.9%, n = 27, Z = 3.1, P = 0.0019; PHC, 5.31 ± 1.4%, n = 26, Z = −0.27, P = 0.78; two-sided Wilcoxon signed-rank tests versus chance; the dashed line indicates 5%). i, Odour-modulated neurons in the PC, amygdala, EC and hippocampus increase their firing rate (FR) after odour stimulation versus the odourless controls (PC, n = 99 neurons, Z = 5.7, P = 9.9 × 10−9; amygdala, n = 129, Z = 4.1, P = 3.4 × 10−5; EC, n = 74, Z = 2, P = 0.043; hippocampus, n = 73, Z = 2.3, P = 0.019; PHC, n = 29, Z = −0.49, P = 0.63; all compared with control: n = 404, Z = 7.0, P < 10−10; two-sided Wilcoxon signed-rank tests). The y axis displays 95% of data. j, PSTHs (odour-modulated (red) versus other (grey) neurons; 50 ms bins). Odour-modulated neurons increase firing in all regions except in the PHC (two-sided Wilcoxon signed-rank tests comparing z-scored firing rates (0–2 s after odour onset) against zero; PC, n = 99 neurons, Z = 5.8, P = 7.2 × 10−9; amygdala, n = 130, Z = 5.3, P = 1.5 × 10−7; EC, n = 74, Z = 3, P = 0.0028; hippocampus, n = 74, Z = 2.8, P = 0.005; PHC, n = 29, Z = −0.46, P = 0.64). ****P < 0.0001, ***P < 0.001, **P < 0.01, *P < 0.05. Diagrams were created using BioRender (a) and Noun Project (e).
Fig. 2
Fig. 2. Neuronal activity decodes odour identity.
a, Odour-identity decoding: neuronal spiking was used to train decoders to predict odour identity (here, the scent of orange). b, The odour-identity decoding accuracy per region. Each red dot shows the decoding performance based on 200 randomly drawn neurons (1,000 subsampling runs). The decoding performance (mean ± s.e.m.) across subsampling runs is shown in black. The grey dots indicate the decoding performance on label-permuted data. The chance level (6.25%) is indicated by the dashed horizontal line. Significance was calculated based on the percentile of mean decoding performance of the real data within the surrogate distribution (PC, P < 0.001; amygdala, P < 0.001; EC, P < 0.001; hippocampus, P < 0.001; PHC, P = 0.16; label permutation test with n = 1,000 permutations). s.e.m. margins in bd are barely visible. c, Odour-identity decoding (mean ± s.e.m.) as a function of the number of neurons included (100 subsampling runs). The horizontal bars below the dashed line (chance level) indicate neuron counts with significant odour-identity decoding (P < 0.05, right-sided Wilcoxon signed-rank tests against chance, with Bonferroni correction for different neuron counts). d, Odour-identity decoding (mean ± s.e.m.) as a function of the decoding time window beginning at odour onset (200 randomly drawn neurons, 100 subsampling runs). The horizontal bars below the dashed line (chance level) indicate the times of significant decoding performance (P < 0.05, right-sided Wilcoxon signed-rank test against chance, with Bonferroni correction for 80 time windows; beginning of sustained significant decoding: PC, 350 ms; amygdala, 400 ms; EC, 850 ms; hippocampus, 1,100 ms; PHC, 1,650 ms). e, The odour decoding performance (mean ± s.e.m., black) per recording session and region (coloured dots). Despite the limited and variable neuron counts per session, odour identity could be decoded significantly above chance (6.25%, dashed line) in the PC, amygdala, EC and hippocampus (PC, 14 out of n = 17 sessions showed significant decoding compared to 1,000 odour-label-permuted data, P < 10−10; amygdala, 13 out of n = 27, P = 1.3 × 10−10; EC, 5 out of n = 21, P = 0.0032; hippocampus, 6 out of n = 27, P = 0.0019; PHC, 1 out of n = 24, P = 0.71; right-sided binomial test, Pchance = 0.05, regions with ≥2 neurons). Diagrams were created using BioRender (a) and Noun Project (a).
Fig. 3
Fig. 3. Odour representations vary in sparseness and are suppressed by repetition.
a, The population sparseness index for each of the 15 odours across regions containing odour-modulated neurons (odours are colour coded as in Fig. 1; mean ± s.e.m. (black)). The sparseness of odour coding significantly differed across regions (one-way ANOVA, F3,56 = 505, P < 10−10). PC exhibited a less sparse odour code than MTL regions (P < 0.01 for all pairwise comparisons, except for amygdala versus hippocampus, for which P = 0.47, after applying Tukey’s honestly significant difference procedure). b, The average response strength (mean ± s.e.m.) of odour-modulated neurons for repeated odour presentations across regions containing odour-modulated neurons. Insets: the response slopes per region (mean ± s.e.m.). Significance was calculated based on a two-sided Wilcoxon signed-rank test against a constant response strength, that is, a slope of zero (PC, n = 99 neurons, Z = −3.4, P = 0.00081; amygdala, n = 130, Z = −4.5, P = 6.9 × 10−6; EC, n = 74, Z = −1.7, P = 0.087; hippocampus, n = 74, Z = −2.4, P = 0.019). Firing of PC neurons substantially decreased from the first to the second odour presentation (two-sided Wilcoxon signed-rank tests comparing firing rates of the first versus second trial in PC: n = 99 neurons, Z = 4.9, P = 8.6 × 107; Extended Data Fig. 7e). NS, not significant.
Fig. 4
Fig. 4. Amygdala neurons encode odour valence and the hippocampus predicts behavioural odour-identification performance.
a, The participants rated odours as liked or disliked. b, Spike-shape density (mean ± s.d.) of an amygdala neuron. c, This neuron increased firing to liked versus disliked odours (two-sided Wilcoxon rank-sum test comparing the z-scored firing rates 0–2 s after odour onset; n = 46 versus n = 18, Z = 2.1, P = 0.034). Bottom, PSTH for liked and disliked odours (mean ± s.e.m., 1 s bins). d, Firing rates (z-scored, mean ± s.e.m.) of odour-modulated neurons in response to liked versus disliked odours. Only the amygdala exhibited a significant difference of subjective preference (two-sided Wilcoxon signed-rank tests; PC, n = 99 odour-modulated neurons, Z = −0.76, P = 0.44; amygdala, n = 130, Z = 2.9, P = 0.004; EC, n = 74, Z = −0.37, P = 0.71; hippocampus, n = 74, Z = −0.61, P = 0.54; PHC, n = 29, Z = −1.6, P = 0.11). The y axis displays 95% of data. e, Averaged firing of odour-modulated amygdala neurons (z-scored) correlated with standard odour-valence ratings (Spearman correlation, n = 15 odours, r = 0.56, P = 0.03, two-sided permutation test). This correlation was observed in a significant number of sessions (6 out of n = 27, P = 0.002) and participants (4 out of n = 17, P = 0.009, one-sided binomial test, Pchance = 0.05). Linear regressions (black) with 95% confidence intervals (grey). f, Odour identification: the participants chose the odour label. g, Neuronal odour-decoding accuracy and behavioural odour-identification performance across regions and sessions (coloured dots). The decoding accuracy in the hippocampus was positively correlated with behavioural odour-identification performance across sessions (Spearman correlation, PC, n = 17 sessions, r = 0.14, P = 0.59; amygdala, n = 27, r = 0.06, P = 0.75; EC, n = 21, r = −0.12, P = 0.62; hippocampus, n = 27, r = 0.50, P = 0.0076; PHC, n = 24, r = 0.19, P = 0.38, two-sided permutation tests, regions with ≥2 neurons). Data are shown as in e. h, The difference in decoding accuracies based on chemical versus perceived (selected) odour identity. PC neurons decoded chemical odour identity more reliably, whereas hippocampal neurons predicted selected odour labels more accurately (PC, 75.8% chemical versus 22.1% perceived more accurate, Z = 19, P < 10−10; amygdala: 45.6% versus 49.7%, Z = −0.95, P = 0.34; EC, 50% versus 45.2%, Z = 1.7, P = 0.083; hippocampus, 26.7% versus 69%, Z = −16, P < 10−10; PHC, 52.2% versus 43.5%, Z = 3, P = 0.0024; two-sided Wilcoxon signed-rank tests across 1,000 subsampling runs). The y axis displays 99% of data. Diagrams were created using BioRender (a and f) and Noun Project (a and f).
Fig. 5
Fig. 5. Olfactory/visual cross-modal integration.
a, Cross-modal coding for visual and olfactory stimuli (orange scent and picture). b, Image-modulated PC neuron (one-way ANOVA of z-scored firing rates with image identity, F15,112 = 11.98, P < 10−10). c, Population of image- and odour-modulated neurons. In total, 185 image-modulated neurons were identified (P < 10−10, two-sided binomial test, k = 185, n = 1,856 neurons in olfactory and visual task, Pchance = 0.05). More neurons were odour modulated than image modulated (321 versus 185, two-proportion Z-test: Z = 6.5, P < 10−10). Both populations showed significant overlap (66 neurons, two-sided binomial test, P = 8.9 × 10−8, k = 66, n = 1,856, Pchance = (321/1,856) × (185/1,856) = 0.017). The PC and amygdala contained significantly more odour-modulated than image-modulated neurons (two-proportion Z-tests: PC, 99 versus 35 of n = 277 neurons, Z = 6.3, P = 2.2 × 10−10; amygdala, 99 versus 48 of n = 479, Z = 4.6, P = 4.8 × 10−6; EC, 36 versus 22 of n = 301, Z = 1.9, P = 0.053; hippocampus, 59 versus 49 of n = 469, Z = 1, P = 0.31; PHC: 28 versus 31 of n = 330, Z = −0.41, P = 0.68). d, The image-decoding performance based on neuronal activity was significant in all regions (statistical analysis was performed using a label permutation test with n = 1,000 permutations, as in Fig. 2b; for PC, amygdala, EC, hippocampus, all P < 0.001; for PHC, P = 0.018). e,f, The decoding performance for cross-modal decoding trained on images and evaluated on odours (d) and vice versa (e) (image to odour: PC, P = 0.002; amygdala, P = 0.007; EC, P = 0.14; hippocampus, P = 0.11; PHC, P = 0.68; odour to image: PC, P = 0.34; amygdala, P = 0.042; EC, P = 0.66; hippocampus, P = 0.22; PHC, P = 0.77, label permutation test as in d). g, An amygdala neuron that increases firing in response to banana odour, a banana image and the written word ‘banana’ (right-sided Wilcoxon rank-sum tests, comparing the pre-odour baseline firing rates (n = 128, 2 s) with the firing rates after the onsets of odours (n = 8, 2 s), images (n = 8, 1 s) and non-target odour names (n = 12, 1 s) in the identification task; banana, Podour = 6.8 × 10−8, Pimage = 1.4 × 10−7, Pname = 0.0073; orange, Podour = 0.0029; anise, Podour = 0.039). h, A PC neuron that increases firing in response to the odour of liquorice and anise. The same neuron exhibited the most pronounced response to liquorice among images and names (liquorice, Podour = 3.2 × 10−9, Pimage = 1.3 × 10−6, Pname = 5.4 × 10−8; anise, Podour = 3.1 × 10−9; cinnamon, Podour = 0.0014; peppermint, Podour = 6.5 × 10−5; fish, Pimage = 0.026; statistical analysis was performed as described in g). Diagrams were created using BioRender (a) and Noun Project (a, c and eh).
Extended Data Fig. 1
Extended Data Fig. 1. Characteristics of Behnke-Fried depth electrodes used for single-neuron recordings in the human PC and MTL.
a, Behnke-Fried depth electrode. Microwires inserted through the shaft of the hollow clinical macro electrode protrude from the tip of the electrode. The electrode features eight cylindrical clinical platin-iridium contacts. The two innermost contacts are 3 mm apart, while the remaining contacts are equidistantly spaced along the electrode. b, Illustration of the electrode geometry and dimensions. c, Scanning electron microscopy images of the tip of a microwire before (top) and after cutting (bottom).
Extended Data Fig. 2
Extended Data Fig. 2. Odour valence ratings and identification performance for each participant.
a, Mean odour ratings for each participant and odour. Odours are sorted from most to least liked (left to right) and participants are organized by average valence ratings (top to bottom). b, Average behavioural odour identification performance for each participant and odour. Odours are sorted from most to the least accurately identified (left to right) and participants are organized by their mean identification performance (top to bottom).
Extended Data Fig. 3
Extended Data Fig. 3. Odour-modulated neurons in the PC and MTL.
Examples of odour-modulated neurons across recording sites exhibiting significantly different firing rates in response to distinct odours (one-way ANOVA of z-scored firing rates with odour identity, n = 128 trials). Spike shape density plots of each neuron are shown in the top of each panel, with mean ± s.d. in white. a, PC neuron: F15,112 = 9.4, P < 10−10; b, PC neuron: F15,112 = 9.8, P < 10−10; c, PC neuron: F15,112 = 2.0, P = 0.02; d, PC neuron: F15,112 = 4.0, P = 7.8⋅10−6; e, amygdala neuron: F15,112 = 5.5; P = 3.0⋅10−8; f, amygdala neuron: F15,112 = 5.7, P = 1.4⋅10−8; g, EC neuron: F15,112 = 6.8; P = 3.1⋅10−10; h, hippocampus neuron: F15,112 = 3.4; P = 0.00012. PC, piriform cortex; Am, amygdala; EC, entorhinal cortex; Hp, hippocampus.
Extended Data Fig. 4
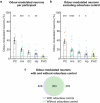
Extended Data Fig. 4. Odour-modulated neurons are reliably identified across participants and without odourless controls.
a, Same as Fig. 1h, but averaged across recording sessions per participant. Proportions of odour-modulated neurons (mean ± s.e.m.) across regions for each participant. Significant proportions of odour-modulated neurons were found in PC, amygdala, EC and hippocampus across participants (PC: 39.7 ± 6%, n = 9 participants, P = 0.002; amygdala: 19.8 ± 3.4%, n = 17, P = 0.00033; EC: 14.2 ± 3.6%, n = 15, P = 0.027; hippocampus: 10.9 ± 1.9%, n = 17, P = 0.0043; PHC: 5.14 ± 1.8%, n = 17, P = 0.79; one-sided Wilcoxon signed-rank against chance). Chance level (5%) indicated by the horizontal dashed line (see also Fig. 1h). b, Same as Fig. 1h, but excluding the odourless control. Distribution of odour-modulated neurons after omitting the neutral odour stimuli for the definition of odour-modulated neurons (PC: 36.8 ± 4.2%, n = 17 sessions, P = 0.00016; amygdala: 18.7 ± 2.6%, n = 27, P = 1.2⋅10−5; EC: 13.9 ± 3%, n = 22, P = 0.017; hippocampus: 9.83 ± 1.8%, n = 27, P = 0.011; PHC: 8.61 ± 3.9%, n = 26, P = 0.42; one-sided Wilcoxon signed-rank against chance). c, Population of odour-modulated neurons identified with and without the odourless control showed a highly significant overlap (P < 10−10 in a two-sided binomial test with k = 353, n = 2,416 neurons and Pchance = (406/2,416)⋅(378/2,416)). ****P < 0.0001, ***P < 0.001, **P < 0.01, *P < 0.05.
Extended Data Fig. 5
Extended Data Fig. 5. Odour identity, not respiration, drives odour-modulated neurons.
a, Respiration was measured with thoracic (upper, turquoise) and abdominal (lower, lilac) inductive plethysmography belts. Respiration signals were amplified and recorded using the Neuralynx ATLAS system, ensuring reliable temporal synchronization with neural recordings. b, Performance (adjusted R2) of linear regression models, predicting neuronal firing (z-scores) based on odour identity, or odour identity combined with respiration (inhalation depth). Adding respiratory information to odour identity did not significantly improve the model predictions of firing rates of odour-modulated neurons (odour identity & respiration (R2 = 0.194 ± 0.008) versus odour identity alone (R2 = 0.190 ± 0.008), n = 240 odour-modulated neurons with respiratory recordings, Z = 0.85, P = 0.39 two-sided Wilcoxon signed-rank). Thus, odour-modulated neurons are primarily driven by odour-specific differences and not variations in respiration. c, Averaged odour-locked respiratory signals for each individual recording session (mean ± s.e.m., 13 sessions with n = 128 trials each). Participants consistently inhaled once (single peak) during the first 2 seconds after odour onset (grey shaded area), the analysis time window used for identification of odour-modulated neurons. n.s. = not significant. Diagrams were created using BioRender (a) and Noun Project (a).
Extended Data Fig. 6
Extended Data Fig. 6. Decoding across individual recording sessions and participants.
a, Odour-decoding performance per participant and region. Averaging the decoding performance across all sessions per participant (mean ± s.e.m., black) demonstrated significant odour identity decoding in PC, amygdala, and EC (PC: 7 out of n = 9 participants, P = 2.6·10−8; amygdala: 10 of n = 17, P = 1.4·10−9; EC: 4 of n = 15, P = 0.0055; hippocampus: 3 of n = 17, P = 0.050; PHC: 0 of n = 16, P = 1; right-sided binomial test with Pchance = 0.05). See also Fig. 2b. b, Odour-decoding accuracy and behavioural odour-identification performance across regions and participants, averaged across sessions for each participant (coloured dots). Decoding accuracy in the hippocampus positively correlated with odour-identification performance across participants (Spearman correlation, PC: n = 9 participants, r = 0.15, P = 0.71; amygdala: n = 17, r = 0.10, P = 0.71; EC: n = 15, r = 0.01, P = 0.96; hippocampus: n = 17, r = 0.50, P = 0.043; PHC: n = 16, r = 0.15, P = 0.58, two-sided permutation test). Linear regressions (black) with 95%-confidence intervals (grey). c, Odour identification improves with more odour-modulated neurons in the hippocampus and EC. Percentage of odour-modulated neurons and performance for each recording session for different regions. Percentage of odour-modulated neurons in the EC and hippocampus is positively correlated with individual performance in the odour identification task (Spearman correlation, PC: n = 17 sessions, r = −0.04, P = 0.89; amygdala: n = 27, r = 0.15, P = 0.44; EC: n = 22, r = 0.49, P = 0.022; hippocampus: n = 27, r = 0.38, P = 0.049; PHC: n = 26, r = 0.15, P = 0.47, two-sided permutation test). Linear regressions (black) with 95%-confidence intervals (grey). d, Image-decoding accuracy (mean ± s.e.m., black) per recording session and region (coloured dots). Despite the limited and variable neuron count per session, image identity could be decoded significantly above chance (6.25%, dashed horizontal line) across sessions in PC, amygdala, EC, and hippocampus (PC: 7 out of n = 17 sessions showed significant decoding compared to 1,000 image-label-permuted data, P = 9.7⋅10−6; amygdala: 5 out of n = 20, P = 0.0026; EC: 5 out of n = 15, P = 0.00061; hippocampus: 10 out of n = 20, P = 1.1⋅10−8; PHC: 2 out of n = 17, P = 0.21; right-sided binomial test with Pchance = 0.05, regions with ≥ 2 neurons in recordings with both olfactory and visual task). e-f, Cross-modal decoding per session trained on images and evaluated on odours (e), and vice versa (f), revealed significant cross-modal coding in PC and amygdala (Image-to-odour: PC: 4 out of n = 17 sessions, P = 0.0088; amygdala: 2 out of n = 20, P = 0.26; EC: 0 out of n = 15, P = 1; hippocampus: 2 out of n = 20, P = 0.26; PHC: 0 out of n = 17, P = 1; Odour-to-image: PC: 0 out of n = 17, P = 1; amygdala: 4 out of n = 20, P = 0.016; EC: 1 out of n = 15, P = 0.54; hippocampus: 2 out of n = 20, P = 0.26; PHC: 0 out of n = 17, P = 1; right-sided binomial test with Pchance = 0.05, regions with ≥ 2 neurons in recordings with both olfactory and visual task as in (d)). ****P < 0.0001, ***P < 0.001, **P < 0.01, *P < 0.05.
Extended Data Fig. 7
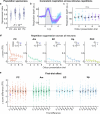
Extended Data Fig. 7. Population sparseness of odours per recording session and repetition suppression across all neurons.
a, Population sparseness index in response to odours for each recording session and odour (mean ± s.e.m. in black). Sparseness significantly differed across recording sites (one-way ANOVA, F3,1367 = 90.1, P < 10−10). All pairwise tests significant (P < 0.05) following Tukey’s honestly significant difference procedure, except the pairwise comparison of amygdala and hippocampus (P = 0.11). b, Average respiratory traces (mean ± s.e.m.) for each odour presentation (trials 1 to 8) across 13 recording sessions. c, Averaged inhalation depth (mean ± s.e.m., black) for each odour presentation (1 to 8) and recording session (coloured dots). Inhalation depth was consistent across odour repetitions (one-way ANOVA, F7,96 = 0.3, P = 0.95, n = 13 recording sessions with 8 trials each). d, Average response strength for repeated odour presentations across all recorded neurons in each anatomical region (mean ± s.e.m.). Odour repetitions are approximately 5 min apart. Insets depict the mean response slopes per region (mean ± s.e.m.). Significance is based on a two-sided Wilcoxon signed-rank against a slope of zero (PC: n = 276 neurons, Z = −3.1, P = 0.002; amygdala: n = 617, Z = −6.6, P < 10−10; EC: n = 464, Z = −4.1, P = 4.2⋅10−5; hippocampus: n = 633, Z = −6.5, P = 1.0⋅10−10; PHC: n = 418, Z = −2.4, P = 0.018, neurons with a non-zero pre-odour baseline firing rate). e, First-trial effect in the human piriform cortex. Changes in firing rates (z-scores, mean ± s.e.m. in black) of odour-modulated neurons between consecutive trials. For each region, we calculated the differences of firing rate between successive trials (i.e., 2nd-1st, 3rd-2nd,…, 8th-7th trial). Firing rate changes were significantly different across trials and regions (one-way ANOVA, F27,2611 = 3.8, P = 1.5⋅10−10, n = 377 neurons). PC neurons showed the most pronounced decline in firing rate from first to second trial, as indicated by the blue cross and error bar. All 27 pairwise comparisons (blue cross versus each of the remaining crosses) were statistically significant (P < 0.05) after Tukey’s correction for multiple comparisons across all n = 378 (binomial coefficient for selecting 2 out of 27) pair-wise comparisons. The y-axis is truncated to display 99% of the data to improve visibility. ****P < 0.0001, **P < 0.01, *P < 0.05, n.s. = not significant.
Extended Data Fig. 8
Extended Data Fig. 8. Spike-sorting and recording-quality metrics.
a, After automated spike sorting and manual verification, we identified n = 2,416 units, with an average of 2.19 ± 0.04 (mean ± s.e.m., dotted vertical line) units per channel. Only channels with at least one recorded unit were included. Cumulative density functions (CDF) per brain region are shown as coloured solid lines in the lower panels. b, Proportions of Inter-spike intervals (ISI) shorter than 3 ms. Units exhibited an average proportion of (mean ± s.e.m.) 0.36 ± 0.01% of ISI intervals below 3 ms. More than 95% of all units showed less than 1.4% of ISIs below 3 ms (dashed vertical line). c, Distribution of mean firing rates (mean ± s.e.m.: 1.62 ± 0.05 Hz, dotted vertical line). d, Spike peak amplitude SNR (mean ± s.e.m.: 11 ± 0.1, dotted vertical line). Peak SNR was calculated by dividing the peak amplitude by the standard deviation of the background activity, estimated based on the median absolute deviation (MAD) as SD = MAD/0.6745. e, Mean spike peak amplitude distribution (mean ± s.e.m.: 44.8 ± 0.5µV, dotted vertical line). f, Isolation distance (mean ± s.e.m.: 66 ± 12, for the 1786 clusters for which this measure could be calculated).
Extended Data Fig. 9
Extended Data Fig. 9. Replication of the decoding analysis after excluding the first trial.
a, Odour-identity decoding accuracy based on neuronal activity separated by region. Each red dot in the distributions shows the decoding performance based on 200 randomly drawn neurons (1,000 subsampling runs). Mean decoding performance and s.e.m. across subsampling runs are shown in black. Grey dots indicate decoding performance on label-permuted data. The dashed horizontal line indicates chance level (6.25%). Significance based on percentile of mean decoding performance of the real data in the surrogate distribution (PC: P < 0.001; amygdala: P < 0.001; EC: P < 0.001; hippocampus: P < 0.001; PHC: P = 0.12, label permutation test with n = 1,000 permutations). b, Performance of odour-identity decoding (mean ± s.e.m.) as a function of the number of neurons included in the decoding analysis using 100 subsampling runs. Horizontal bars indicate neuron counts for which decoding performance significantly exceeded chance (P < 0.05, right-sided Wilcoxon signed-rank against chance after Bonferroni correction for different neuron counts). c, Performance of odour-identity decoding (mean ± s.e.m.) as a function of the decoding time-window beginning at odour onset using 200 randomly drawn neurons and 100 subsampling runs. Horizontal bars indicate times where decoding performance significantly exceeded chance (P < 0.05, right-sided Wilcoxon signed-rank against chance after Bonferroni correction for 80 decoding time windows; beginning of sustained significant decoding: PC: 400 ms; amygdala: 350 ms; EC: 800 ms; hippocampus: 1,050 ms; PHC: 1,600 ms). d, Image-identity decoding accuracy based on neuronal activity separated by region, depicted as in (a). All regions exhibited significant decoding of image identities (PC: P < 0.001; amygdala: P < 0.001; EC: P < 0.001; hippocampus: P < 0.001; PHC: P = 0.003, label permutation test with n = 1,000 permutations, as in (a)). Decoding accuracy in PC surpassed all other regions. e-f, Decoding accuracy (as in a) for a cross-modal decoding analysis trained on images and evaluated on odours (e), and vice versa (f). (Image-to-odour: PC: P = 0.008; amygdala: P = 0.018; EC: P = 0.15; hippocampus: P = 0.1; PHC: P = 0.79; Odour-to-image: PC: P = 0.17; amygdala: P = 0.14; EC: P = 0.45; hippocampus: P = 0.28; PHC: P = 0.7, label permutation test with n = 1,000 permutations, as in (a)). PC and amygdala reached substantially higher decoding accuracies than any of the other regions in both cross-modal decoding analyses. g, Odour-decoding accuracy as a function of the number of neurons used for decoding, sampled across participants (red, mean ± s.e.m.) or within participants (blue, mean ± s.e.m. across sessions), as in Fig. 2c (100 times randomly subsampled with 8 cross-validation data splits and 10 resample runs). Chance level (6.25%) shown as dashed horizontal line. Note that with 8-32 microwires per anatomical target region, it is rarely possible to simultaneously record the activity of 30 or more neurons per participant. ***P < 0.001, **P < 0.01, *P < 0.05.

References

    1. Gottfried, J. A. Central mechanisms of odour object perception. Nat. Rev. Neurosci.11, 628–641 (2010). - PMC - PubMed
    1. McGann, J. P. Poor human olfaction is a 19th-century myth. Science356, eaam7263 (2017). - PMC - PubMed
    1. Buck, L. & Axel, R. A novel multigene family may encode odorant receptors: a molecular basis for odor recognition. Cell65, 175–187 (1991). - PubMed
    1. Murthy, V. N. Olfactory maps in the brain. Annu. Rev. Neurosci.34, 233–258 (2011). - PubMed
    1. Wilson, D. A., Chapuis, J. & Sullivan, R. M. in Handbook of Olfaction and Gustation Ch. 10 (ed. Doty, R.) 209–224 (John Wiley & Sons, 2015); 10.1002/9781118971758.ch10.

MeSH terms

LinkOut - more resources