. 2024 Oct;634(8035):804-808.
doi: 10.1038/s41586-024-08023-6. Epub 2024 Oct 9.

Quasi-periodic X-ray eruptions years after a nearby tidal disruption event

Affiliations

Quasi-periodic X-ray eruptions years after a nearby tidal disruption event

M Nicholl et al. Nature. 2024 Oct.

Abstract

Quasi-periodic eruptions (QPEs) are luminous bursts of soft X-rays from the nuclei of galaxies, repeating on timescales of hours to weeks1-5. The mechanism behind these rare systems is uncertain, but most theories involve accretion disks around supermassive black holes (SMBHs) undergoing instabilities6-8 or interacting with a stellar object in a close orbit9-11. It has been suggested that this disk could be created when the SMBH disrupts a passing star8,11, implying that many QPEs should be preceded by observable tidal disruption events (TDEs). Two known QPE sources show long-term decays in quiescent luminosity consistent with TDEs4,12 and two observed TDEs have exhibited X-ray flares consistent with individual eruptions13,14. TDEs and QPEs also occur preferentially in similar galaxies15. However, no confirmed repeating QPEs have been associated with a spectroscopically confirmed TDE or an optical TDE observed at peak brightness. Here we report the detection of nine X-ray QPEs with a mean recurrence time of approximately 48 h from AT2019qiz, a nearby and extensively studied optically selected TDE16. We detect and model the X-ray, ultraviolet (UV) and optical emission from the accretion disk and show that an orbiting body colliding with this disk provides a plausible explanation for the QPEs.


Conflict of interest statement

The authors declare no competing interests.

Figures

Fig. 1
Fig. 1. Detection of QPEs from the nearby TDE AT2019qiz.
a, Chandra images obtained from exposures on 9 and 10 December 2023. Observation times are shown in UT. Each image shows a 30 × 30-arcsec region centred on AT2019qiz. Images have been smoothed with a 2-pixel Gaussian filter for clarity. The nearby source to the SE shows a consistent flux across the three exposures. b, Light curve showing eight eruptions detected by NICER, Swift/XRT and AstroSat from 29 February 2024 to 14 March 2024 (MJD 60369 to 60383). Without stacking, the count rate between the eruptions is consistent with zero. Time delays between eruptions are labelled. The mean (standard deviation) recurrence time is 48.4 (7.2) h. c, Comparison of light-curve shapes between the Chandra eruption from December 2023 and NICER eruptions from March 2024. The fast rise and shallower decay remains consistent over several months. All error bars show 1σ uncertainties.
Fig. 2
Fig. 2. NICER time-resolved spectroscopy of the second eruption in Fig. 1b.
a, Light curve of the eruption, with the rise, peak and decay phases indicated by the colour coding. b, Fits to the spectrum during each phase, using a single-temperature blackbody model (Methods). The shaded regions are 90% confidence intervals. c, Blackbody luminosity plotted against temperature for each fit. The eruption shows an anticlockwise ‘hysteresis’ cycle in this parameter space. Error bars show the 90% confidence regions of the model posteriors. d, Blackbody radius against time, overlaid on the eruption light curve (grey). The blackbody radius increases during the eruption, with a maximum radius at the decay. We see tentative evidence in the final bin for contraction of the photosphere, which can be explained if the density and thus optical depth decrease as material expands.
Fig. 3
Fig. 3. Eruption properties in AT2019qiz compared with the other known QPE sources.
a, Mean eruption duration versus mean recurrence time. QPEs exhibit a clear correlation, with broader eruptions occurring for systems with longer recurrence times. The known QPE sources spend 24 ± 13% of their time in outburst. AT2019qiz is consistent with this trend. b, Mean recurrence time versus reported SMBH mass from host galaxy scaling relations,. AT2019qiz is completely typical of the known QPE population in terms of its SMBH mass and supports previous findings that recurrence times in QPEs are not correlated with SMBH mass. The shaded regions represent the observed ranges of durations and recurrence times, whereas for the SMBH masses, they represent the 1σ uncertainty from scaling relations used to derive the masses.
Fig. 4
Fig. 4. Multiwavelength light curves with disk model fit.
a, X-ray, UV and optical data showing the TDE in 2019 (ref. ) and the long-term disk emission. The dashed lines and shaded regions show the median and 90% confidence range of our accretion disk model fit. QPEs (dotted lines) were excluded from the fit. A potential earlier QPE is also seen in the X-ray data at about 800 days (ref. ). Our model is agnostic to the mechanism powering the initial UV/optical peak (Methods) but, by the time of the QPEs, all data are consistent with an exposed accretion disk. b, Radial surface density profiles of the best-fit model at 800 and 1,500 days after disruption (including 90% confidence range). The radius has been normalized to the circular orbit with period Torb = TQPE. The vertical lines indicate the orbital radii corresponding to periods of 1× and 2× TQPE. Both orbits cross the disk plane, showing that star–disk interactions occurring either once or twice per orbit can explain the QPEs in AT2019qiz (ref. ).
Extended Data Fig. 1
Extended Data Fig. 1. Chandra image during eruption.
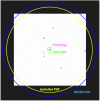
The image is 8.5 × 8.5 arcmin, with north up and east to the left. Five sources are detected within a few arcminutes of AT2019qiz. Only AT2019qiz shows statistical evidence of variability in the Chandra data (Methods). The PSFs (half-encircled energy width) of Swift/XRT and AstroSat are marked, as is the NICER field of view. None of the sources exhibit a count rate (0.3–1.0 keV) above about 10% of the count rate from AT2019qiz during eruption. Figure 1a shows a zoom-in of the central region.
Extended Data Fig. 2
Extended Data Fig. 2. Estimates of the peak times of each eruption.
Each peak has been fit separately with a skewed Gaussian function using SciPy. This takes four parameters: the mean μ of the unskewed Gaussian, the standard deviation σ, the skewness a and an arbitrary normalization. We take the maximum of the function as the time of each peak. The uncertainty in timing is given by the variance in μ. The error bars show the 1σ uncertainty in count rate.
Extended Data Fig. 3
Extended Data Fig. 3. Physical parameters from the second eruption detected with NICER.
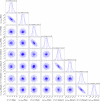
Corner plot showing posterior distributions of all free parameters from the time-resolved spectral modelling of the second NICER eruption (Fig. 2).
Extended Data Fig. 4
Extended Data Fig. 4. Fits to the quiescent spectrum of AT2019qiz and the nearby SE source.
Shaded regions show 90% confidence intervals. a, Fit to the SE source from Chandra (first and third epochs). The data are best fit with a power law with Γ = 1.8 ± 0.5. b, Fit to the quiescent spectrum from Swift/XRT. This includes flux from both sources. We fit with a power law plus a thermal disk model including colour correction (tdediscspec), using the posteriors from the SE source as the priors on the power-law component. The SE source clearly dominates the count rate above ≃1 keV. Below this, the spectrum is well fit by the thermal disk with peak temperature kTp = 67 ± 10 eV, similar to other QPE sources during their quiescent phases, and similar to X-ray-detected TDEs. The SE source contribution is shown in blue. c, Fit to the X-ray spectrum during the initial phase of the TDE optical component (MJD 58714 to 59000) using the temperature and power-law slope from panels a and b. The spectrum is consistent with emission from the SE source, with no statistically significant contribution from AT2019qiz.
Extended Data Fig. 5
Extended Data Fig. 5. High-cadence optical observations and UV photometry.
Pan-STARRS data are measured on difference images using the Pan-STARRS reference image for subtraction, whereas for the Liverpool Telescope, ULTRACAM and UVOT, we measure aperture photometry on the unsubtracted images. We subtract the mean magnitude in each case to emphasize the (lack of) strong variability on hour-long timescales. However, the UV shows possible variability at the level of several times 0.1 mag, with a possible dip at the time of the QPE. Note that the time axis is different on each sub-plot and the dates on which each dataset was obtained are provided on the individual panels. The error bars show the 1σ uncertainty in magnitude.
Extended Data Fig. 6
Extended Data Fig. 6. High-cadence X-ray observations at earlier times.
a, NICER data obtained between 25 September 2019 and 5 November 2019, close to the time of the optical TDE peak. No variability is detected, with the shaded region showing the range of QPE peaks at late times. Comparing with the observed QPEs at late times suggests that we would have most probably detected about two QPEs if they were active. b, Swift/XRT data obtained on 13 January 2022, binned in 5-ks fixed bins. The dotted line shows the QPE detected later with XRT. Variability is now observed on approximately hour timescales, but the baseline is insufficient to determine whether this is QPE-like in nature. The error bars show the 1σ uncertainty in count rate.
Extended Data Fig. 7
Extended Data Fig. 7. Optical, UV and X-ray images.
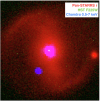
30 × 30-arcsec false-colour image, centred at the position of AT2019qiz. The red channel shows the archival Pan-STARRS stacked image of the field in the r band. The blue channel shows the Chandra image during the QPE (which appears magenta overlaid on the red Pan-STARRS image), smoothed with a 2-pixel Gaussian filter. The green channel shows the HST image, demonstrating the point nature of the UV emission (visible as a white dot at the centre of the image) and its association with the host nucleus.
Extended Data Fig. 8
Extended Data Fig. 8. Parameter constraints from the disk model.
The posterior distributions of the model fit to AT2019qiz. The SMBH mass posterior (M) is consistent with all other observational constraints and all other parameter values are in the expected range for TDEs. The SMBH spin is denoted aMdisk is the initial disk mass, tevol parameterizes the timescale of viscous spreading and i is the inclination of the disk with respect to the observer.
Extended Data Fig. 9
Extended Data Fig. 9. Examples of disk model light curves for four different SMBH spin values.
All other parameters are fixed to the posterior medians. The colours are the same as in Fig. 4. In optical and UV bands, varying the spin produces imperceptible changes in the light curves, but in the X-ray band, the changes are pronounced. Physically, this is a result of the exponential sensitivity of the X-ray flux on the inner disk temperature, whereas the optical and UV luminosity is sensitive only to the disk structure at larger radii.

References

    1. Miniutti, G. et al. Nine-hour X-ray quasi-periodic eruptions from a low-mass black hole galactic nucleus. Nature573, 381–384 (2019). - PubMed
    1. Giustini, M., Miniutti, G. & Saxton, R. D. X-ray quasi-periodic eruptions from the galactic nucleus of RX J1301.9+2747. Astron. Astrophys.636, L2 (2020).
    1. Arcodia, R. et al. X-ray quasi-periodic eruptions from two previously quiescent galaxies. Nature592, 704–707 (2021). - PMC - PubMed
    1. Arcodia, R. et al. The more the merrier: SRG/eROSITA discovers two further galaxies showing X-ray quasi-periodic eruptions. Astron. Astrophys.684, A64 (2024).
    1. Guolo, M. et al. X-ray eruptions every 22 days from the nucleus of a nearby galaxy. Nat. Astron.8, 347–358 (2024).