. 2024 Oct;634(8034):684-692.
doi: 10.1038/s41586-024-08026-3. Epub 2024 Oct 9.

Dietary restriction impacts health and lifespan of genetically diverse mice

Affiliations

Dietary restriction impacts health and lifespan of genetically diverse mice

Andrea Di Francesco et al. Nature. 2024 Oct.

Abstract

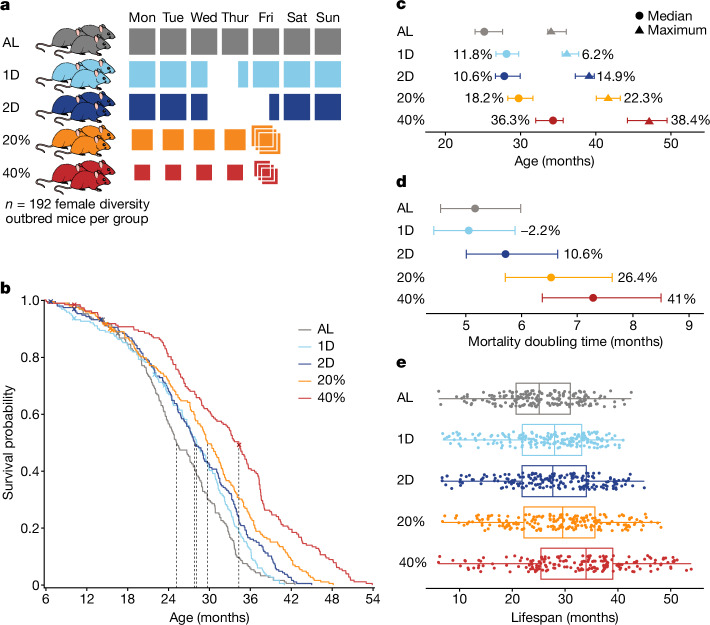
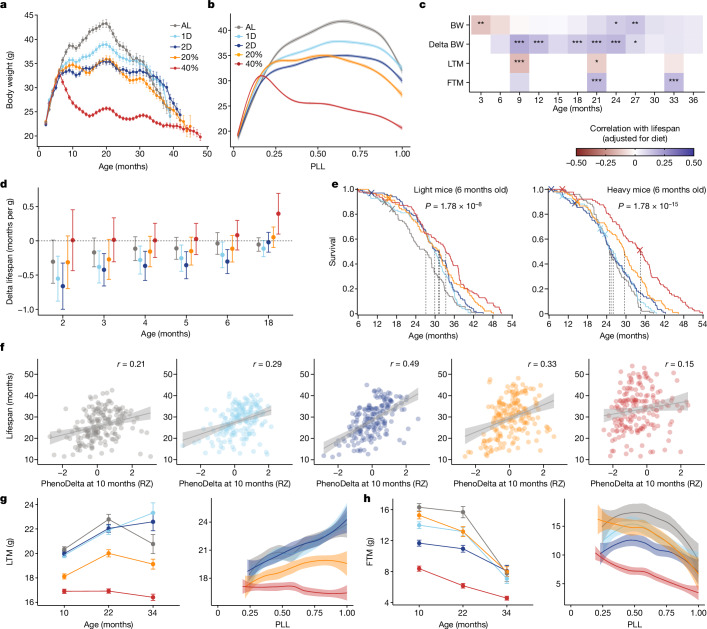
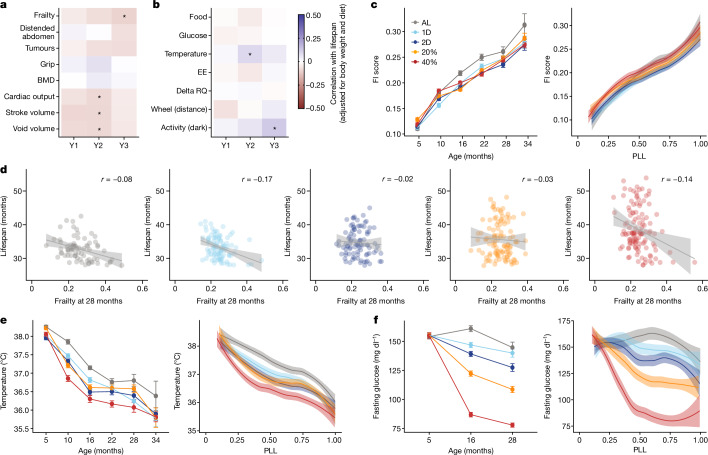
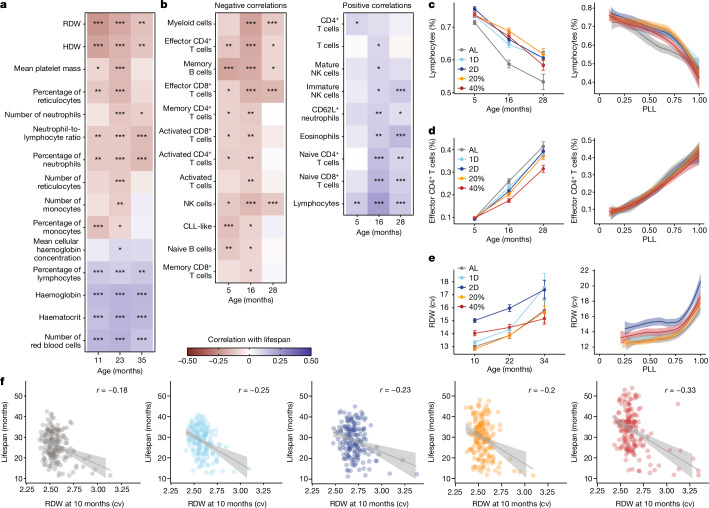
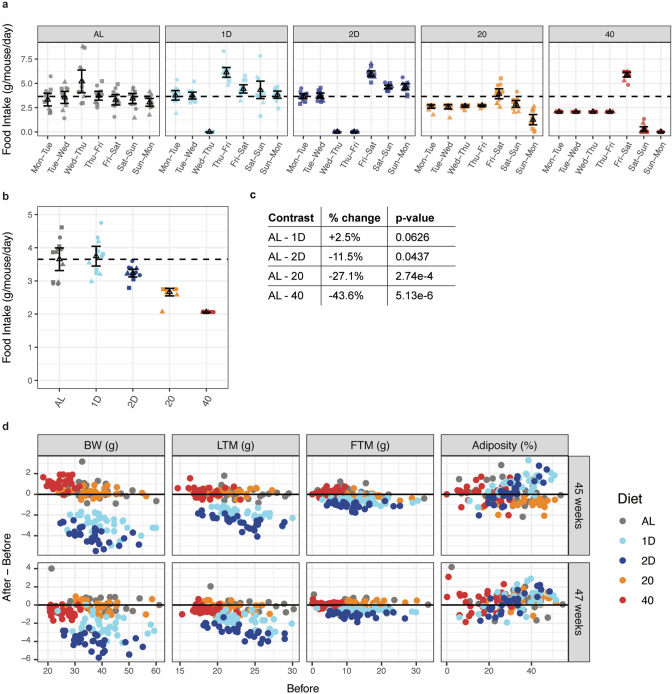
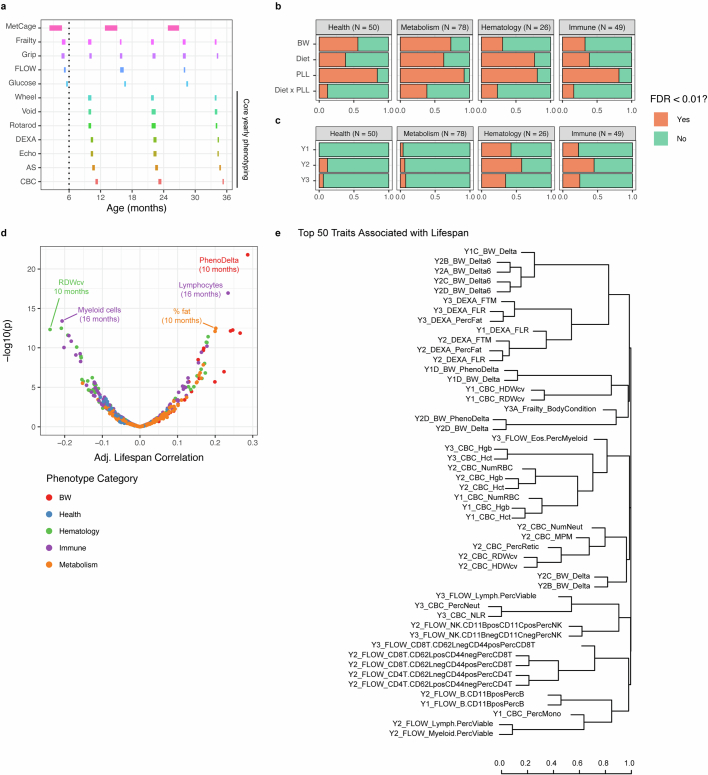
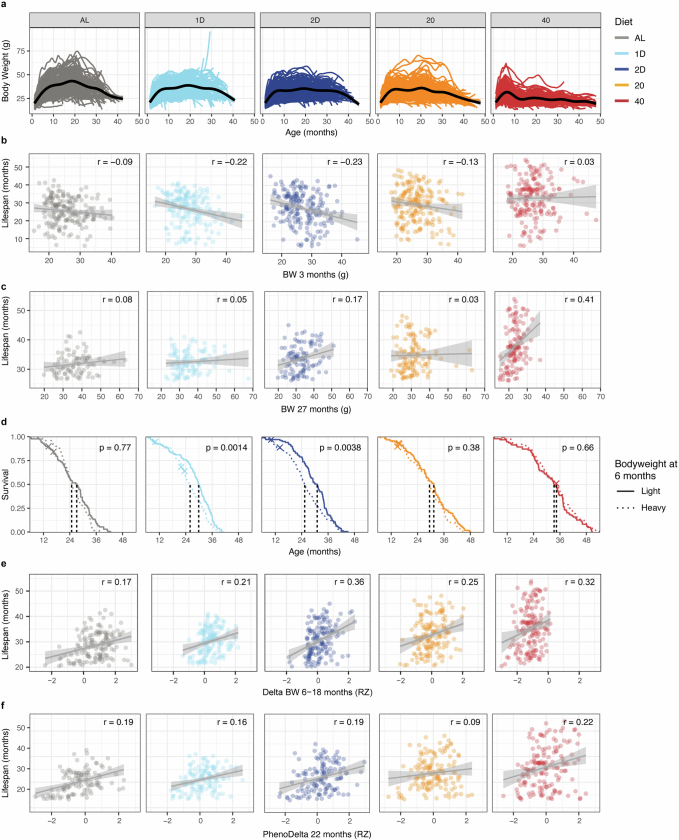
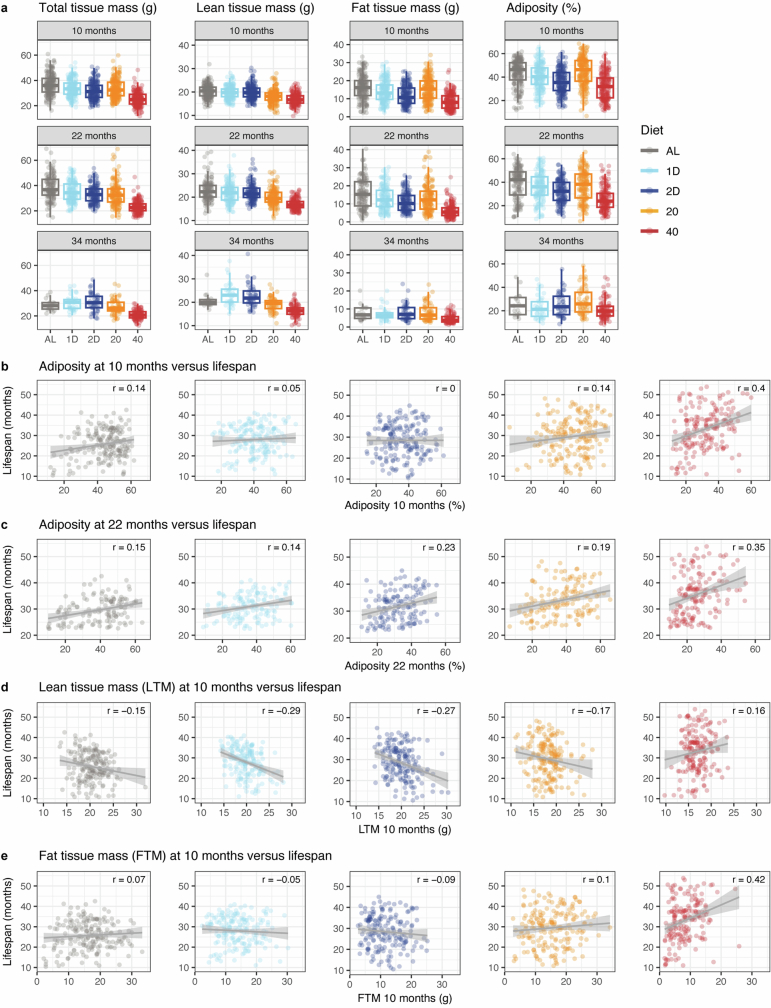
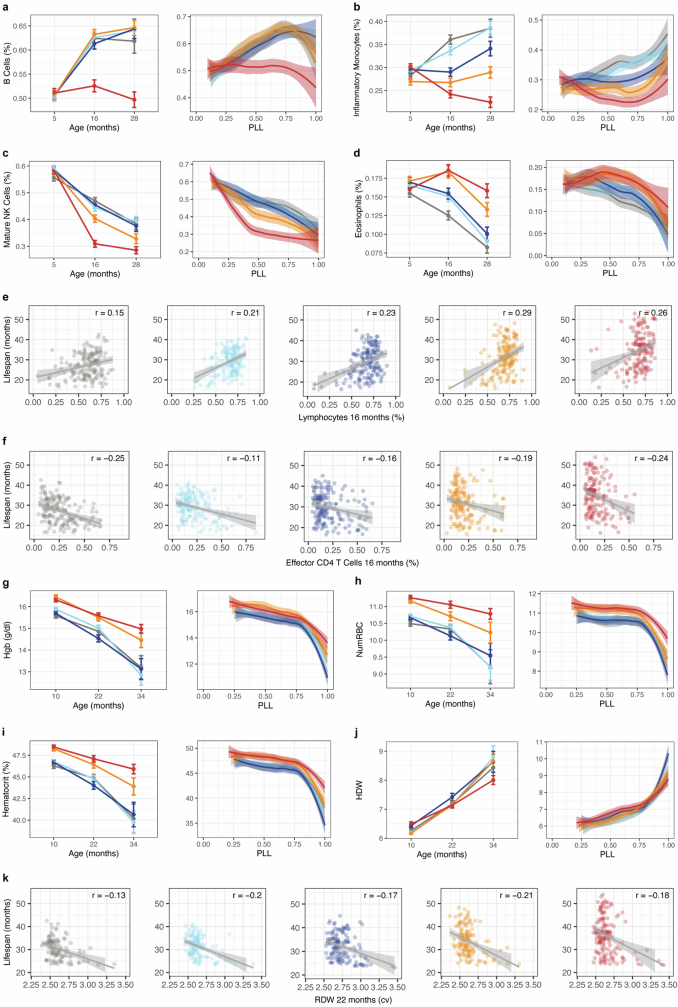
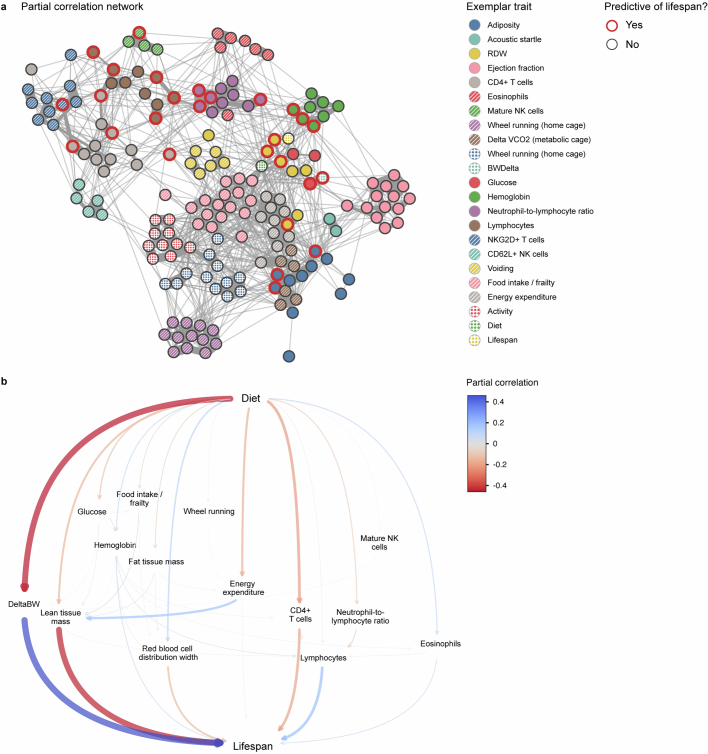
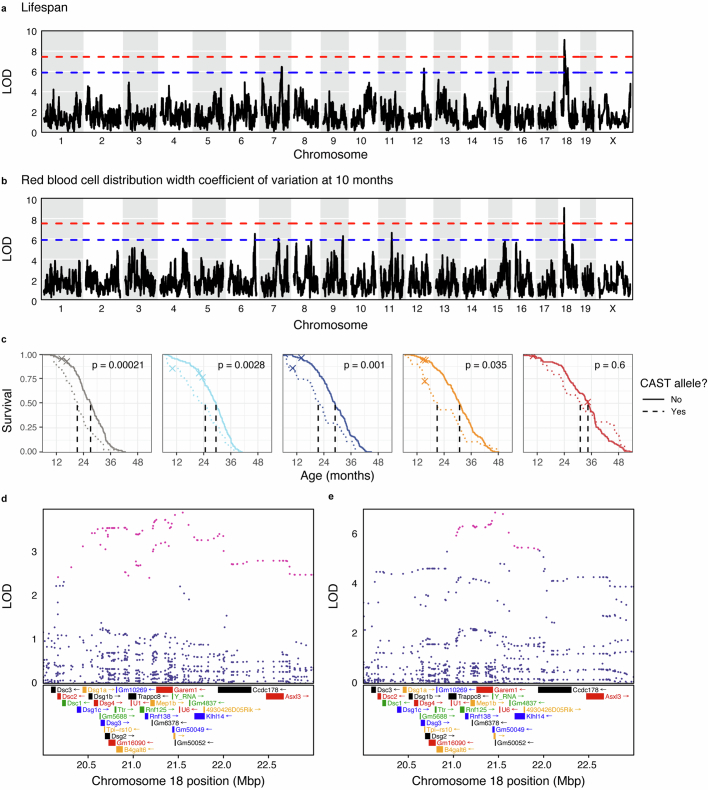
Caloric restriction extends healthy lifespan in multiple species1. Intermittent fasting, an alternative form of dietary restriction, is potentially more sustainable in humans, but its effectiveness remains largely unexplored2-8. Identifying the most efficacious forms of dietary restriction is key for developing interventions to improve human health and longevity9. Here we performed an extensive assessment of graded levels of caloric restriction (20% and 40%) and intermittent fasting (1 and 2 days fasting per week) on the health and survival of 960 genetically diverse female mice. We show that caloric restriction and intermittent fasting both resulted in lifespan extension in proportion to the degree of restriction. Lifespan was heritable and genetics had a larger influence on lifespan than dietary restriction. The strongest trait associations with lifespan included retention of body weight through periods of handling-an indicator of stress resilience, high lymphocyte proportion, low red blood cell distribution width and high adiposity in late life. Health effects differed between interventions and exhibited inconsistent relationships with lifespan extension. 40% caloric restriction had the strongest lifespan extension effect but led to a loss of lean mass and changes in the immune repertoire that could confer susceptibility to infections. Intermittent fasting did not extend the lifespan of mice with high pre-intervention body weight, and two-day intermittent fasting was associated with disruption of erythroid cell populations. Metabolic responses to dietary restriction, including reduced adiposity and lower fasting glucose, were not associated with increased lifespan, suggesting that dietary restriction does more than just counteract the negative effects of obesity. Our findings indicate that improving health and extending lifespan are not synonymous and raise questions about which end points are the most relevant for evaluating aging interventions in preclinical models and clinical trials.


Conflict of interest statement

A.D.F., Z.C., K.M.W., A.R., G.V.P., M.M., F.H., D.B. and A.F. are employees of Calico Life Sciences. The other authors declare no competing interests.

Figures

Fig. 1
Fig. 1. DR extends lifespan in DO mice.
a, The study design: 960 female DO mice were randomized to one of five diet intervention groups: ad libitum (AL); one day (1D) or two consecutive days (2D) per week fasting; or CR at 20% (20%) or 40% (40%) of estimated adult food intake. b, Kaplan–Meier survival curves by diet group. The dashed lines indicate the median lifespan. Censoring events are indicated by an ‘X’. c, Kaplan–Meier estimates of median (50% mortality) and maximum (90% mortality) lifespan by diet group, showing the percentage change relative to AL and the 95% confidence intervals (computed using R/survfit). n = 937 mice. d, Mortality doubling times estimated from a Gompertz log-linear hazard model, showing the percentage change relative to AL and the 95% confidence intervals (computed using R/flexsurvreg). n = 937 mice. e, Individual mouse lifespans (points) within diet groups. n = 188 (AL), n = 188 (1D), n = 190 (2D), n = 189 (20%) and n = 182 (40%). The box plots show the median lifespan (centre line), quartiles (box limits) and range (whiskers). Source Data
Fig. 2
Fig. 2. Body weight and composition effects on lifespan.
a, Lifetime trajectories of body weight (g) by diet groups. Data are monthly mean ± 1 s.e.m. n = 937. b, Body weight (g) trajectories as the running median (loess fit) by the PLL with 95% confidence bands. c, Diet-adjusted correlation with lifespan for body weight, change in body weight across three-month intervals (delta BW), LTM and FTM. The asterisks indicate multiple-testing-adjusted significance, determined by linear regression of lifespan on traits; *Padj < 0.01, **Padj < 0.001, ***Padj < 0.0001. d, The expected difference in lifespan per gram of body weight at ages 2 to 6 months and 18 months by diet. Data are mean ± 2 s.e.m. n = 937 (2 to 6 months) and n = 802 (18 months). e, Kaplan–Meier survival curves by diet group (colour) for mice below and above the median 6 month body weight. The dashed lines indicate the median survival times. Significance was determined using log-rank tests comparing diet within body weight strata. n = 469 (light) and n = 468 (heavy). f, Lifespan by change in body weight during the phenotyping period (10 to 11 months; PhenoDelta), showing the regression line, 95% confidence bands and diet-specific correlations (Padj < 2.2 × 10−16; diet × trait: P = 0.00172, r = 0.287). g, LTM (g) by age (mean ± 2 s.e.m.; n = 895 (10 months), n = 689 (22 months), n = 241 (34 months) mice) and by PLL as loess smoothing with the 95% confidence band (PLL: P < 2.2 × 10−16; diet: P < 2.2 × 10−16; diet × PLL: P = 1.07 × 10−7). h, FTM (g) by age (mean ± 2 s.e.m.; n values are as shown in g) and by PLL as loess smoothing with the 95% confidence bands (PLL: P < 2.2 × 10−16, diet: P < 2.2 × 10−16, diet × PLL: P = 0.168). For g and h, details of the statistical tests are provided in the ‘Longitudinal trait analysis’ section of the Methods. Source Data
Fig. 3
Fig. 3. Health and metabolic traits change with age and diet but are poor predictors of lifespan.
a,b, Heat maps of diet- and body-weight-adjusted correlation with lifespan for selected health (a) and metabolic (b) traits at annual testing intervals. Ages (1 year, 2 years and 3 years indicated as Y1, Y2 and Y3, respectively) vary depending on the assay (Supplementary Table 4). The asterisks indicate multiple-testing-adjusted significance, determined by linear regression of lifespan on traits; *Padj < 0.01. c, FI score (adjusted for technician and coat colour) by age (mean ± 2 s.e.m.; n = 770 (5 months), n = 909 (10 months), n = 834 (16 months), n = 704 (22 months), n = 489 (28 months), n = 260 (34 months) mice) and by PLL as loess smoothing with the 95% confidence bands (PLL: P < 2.2 × 10−16; diet: P = 7.37 × 10−5; diet × PLL: P = 0.633). d, Lifespan by frailty score (adjusted for technician and coat colour) at 28 months with regression line and 95% confidence band (Padj = 0.00238; diet × trait: P = 0.260, r = −0.90). e, Body temperature (°C; adjusted for coat colour) by age (mean ± 2 s.e.m.; sample sizes were as described in c) and by PLL as loess smoothing with the 95% confidence bands (PLL: P < 2.2 × 10−16; diet: P < 2.2 × 10−16; diet × PLL: P = 0.0242). f, Fasting glucose (mg dl−1, adjusted for body weight) by age (mean ± 2 s.e.m.; samples sizes were as described in c) and by PLL as loess smoothing with the 95% confidence bands (PLL: P < 2.80 × 10−4; diet: P < 2.2 × 10−16; diet × PLL: P = 0.0368). Statistical details are provided in the ‘Longitudinal trait analysis’ (c,e,f) and ‘Trait association with lifespan’ (d) sections of the Methods. BMD, bone mineral density; EE, energy expenditure; RQ, respiratory quotient. Source Data
Fig. 4
Fig. 4. Immune and haematologic traits change with age, respond to diet and predict lifespan.
a,b, Diet- and body-weight-adjusted correlation with lifespan for selected haematological traits from flow cytometry (a) and immune traits from complete blood counts (b) at the indicated ages. The asterisks indicate multiple-testing-adjusted significance, determined using linear regression of lifespan on traits; *Padj < 0.01, **Padj < 0.001, ***Padj < 0.0001. c, Lymphocytes (the proportion of viable cells) by age (mean ± 2 s.e.m.; n = 936 (5 months), n = 830 (16 months), n = 485 (28 months) mice) and by PLL as loess smoothing with the 95% confidence bands (PLL: P < 2.2 × 10−16; diet: P < 4.43 × 10−8; diet × PLL: P = 0.0670). d, Effector CD4 T cells (proportion of all CD4 T cells) by age (mean ± 2 s.e.m.; sample sizes were as described in c) and by PLL as loess smoothing with the 95% confidence bands (PLL: P < 2.2 × 10−16; diet: P = 0.268; diet × PLL: P = 0.300). e, RDW (coefficient of variation (cv)) by age (mean ± 2 s.e.m.; n = 892 (10 months), n = 665 (22 months), n = 208 (34 months) mice) and by PLL as loess smoothing with the 95% confidence bands (PLL: P < 2.2 × 10−16; diet: P < 2.2 × 10−16; diet × PLL: P = 4.77 × 10−5). f, Lifespan by RDW at 10 months, with the regression line, 95% confidence bands and diet-specific correlations (Padj = 5.71 × 10−11; diet × trait: P = 0.395, r = −0.239). Details of the statistical tests are provided in the ‘Longitudinal trait analysis’ (ce) and ‘Trait association with lifespan’ (f) sections of the Methods. CLL, chronic lymphocytic leukaemia. Source Data
Fig. 5
Fig. 5. Genetic effects on lifespan in DO mice.
ac, The proportion of variance explained by genetics and DR to lifespan changes (>6 months (a), >11 months (b) and >17 months (c)) with age. d,e, Genetic mapping identifies genome-wide significant association with lifespan (d) and with RDW (e) on mouse chromosome 18. The x axis shows the genome position and the y axis shows the log10-transformed likelihood ratio (LOD score). f, Estimated additive genetic effects (centre) of each of the eight founder strain haplotypes (colour; A/J (AJ), C57BL/6J (B6), 129S1/SvlmJ (129), NOD/ShiLtJ (NOD), NZO/HILtJ (NZO), CAST/EiJ (CAST), PWK/PhJ (PWK) and WSB/EiJ(WSB)) at the chromosome 18 QTL for RDW (x axis) and lifespan (y axis) (regression coefficient ± 1 s.e.m.; n = 892 mice). The reference line (dotted) has a slope of −1 and an intercept of 0. g, Kaplan–Meier survival curves by diet group (colour) are shown for mice stratified by the presence of a CAST allele at the QTL. The dashed lines indicate the median survival age per group. Significance was calculated using log-rank test comparison across diets within genotype strata. n = 765 (not CAST) and n = 164 (CAST). Source Data
Extended Data Fig. 1
Extended Data Fig. 1. Food consumption on DR.
a, Food consumption was measured for four pens (~ 32 mice) per diet group across three non-consecutive weeks. Daily (3 pm to 3 pm) data shown as average consumption (g/mouse/day) per pen and week of assessment (mean ± 2 s.e.; n = 20 pens). Note that food was refreshed weekly on Wednesday for AL mice. b, Cumulative food consumption (g/mouse/day) per pen and week (mean ± 2 s.e.; n = 20 pens). c, Cumulative food consumption in each diet group reported as percent change relative to AL. Significance testing of regression coefficients used a 2-sided Wald test. d, Changes in body weight (BW), lean tissue mass (LTM), fat tissue mass (FTM), and adiposity at 45 and 47 weeks of age. For IF mice, measurements were taken before and after fasting. For CR mice, measurements were taken before the Friday triple feeding and again before refeeding on Monday. AL mice were assessed on Friday and Monday. Points represent individual mice. On x-axis: before-fasting body weight (g), lean mass (g), fat mass (g), and adiposity (100% x fat mass/total mass). On y axis: difference between before and after, same units. Source Data
Extended Data Fig. 2
Extended Data Fig. 2. Metabolic consequences of DR.
a, Food consumption from one week of metabolic cage data at ~5, 16, and 28 months of age summarized in 4-hour intervals (mean ± 2 s.e.). x-axis labels represent the start of 4-hour intervals in military time. b, Respiratory quotient summarized in 4-hour intervals (mean ± 2 s.e.). c, Energy expenditure (kcal per 4 h, adjusted for body weight) summarized in 4-hour intervals (mean ± 2 s.e.). d, Distance on running wheel (metres per 4 h) summarized in 4-hour intervals (mean ± 2 s.e.). e, Change in respiratory quotient (RQ) (5th to 95th percentile range across one week) showing individuals (points) and averages by diet group and age (mean ± 2 s.e.). f, Energy expenditure showing individuals (points) and averages by diet group and age (mean ± 2 s.e.). g, Cumulative wheel running (kilometres per day) showing individuals (points) and averages by diet group and age (mean ± 2 s.e.). For all panels a-g sample sizes are: 5 months n = 889, 16 months n = 760, 28 months n = 528. Source Data
Extended Data Fig. 3
Extended Data Fig. 3. Statistical analysis of physiological traits.
a, Overview of the phenotyping schedule: metabolic cages (MetCage), grip strength and frailty exams including body temperature, immune cell profiling by flow cytometry (FLOW), fasted blood glucose, home cage wheel running, voiding assay, rotarod, body composition by dual energy x-ray absorption (DEXA), echocardiogram (Echo), acoustic startle (AS), and complete blood count (CBC). Assays from Wheel to AS constitute the one-month-long intensive phenotyping period. b, Barplots showing the number of traits with significant (padj <0.01) associations with body weight (BW), diet, proportion of life lived (PLL), and diet x PLL interaction. Traits were categorized as health, metabolism, haematology, or immune (see Supplementary Table 6 and Online Methods: Longitudinal Trait Analysis for statistical test details). c, Barplots showing the number of traits that were significantly associated with lifespan after accounting for diet group and body weight. Ages (designated Y1, Y2, Y3) vary depending on the assay (see Supplementary Table 4). For traits with multiple measurements each year, we counted the most significant result (see Supplementary Table 7 and Online Methods: Trait Association with Lifespan for statistical test details). d, Volcano plot showing diet- and BW-adjusted correlations of physiological traits with lifespan vs. statistical significance (-log10p). e, Dendrogram shows hierarchical clustering (complete linkage, absolute correlation distance) of 50 traits with the most significant lifespan association. Trait names are shown as Year_AssayType_TraitName as defined in Supplementary Table 5. Source Data
Extended Data Fig. 4
Extended Data Fig. 4. Body weight traits are associated with lifespan.
a, Body weight trajectories of individual mice show variation around the loess smoothed mean (black line). b, Lifespan by body weight at 3 months (BW, g) with regression line, 95% confidence band, and diet-specific correlations (padj = 2.48e-4, Diet x Trait:p = 0.0645, r = −0.134). c, Lifespan by body weight at 27 months (BW, g) with regression line, 95% confidence band, and diet-specific correlations (padj = 3.26e-4, Diet x Trait:p = 0.00183, r = 0.137). d, Kaplan-Meier curve comparing lifespan for light vs. heavy mice at 6 months of age within each diet group. Statistical significance (p) based on within-diet log rank test comparison of light vs. heavy mice. e, Lifespan by change in body weight from 6 to 18 months (Delta BW, RZ = rank normal scores transformed) with regression line, 95% confidence band, and diet-specific correlations (padj = 5.79e-11, Diet x Trait:p = 0.327, r = 0.266). f, Lifespan by change in body weight from 22 to 23 months (PhenoDelta, RZ = rank normal scores transformed) with regression line, 95% confidence band, and diet-specific correlations (padj =4.07e-9, Diet x Trait:p = 0.530, r = 0.170). See Online Methods: Trait Association with Lifespan (panels b, c, e, f) for statistical test details. Source Data
Extended Data Fig. 5
Extended Data Fig. 5. Body composition traits are associated with lifespan.
a, Total tissue mass (TTM, g) is decomposed into lean tissue mass (LTM, g), fat tissue mass (FTM, g) and adiposity (100% × FTM/TTM) for individual mice by diet group (colour) and age (10, 22, 34 months). Sample sizes:10 months n = 895, 22 months n = 689, 34 months n = 241 mice. Boxplots show median, quartiles, and range of data. b, Lifespan by adiposity at 10 months with regression line, 95% confidence band, and diet-specific correlations (padj = 3.56e-5, Diet x Trait:p = 0.00230, r = 0.151). c, Lifespan by adiposity at 22 months (%) with regression line, 95% confidence band, and diet-specific correlations (padj = 4.83e-11, Diet x Trait:p = 0.149, r = 0.202). d, Lifespan by LTM at 10 months (g) with regression line and diet-specific correlations (padj = 4.13e-5, Diet x Trait:padj = 0.0302, r = −0.153). e, Lifespan by FTM at 10 months (g) with regression line, 95% confidence band, and diet-specific correlations (padj = 0.0264, Diet x Trait:padj = 0.00670, r = 0.0920). See Online Methods: Trait Association with Lifespan (panels b-e) for statistical test details. Source Data
Extended Data Fig. 6
Extended Data Fig. 6. Health and metabolic traits.
a, Kyphosis (scored as 0, 0.5, 1) by age (mean ± 2 s.e.; 5 months n = 770, 10 months n = 909, 16 months n = 834, 22 months n = 704, 28 months n = 489, 34 months n = 260 mice) and by PLL as loess smooth with 95% confidence band (PLL:p < 2.2e-16, Diet:p < 0.00913, Diet x PLL:p = 0.00115). b, Gait disorders (scored as 0, 0.5, 1) by age (mean ± 2 s.e.; sample sizes as in panel a) and by PLL as loess smooth with 95% confidence band (PLL:p < 2.2e-16, Diet:p < 0.192, Diet x PLL:p = 7.78e-4). c, Tumour incidence (scored 0, 0.5, 1) by age (mean ± 2 s.e.; sample sizes as in panel a) and stratified by median 6-month body weight. d, Distended abdomen incidence (scored 0, 0.5, 1) by age (mean ± 2 s.e.; sample sizes as in panel a) and stratified by median 6-month body weight. See Online Methods: Longitudinal Trait Analysis (panels a-d) for statistical test details. Source Data
Extended Data Fig. 7
Extended Data Fig. 7. Immunological and Haematological traits.
a, B cells (proportion of lymphocytes) by age (mean ± 2 s.e.; 5 months n = 936, 16 months n = 830, 28 months n = 485 mice) and by PLL as loess smooth with 95% confidence band (PLL:p = 9.85e-8, Diet:p = 2.42e-7, Diet x PLL:p = 0.751). b, Inflammatory monocytes (proportion of monocytes) by age (mean ± 2 s.e.; sample sizes as in panel a) and by PLL as loess smooth with 95% confidence band (PLL:p < 1.42e-7, Diet:p < 2.2e-16, Diet x PLL:p = 0.0148). c, Mature NK cells (proportion of NK cells) by age (mean ± 2 s.e.; sample sizes as in panel a) and by PLL as loess smooth with 95% confidence band (PLL:p < 2.2e-16, Diet:p < 4.08e-7, Diet x PLL:p = 0.0206). d, Eosinophils (proportion of myeloid cells) by age (mean ± 2 s.e.; sample sizes as in panel a) and by PLL as loess smooth with 95% confidence band (PLL:p < 2.2e-16, Diet:p < 6.93e-7, Diet x PLL:p = 0.210). e, Lifespan by Lymphocytes at 16 months (proportion of viable cells) with regression line, 95% confidence band, and diet-specific correlations (padj = 4.15e-15, Diet x Trait:p = 0.542, r = 0.234). f, Lifespan by effector CD4 T cells at 16 months (proportion of CD4 T cells) with regression line, 95% confidence band, and diet-specific correlations (padj = 1.70e-10, Diet x Trait:p = 0.481, r = −0.189). g, Haemoglobin (Hgb, g/dl) by age (mean ± 2 s.e.; 10 months n = 892, 22 months n = 665, 34 months n = 208 mice) and by PLL as loess smooth with 95% confidence band (PLL:p < 2.2e-16, Diet:p < 2.2e-16, Diet x PLL:p = 0.313). h, Red blood cell count (NumRBC, 106cells/ul) by age (mean ± 2 s.e.; sample sizes as in panel g) and by PLL as loess smooth with 95% confidence band (PLL:p < 2.2e-16, Diet:p < 2.2e-16, Diet x PLL:p = 0.999). i, Haematocrit (percent red cells) by age (mean ± 2 s.e.; sample sizes as in panel g) and by PLL as loess smooth with 95% confidence band (PLL:p < 2.2e-16, Diet:p < 2.2e-16, Diet x PLL:p = 0.508). j, Haemoglobin distribution width (HDW, cv) by age (mean ± 2 s.e.; sample sizes as in panel g) and by PLL as loess smooth with 95% confidence band (PLL:p < 2.2e-16, Diet:p = 3.83e-11, Diet x PLL:p = 1.57e-5). k, Lifespan by RDW at 22 months (cv) with regression line, 95% confidence band, and diet-specific correlations (padj = 1.65e-10, Diet x Trait:p = 0.745, r = −0.191). See Online Methods: Longitudinal Trait Analysis (panels a-d, g-j) and Trait Association with Lifespan (panels e, f, k) for statistical test details. Source Data
Extended Data Fig. 8
Extended Data Fig. 8. Multivariate analysis of physiological traits.
a, Partial correlation network of 194 traits assayed between 10 and 16 months of age. Trait clusters indicated by colour (see Supplementary Table 10 for details). Points represent individual traits and red outline indicates traits that are significantly associated with lifespan (padj <0.01). The figure is available as an interactive HTML plot in the FigShare files (see Data Availability). Colour key shows the name and age at assessment of the exemplar trait selected to represent each cluster of traits. b, Waterfall plot shows the top scoring paths from Diet to Lifespan in the reduced (21 trait) partial correlation network. Size of the arrow is proportional to absolute partial correlation and colour indicates the sign of the partial correlation (colour scale). Abbreviations: Hgb = haemoglobin, LTM = lean tissue mass, FTM = fat tissue mass, RDW = red cell distribution width, NLR = neutrophil to lymphocyte ratio. Source Data
Extended Data Fig. 9
Extended Data Fig. 9. Genetic mapping of physiological traits.
a, Manhattan plot shows all LOD peaks above the suggestive threshold (6.0) stratified by domains (facets) and year of assay (colour). Some landmarks include: acoustic startle traits mapped to the age related hearing loss locus (ahl) on chromosome 10 gene Cdh23; loss of fur colour (frailty index item) mapped to coat colour genes agouti (a) and tyrosinase (Tyr) on chromosomes 2 and 7, respectively; haemoglobin traits mapped to the Hbb locus on chromosome 7 and Mon1a on chromosome 9; NK cell traits mapped to Itgam (cell surface marker CD11) on chromosome 7, and additional immune traits mapped to major histocompatibility locus on chromosome 17. Horizontal lines indicate genome-wide adjusted significance thresholds for suggestive (blue) and significant (red, adjusted p < 0.05) QTL. Source Data
Extended Data Fig. 10
Extended Data Fig. 10. Genetic mapping of lifespan and RDW.
a, Genome-wide QTL mapping of lifespan. Horizontal lines indicate genome-wide adjusted significance thresholds for suggestive (blue) and significant (red, adjusted p < 0.05) QTL. b, Genome-wide QTL mapping of RDW as in a. All panels: x-axis is genomic location (chromosome and position), y-axis is LOD score. c, Kaplan-Meier curves within each diet group compare survival of mice stratified by the presence of a CAST allele at the QTL. Statistical significance (p) based on within-diet log rank test comparison of mice with none versus at least one CAST allele at the chromosome 18 QTL peak. d, e, Association mapping of single nucleotide variants (SNVs) for (d) lifespan and (e) RDW across the QTL support interval for RDW (21–23 Mb). Chromosomal position is shown on the x-axis, SNV LOD score on the y-axis. SNVs with LOD score with 1.5 units of the top scoring SNV are highlighted (purple). Annotated genes and gene models are shown in their approximate positions below. Source Data

References

    1. Fontana, L., Partridge, L. & Longo, V. D. Extending healthy life span—from yeast to humans. Science328, 321–326 (2010). - DOI - PMC - PubMed
    1. Di Francesco, A., Di Germanio, C., Bernier, M. & de Cabo, R. A time to fast. Science362, 770–775 (2018). - DOI - PMC - PubMed
    1. Longo, V. D. & Panda, S. Fasting, circadian rhythms, and time-restricted feeding in healthy lifespan. Cell Metab.23, 1048–1059 (2016). - DOI - PMC - PubMed
    1. de Cabo, R. & Mattson, M. P. Effects of intermittent fasting on health, aging, and disease. N. Engl. J. Med.381, 2541–2551 (2019). - DOI - PubMed
    1. Duregon, E. et al. Prolonged fasting times reap greater geroprotective effects when combined with caloric restriction in adult female mice. Cell Metab.35, 1179–1194 (2023). - DOI - PMC - PubMed

LinkOut - more resources