. 2024 Nov;635(8039):755-763.
doi: 10.1038/s41586-024-08031-6. Epub 2024 Oct 9.

AKT and EZH2 inhibitors kill TNBCs by hijacking mechanisms of involution

Affiliations

AKT and EZH2 inhibitors kill TNBCs by hijacking mechanisms of involution

Amy E Schade et al. Nature. 2024 Nov.

Abstract

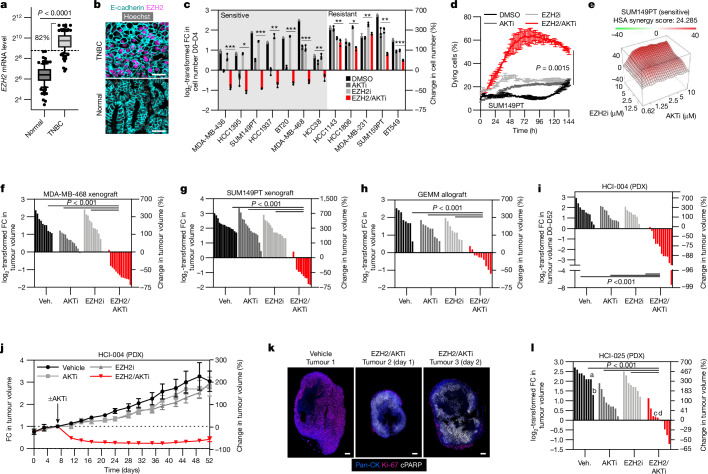
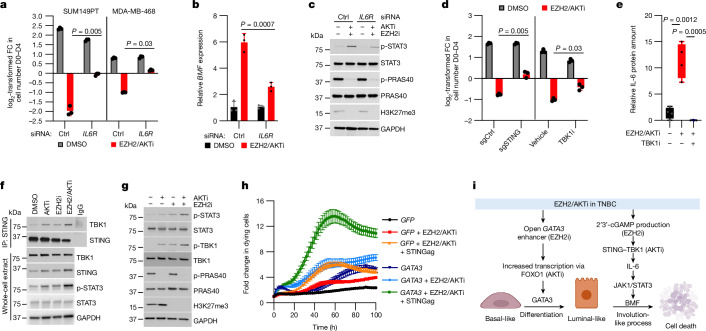
Triple-negative breast cancer (TNBC) is the most aggressive breast cancer subtype and has the highest rate of recurrence1. The predominant standard of care for advanced TNBC is systemic chemotherapy with or without immunotherapy; however, responses are typically short lived1,2. Thus, there is an urgent need to develop more effective treatments. Components of the PI3K pathway represent plausible therapeutic targets; more than 70% of TNBCs have alterations in PIK3CA, AKT1 or PTEN3-6. However, in contrast to hormone-receptor-positive tumours, it is still unclear whether or how triple-negative disease will respond to PI3K pathway inhibitors7. Here we describe a promising AKT-inhibitor-based therapeutic combination for TNBC. Specifically, we show that AKT inhibitors synergize with agents that suppress the histone methyltransferase EZH2 and promote robust tumour regression in multiple TNBC models in vivo. AKT and EZH2 inhibitors exert these effects by first cooperatively driving basal-like TNBC cells into a more differentiated, luminal-like state, which cannot be effectively induced by either agent alone. Once TNBCs are differentiated, these agents kill them by hijacking signals that normally drive mammary gland involution. Using a machine learning approach, we developed a classifier that can be used to predict sensitivity. Together, these findings identify a promising therapeutic strategy for this highly aggressive tumour type and illustrate how deregulated epigenetic enzymes can insulate tumours from oncogenic vulnerabilities. These studies also reveal how developmental tissue-specific cell death pathways may be co-opted for therapeutic benefit.


Conflict of interest statement

Competing interests: K.C. is an advisor at Genentech and serves on the scientific advisory board of Erasca. S.M.T. has consulting or advisory roles at Novartis, Pfizer, Merck, Lilly, Nektar, NanoString Technologies, AstraZeneca, Puma Biotechnology, Genentech/Roche, Eisai, Sanofi, Bristol Myers Squibb, Seattle Genetics, Odonate Therapeutics, OncoPep, Kyowa Hakko Kirin, Samsung Bioepis, CytomX Therapeutics, Daiichi Sankyo, Athenex, Gilead, Mersana, Certara, Chugai Pharma, Ellipses Pharma, Infinity, 4D Pharma, OncoSec Medical, BeyondSpring Pharmaceuticals, OncXerna, Zymeworks, Zentalis, Blueprint Medicines, Reveal Genomics and ARC Therapeutics; and received institutional research funding from Genentech/Roche, Merck, Exelixis, Pfizer, Lilly, Novartis, Bristol Myers Squibb, Eisai, AstraZeneca, NanoString Technologies, Cyclacel, Nektar, Gilead, Odonate Therapeutics, Sanofi and Seattle Genetics. P.K.S. is a co-founder and member of the BOD of Glencoe Software, member of the BOD for Applied Biomath, member of the scientific advisory board for RareCyte, NanoString and Montai Health, holds equity in Glencoe, Applied Biomath and RareCyte, consults for Merck, and has received research funding to the institution from Novartis and Merck in the past 5 years. A.C.G.-C. has grant/research funding to institution from Gilead Sciences, AstraZeneca, Daiichi-Sankyo, Merck, Zenith Epigenetics, Bristol-Myers Squibb, Novartis, Foundation Medicine and Biovica; serves as a consultant and member of the scientific advisory board for AstraZeneca, Daiichi-Sankyo and Novartis; has received honoraria from AstraZeneca and Daiichi-Sankyo; and has other financial or materials support from Roche/Genentech, Gilead Sciences, AstraZeneca, Novartis and Merck. K.H. is a consultant for and a co-founder of Dania Therapeutics Aps and a scientific advisor for Hannibal Health Innovation. S.R.V.K. is a founder and consultant at Faeth Therapeutics and Transomic Technologies. D.A.B. is a consultant for N of One/QIAGEN and Tango Therapeutics; is a founder and shareholder in Xsphera Biosciences; has received honoraria from Merck, H3 Biomedicine/Esai, EMD Serono, Gilead Sciences, Abbvie and Madalon Consulting; and has received research grants from BMS, Takeda, Novartis, Gilead and Lilly. The other authors declare no competing interests.

Figures

Fig. 1
Fig. 1. AKT and EZH2 inhibitors potently synergize, kill TNBCs and promote substantial tumour regression in vivo.
a, EZH2 mRNA levels in TNBC tumours (n = 116) and matched normal breast tissue (n = 112). The dashed line indicates 2 s.d. above the mean of normal. The box limits show the 25th–75th percentiles, whiskers show 10th–90th percentiles, and centre line shows median. b, Multiplexed CyCIF analysis of TNBC tumour and normal breast epithelium stained for E-cadherin (cyan) and EZH2 (magenta) and with Hoechst. Scale bars, 50 μm. c, The relative change in cell number after 4 days of treatment with AKTi (ipatasertib) and/or EZH2i (tazemetostat) (day 4 (D4) versus day 0 (D0)). P values were calculated using unpaired one-tailed heteroscedastic Student’s t-tests. n = 3. Data are mean ± s.d. of biologically independent samples. P values from left to right are as follows: 6.27 × 10−4, 3.02 × 10−2, 1.30 × 10−4, 4.24 × 10−3, 2.57 × 10−4, 1.10 × 10−5, 2.12 × 10−3, 2.98 × 10−3, 1.88 × 10−2, 7.66 × 10−3, 5.76 × 10−3, 2.28 × 10−4. FC, fold change. *P < 0.05, **P < 0.01, ***P < 0.001. d, Live-cell imaging of dying SUM149PT cells in response to the indicated treatments. P values were determined using two-way analysis of variance (ANOVA). n = 8 technical replicates. e, Synergy plot using an HSA model for cells treated with AKTi and EZH2i. fi, Waterfall plots of MDA-MB-468 xenografts (n = 10–13 tumours; f), SUM149PT xenografts (n = 8–14 tumours; g), GEMM allografts (n = 8–10 tumours; h) or PDX HC1-004 (n = 8–12 tumours; i) after 28 days of treatment with vehicle (veh.), AKTi (ipatasertib) and/or EZH2i (tazemetostat) (17 days for GEMM allograft). All tumours were orthotopic. P values were calculated using two-tailed Mann–Whitney U-tests. j, The relative tumour volume of PDX HCI-004 (n = 8–12 tumours) over the treatment course of 52 days. Data are mean ± s.e.m. of biologically independent samples. k, Multiplexed CyCIF analysis of PDX-004 tumours (entire tumour section) treated with vehicle or EZH2/AKTi after 1 or 2 days and stained with antibodies against pan-cytokeratin (pan-CK, cellular, blue), Ki-67 (proliferation, pink) and cPARP (apoptosis, white). Scale bars, 500 μm. l, Waterfall plot of PDX HCI-025 (n = 8–10 tumours each) after 28 days of treatment. Sub-labeled bars correspond with histology in Extended Data Fig. 4.
Fig. 2
Fig. 2. Combined EZH2/AKT inhibitors are required for maximal differentiation and the therapeutic response.
a, ssGSEA z scores of the LIM_MAMMARY_LUMINAL_MATURE_UP and LIM_MAMMARY_STEM_CELL_UP gene signatures in SUM149PT cells. The box limits show the range of data and the centre lines show the mean. b, Transcriptional heat map depicting expression of significantly differentially expressed genes in gene signatures from a. MaSC, mammary stem cells. c, The correlation coefficient of the SUM149PT transcriptional profile with the luminal-AR and BL2 (basal-like 2) TNBCtypes. d,e, Multiplexed immunofluorescence analysis of HCI-004 PDX orthotopic tumours treated with vehicle or EZH2/AKTi and collected after 1, 2 or 30 days of treatment stained with CK14 (basal, cyan), CK8 (luminal, magenta) and cPARP (apoptosis, yellow) antibodies (d) or at day 30 after treatment and stained with pan-CK (cellular; white) and Ki-67 (proliferation; magenta) antibodies (e). The images represent entire tumour sections and are the same as in Fig. 1k with different channels. f, GATA3 expression was measured using qPCR with reverse transcription (RT–qPCR) in cell lines after AKTi (ipatasertib) and/or EZH2i (tazemetostat) treatment. n = 3. g, Immunoblot depicting GATA3 expression after treatment with EZH2i and/or AKTi in two sensitive cell lines. The experiment was repeated at least three times. h, The relative change in cell number of SUM149PT transfected with siControl (siCtrl) or siGATA3 (left) or transduced with sgControl (sgCtrl) or sgGATA3 (right) and then treated with vehicle, AKTi (ipatasertib) and/or EZH2i (tazemetostat). Data are mean ± s.d. of biologically independent samples. n = 3. P values were calculated using unpaired one-tailed heteroscedastic Student’s t-tests. i, The relative tumour volume of MDA-MB-468 orthotopic xenografts transduced with sgControl or sgGATA3 and treated with vehicle or EZH2/AKTi (tazemetostat + ipatasertib). Data are mean ± s.e.m. n = 6–9 tumours. Scale bars 500 μm (d) and 100 μm (e).
Fig. 3
Fig. 3. Identifying a sensitive TNBC cell state using a machine learning approach.
a, ATAC–seq motif footprinting score for GATA3-binding motifs in cells treated with EZH2i and/or AKTi. b, Immunoblot of GATA3 expression after EZH2/AKTi (tazemetostat + ipatasertib) treatment in sensitive and resistant cell lines. The experiment was repeated at least three times. c, Principal component analysis of the chromatin landscape of TNBC cell lines as assessed by ATAC–seq; a dotted line separates sensitive and resistant cell lines. d, Schematic of the machine learning model training and prediction assessment workflow. RNA-seq data for 17 cell lines were used to generate machine learning models that were trained and refined using empirical testing and then applied to the TCGA Firehose Legacy dataset for TNBC tumours. HVG, highest variable genes; LFC, log-transformed fold change.
Fig. 4
Fig. 4. EZH2 and AKT inhibitors drive differentiation by opening chromatin and cooperatively engaging FOXO1.
a, Genome browser view of the GATA3 enhancer with ATAC–seq and CUT&RUN for H3K27me3 data from MDA-MB-468 cells treated with EZH2i and/or AKTi. Chr., chromosome. b, A siRNA screen of candidate transcription factors yields a subset of hits that reduce cell death after combined EZH2/AKTi treatment in MDA-MB-468 cells. c, Relative GATA3 expression compared to siControl + EZH2/AKTi in MDA-MB-468 cells transfected with siRNA against hits from the siRNA screen in b. d, The relative cell numbers after vehicle or EZH2/AKTi treatment after 4 days in SUM149PT or MDA-MB-468 cells transfected with siControl or siFOXO1. P values were calculated using unpaired one-tailed heteroscedastic Student’s t-tests. e, Immunoblot analysis of the MDA-MB-468 samples from d. f, ChIP–qPCR analysis of FOXO1 to the GATA3 enhancer or promoter in MDA-MB-468 cells treated with EZH2i and/or AKTi. Data are technical replicates. Unless noted, data are mean ± s.d. of biologically independent samples.
Fig. 5
Fig. 5. AKT and EZH2 inhibitors trigger cell death by co-opting signals that normally drive involution.
a, BMF expression (z scores) in TNBC cell lines treated with the indicated drugs. b,c, The relative change in the cell number (b) and immunoblot analysis (c) of MDA-MB-468 cells transfected with siControl or siBMF and treated with the indicated drugs. Cells were engineered to express an HA epitope tag knocked into the endogenous BMF locus. d, ssGSEA z scores of mammary gland involution gene signatures in SUM149PT and MDA-MB-468 cells that were treated with the indicated drugs. The box limits show range of data, and the centre lines show the mean values. e, Expression of significantly differentially expressed genes in the involution signature from d in SUM149PT cells. f, BMF mRNA expression was measured using RT–qPCR in SUM149PT cells transfected with siControl or siSTAT3 in response to the indicated drugs. g, BMF levels (immunoblot of HA knock-in) in MDA-MB-468 cells transfected with siControl or siJAK1 and treated with the indicated drugs. The experiment was repeated at least three times. h, The relative levels of phosphorylated STAT3 in MDA-MB-468 cells that were treated with the indicated drugs. The experiment was repeated at least three times. i,j, The relative change in the number of cells transfected with siControl or siSTAT3 (i) or siJAK1 (j) and then treated with the indicated drugs. k, The relative change in the number of SUM149PT cells treated with vehicle, a JAK1 inhibitor (itacitinib), AKTi (ipatasertib) and/or EZH2i (tazemetostat). l, ChIP–qPCR data of the relative STAT3 occupancy at the BMF promoter compared with the IgG (non-specific) control in SUM149PT cells treated with the indicated drugs. For all panels, data are mean ± s.d. of biological independent samples. All experiments are n = 3. P values were calculated using unpaired one-tailed heteroscedastic Student’s t-tests.
Fig. 6
Fig. 6. AKT and EZH2 inhibitors trigger involution-related cytokine production by cooperatively activating STING–TBK1 signalling.
a, The relative change in the cell numbers for cells that were transfected with siControl or siIL-6R and treated with the indicated drugs. b, The relative change in BMF expression (RT–qPCR) in SUM149PT cells transfected with siControl or siIL-6R and treated with the indicated drugs. c, Immunoblot analysis of SUM149PT cells transfected with siRNA against IL6R or a control sequence and then treated with vehicle or EZH2/AKTi. d, The relative cell numbers in MDA-MB-468 cells transduced with sgControl or sgSTING (left) or treated with TBK1i (right). e, The amount of IL-6 (ELISA) relative to the DMSO treatment group in the indicated arms after 8 h. f, Immunoprecipitation (IP) of STING or IgG control in MDA-MB-468 cells treated with the indicated drugs for 8 h followed by immunoblotting using the indicated antibodies. g, Immunoblot analysis of MDA-MB-468 cells that were treated with EZH2i and/or AKTi using the indicated antibodies. h, Live-cell imaging of SUM159PT cells (resistant) transduced with GFP or GATA3 overexpression constructs treated with EZH2/AKTi and/or STING agonist ADUS100 (STINGag). i, The mechanism of action of combined EZH2 and AKT inhibitors to induce cell death and tumour regression in TNBC. The diagram was created using BioRender. For all panels, data are mean ± s.d. of biologically independent samples. All panels showing immunoblots were repeated at least three times. For all experiments, n = 3. P values were calculated using unpaired one-tailed heteroscedastic Student’s t-tests.
Extended Data Fig. 1
Extended Data Fig. 1. Extended data in relation to Fig. 1a–e.
a, Related to Fig. 1a. EZH2 mRNA levels within normal tissue (n = 111), or TNBC tumours resected at stage I (n = 19), stage II (n = 74), stage III (n = 19), or stage IV (n = 2). Box shows 10–90 percentiles with line at median. b, Treatment schema for all in vitro studies. c-d, Immunoblot depicting relative levels of AKT target inhibition (pPRAS40) and EZH2 target inhibition (H3K27me3) and relevant loading controls in sensitive (c) and resistant (d) cell lines from panel in Fig. 1c. Experiment was repeated at least 3 times. e, Dose dependence of cell death induced by the combination of EZH2i (tazemetostat) and AKTi (ipatasertib) measured by Incucyte Live Cell Imaging. Data for 5 μM AKTi are presented as the 72 h time point in Fig. 1d. n = 8. p *** <0.001 measured by unpaired one-tailed heteroscedastic Student’s T-test. Data are images from 8 independent wells. f, Synergy plots using Gaddum’s non-interaction model (HSA) for cells treated with AKTi (ipatasertib) and/or EZH2i (tazemetostat).
Extended Data Fig. 2
Extended Data Fig. 2. Extended data in relation to Fig. 1.
a, Relative change in cell number after 4 days of treatment with vehicle, AKTi (MK2206) and/or EZH2i (tazemetostat) (Day 4 versus Day 0). b, Relative change in TNBC cell numbers after 4 days of treatment with vehicle, AKTi (ipatasertib), EZH2i (tazemetostat), and/or EEDi (MAK683) (Day 4 versus Day 0). Immunoblot (repeated at least 3 times) depicting relative levels of AKT target inhibition (pPRAS40) and EZH2 target inhibition (H3K27me3) and relevant loading controls. c, Relative change in cell numbers after 4 days of treatment with vehicle, AKTi (ipatasertib) and/or EZH2i (tazemetostat) (Day 4 versus Day 0) in indicated cell lines. d, Immunoblot depicting relative levels of AKT target inhibition (pPRAS40) and EZH2 target inhibition (H3K27me3) and relevant loading controls in indicated cell lines from panel in (c). e, Crystal violet staining of SUM149PT cells treated with vehicle, AKTi (ipatasertib) and/or EZH2i (tazemetostat) and fixed after 10, 20, or 30 days of treatment. f, Relative change in cell number of MDA-MB-468 cells after treatment. Left – pre-treatment with EZH2i for 5 days followed by 4 days of combined treatment of EZH2i and/or AKTi. Middle – pre-treatment with EZH2i for 5 days followed by switch to vehicle or AKTi for an additional 4 days. Right – pre-treatment with EZH2i for 5 days followed by drug holiday for 4 days, followed by vehicle or AKTi treatment for an additional 4 days. Immunoblot on right depicts relative levels of AKT target inhibition (pPRAS40) and EZH2 target inhibition (H3K27me3) and relevant loading controls. For all subfigures, n = 3, data are mean ± s.d. of biological independent samples and p values were measured by unpaired one-tailed heteroscedastic Student’s T-test.
Extended Data Fig. 3
Extended Data Fig. 3. Extended data in relation to Fig. 1f–j.
a, EZH2 mRNA expression levels in sensitive and resistant TNBC cell lines from CCLE RNAseq dataset. Sensitive cells are ranked in order of sensitivity measured by amount of cell death observed in Fig. 1c. b, Immunoblot depicting PTEN expression and PIK3CA mutational status of TNBC cell lines with Fisher’s exact test panel. Experiment was completed at least 3 times with similar results. c, Graph depicting the relative tumour volume of MDA-MB-468 orthotopic xenografts over time treated with Vehicle, AKTi (ipatasertib) and/or EZH2i (tazemetostat). Note that established tumours (100mm3) were first pretreated with vehicle or tazemetostat for 7 days prior to the addition of these agents. p value determined using mixed effects models (REML) ANOVA between AKTi and Combo. n = 10–13 tumours per arm. Data are mean ± s.e. of biological independent samples. d, Kaplan-Meier survival plot of mice bearing MDA-MB-468 orthotopic xenografts treated with vehicle or EZH2i+AKTi. Treatment ended after day 28 and animals were monitored twice weekly for humane endpoint. Significance measured by Mantel-Cox Log Rank test. e, Graph depicting percent change in body weight of tumour bearing mice treated with the indicated drugs during the treatment duration. Data are mean ± s.e. of biological independent samples. n = 6 or 7 mice per condition. g, Copy number plots of chromosomes bearing Akt3 (e), Met (f), and Ezh2 (g) isolated from untreated GEMM organoid allograft tumours from K8-CreER; Trp53fl/fl mice implanted orthotopically into nude mice. h, Photographs of H&E-stained (left) or EZH2 immunohistochemistry (right) sections of a normal mouse mammary fat pad or tumour from Fig. 1h. Scale bar = 150 μm.
Extended Data Fig. 4
Extended Data Fig. 4. Extended data in relation to Fig. 1l.
Photographs of H&E-stained (top) or Ki67 immunohistochemistry (bottom) tumour sections at the end of study depicted in 1 l. F = fibrosis; N = necrosis; C = calcification. Scale bar = 150 μm.
Extended Data Fig. 5
Extended Data Fig. 5. Extended data in relation to Fig. 2.
a, differentially expressed genes between EZH2i+AKTi and DMSO treated SUM149PT cells. A subset of luminal and basal breast markers are highlighted. Padj is DESeq2 p value adjusted for multiple hypothesis testing. b, ssGSEA z scores of LIM_MAMMARY_LUMINAL_MATURE gene signatures in MDA-MB-468 cells. c, Transcriptional heatmap of significantly differentially expressed genes in gene signatures from (Fig. 2a) in MDA-MB-468 cells. d, Correlation coefficient of cell lines treated indicated drugs with basal TNBCtypes. e-f, RNA-seq normalized counts of ER (e) and AR (f) in SUM149PT and MDA-MB-468 cells. g, GATA3 protein expression in two sensitive cell lines treated with indicated drugs. h, Immunoblot of SUM149PT cells transfected with siControl or siGATA3 and treated with indicated drugs. i, Synergy scores using Gaddum’s non-interaction model (HSA) in cells stably transduced with shRNA or sgRNA against GATA3 or a control sequence. Cells were treated with various concentrations of AKTi and/or EZH2i. j, Synergy plots using Gaddum’s non-interaction model (HSA) for cells stably transduced with shRNA against GATA3 or a control sequence and then treated with indicated drugs. k, Relative change in cell number of MDA-MB-468 stably transduced with sgRNAs or transfected with siRNAs against a control sequence or GATA3 and then treated with indicated drugs. l, immunoblot of p27 and loading control of MDA-MB-468 cells treated with indicated drugs for 16 h. m, ssGSEA z scores of Hallmarks – E2F target gene signature in SUM149PT and MDA-MB-468 cells. n, immunoblot of p27 and loading control GAPDH of protein lysates from MDA-MB-468 cells treated with indicated drugs, in the presence of siRNAs against a control sequence or GATA3. For all subfigures, data are mean ± s.d. of biological independent samples (n = 3), immunoblots were repeated at least 3 times, box plots show range of data with line at mean, AKTi = ipatasertib, and EZH2i = tazemetostat.
Extended Data Fig. 6
Extended Data Fig. 6. Data related to Fig. 3.
a, gene set enrichment analysis of open peaks enriched in sensitive and resistant TNBC cell lines at baseline as assessed by ATAC-seq. Adjusted p values are FDR calculated using the Benjamini Hochberg method within the GSEA software. b-c, leading edge plot of gene set enrichment analysis of CHARAFE BREAST CANCER BASAL VS MESENCHYMAL DOWN (mesenchymal genes, (b)) and CHARAFE BREAST CANCER BASAL VS MESENCHYMAL UP (basal genes, (c)) in sensitive and resistant cell lines at baseline as measured by RNA-seq. Adjusted p values are FDR calculated using the Benjamini Hochberg method within the GSEA software. d, heatmap of correlation coefficients of differentially expressed genes in TNBC cell lines generated in this study as DMSO treated samples or sourced from the CCLE dataset. e, relative cell counts of five additional TNBC cell lines predicted to be sensitive or resistant by machine learning models. Data are mean ± s.d. of biological independent samples. n = 3. f, performance metrics for machine learning models. g, oncoprint of TNBC tumours from TCGA firehose dataset with alterations for AKT3, PTEN, INPP4B, and PIK3CA denoted.
Extended Data Fig. 7
Extended Data Fig. 7. Data related to Fig. 4.
a, Chromatin looping architecture of GATA3 enhancer linked to GATA3 promoter using MCF10A HiC data from ENCODE. b, Genome browser view of GATA3 enhancer with ATAC-seq and CUT&RUN for H3K27me3 data from MDA-MB-468 cells treated with EZH2i and/or AKTi. Data is overlaid with HiC data for MCF10A and MCF7 cells. Note the ATAC-seq and CUT&RUN data are identical to in Fig. 4a for direct comparison purposes. c, schematic for siRNA screen completed in Fig. 4b.
Extended Data Fig. 8
Extended Data Fig. 8. Data related to Fig. 4.
a, immunoblot of FOXO1 and pFOXO1 expression in TNBC cell lines treated with EZH2i and/or AKTi. Experiment was repeated at least 3 times. b, RT-qPCR of FOXO1 expression after EZH2i and/or AKTi treatment in three sensitive TNBC cell lines. Values indicate z scores of three independent biological samples. c, genome browser view of FOXO1 locus with CUT&RUN data using H3K27me3 and H3K4me3 antibodies in chromatin from MDA-MB-468 cells treated with EZH2i and/or AKTi. d, genome browser view of GATA3 promoter with FOXO1 ChIP-seq occupancy (accessed from ENCODE). e, genome browser view of GATA3 enhancer with FOXO1 ChIP-seq occupancy (accessed from ENCODE).
Extended Data Fig. 9
Extended Data Fig. 9. Data related to Fig. 5.
a, ssGSEA z scores of HALLMARK_APOPTOSIS gene signatures in SUM149PT and MDA-MB-468 cells treated with AKTi and/or EZH2i. b, Relative BMF mRNA expression (RT-qPCR) in SUM149PT cells treated with EZH2i and/or AKTi. c, Protein expression of BMF in HCC1395 cells treated with EZH2i and/or AKTi with stable HA knocked-into the endogenous BMF locus. d-e, Relative change in cell number (f) or BMF expression (e) of SUM149PT cells transfected with siControl or siBMF e and then treated with EZH2i and/or AKTi. f, Transcriptional heatmap depicting expression of significantly differentially expressed genes from Fig. 5d in MDA-MB-468 cells. g, involution gene mRNA expression measured by RT-qPCR in SUM149PT cells transfected with siControl or siSTAT3 in response to indicated drugs. h, Relative change in cell number of MDA-MB-468 cells treated with EZH2i+AKTi or docetaxel (10 nM) after 4 days. i, BMF expression (z-score of DESeq2 normalized counts) in MDA-MB-468 cells treated with EZH2i+AKTi or docetaxel. j, Immunoblot depicting activation of STAT3 (pSTAT3) and target inhibition after treatment with EZH2i+AKTi or docetaxel in MDA-MB-468 cells. k -l, ssGSEA z scores (k) or heatmap (l) of Mammary Gland Involution gene signatures in MDA-MB-468 cells treated with indicated drugs. m,n, Immunoblots depicting confirmation of STAT3 knockdown and inhibition of AKT and EZH2 targets in SUM149PT (m) or MDA-MB-468 (n) cells. Related to Fig. 5i. o, immunoblot of SUM149PT cells transfected with siControl or siJAK1 and then treated with indicated drugs. Related to Fig. 5j. For all subfigures, data are mean ± s.d. of biological independent samples (n = 3), p values measured by unpaired one-tailed heteroscedastic Student’s T-test, box plots show range of data with line at mean, immunoblots were repeated at least 3 times, EZH2i = tazemetostat, AKTi = ipatasertib, and docetaxel dosed at 10 nM.
Extended Data Fig. 10
Extended Data Fig. 10. Data related to Fig. 6.
a, relative IL6 protein (z score) in SUM149PT and MDA-MB-468 cells after 24 h of treatment with EZH2i (tazemetostat) and/or AKTi (ipatasertib). b, Relative IL6R expression in SUM149PT and MDA-MB-468 cells transfected with siRNA against a control sequence or IL6R and then treated with vehicle or EZH2i+AKTi. Related to Fig. 6a. c, Relative cell numbers of SUM149PT and MDA-MB-468 cells treated with vehicle, EZH2i+AKTi, and/or neutralizing antibody against IL6R (tocilizumab). d, relative IL6 protein level (ELISA) in MDA-MB-468 cells transfected with siControl or siSTING and treated with indicated drugs for 24 hr. n = 2. e, 2′3′-cGAMP levels measured by ELISA in MDA-MB-468 cells after treatment with indicated drugs. f, volcano plot depicting -log10(FDR) versus log2(fold change) for expression of endogenous retroviruses in EZH2i vs DMSO treated MDA-MB-468 cell line. g, transcriptional heatmap of BMF levels in a panel of TNBC cell lines treated with EZH2i and/or AKTi and harvested after 24 h. BMF levels were normalized to STAU1 and then relative expression was normalized to each cell line’s DMSO samples. Data for sensitive cell lines is generated from same experiment as Fig. 5a. Heatmap values indicate fold change. h, relative cell numbers of SUM159PT cells transduced with GFP or GATA3 overexpression construct treated with EZH2i+AKTi and/or STING agonist ADUS100. For all subfigures, data are mean ± s.d. of biological independent samples. Unless indicated, all experiments are n = 3. p values measured by unpaired one-tailed heteroscedastic Student’s T-test.

References

    1. Waks, A. G. & Winer, E. P. Breast cancer treatment: a review. JAMA321, 288–300 (2019). - PubMed
    1. Garrido-Castro, A. C., Lin, N. U. & Polyak, K. Insights into molecular classifications of triple-negative breast cancer: improving patient selection for treatment. Cancer Discov.9, 176–198 (2019). - PMC - PubMed
    1. Nik-Zainal, S. et al. Landscape of somatic mutations in 560 breast cancer whole-genome sequences. Nature534, 47–54 (2016). - PMC - PubMed
    1. Stephens, P. J. et al. The landscape of cancer genes and mutational processes in breast cancer. Nature486, 400–404 (2012). - PMC - PubMed
    1. Kim, M. et al. A protein interaction landscape of breast cancer. Science374, eabf3066 (2021). - PMC - PubMed

MeSH terms

Substances