. 2024 Nov;635(8038):481-489.
doi: 10.1038/s41586-024-08030-7. Epub 2024 Oct 9.

Temporally distinct 3D multi-omic dynamics in the developing human brain

Affiliations

Temporally distinct 3D multi-omic dynamics in the developing human brain

Matthew G Heffel et al. Nature. 2024 Nov.

Abstract

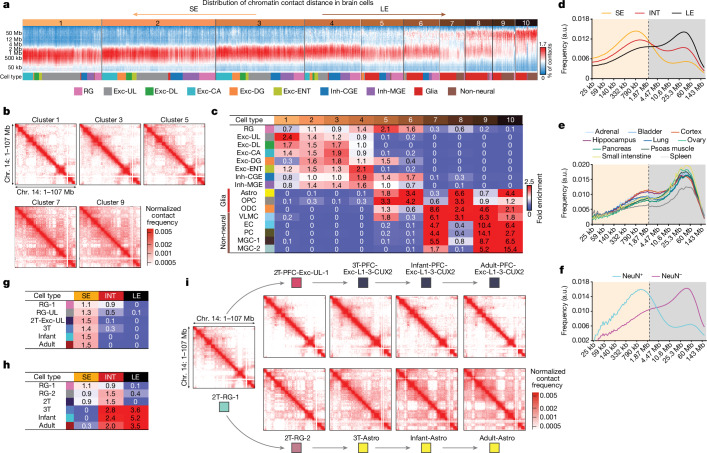
The human hippocampus and prefrontal cortex play critical roles in learning and cognition1,2, yet the dynamic molecular characteristics of their development remain enigmatic. Here we investigated the epigenomic and three-dimensional chromatin conformational reorganization during the development of the hippocampus and prefrontal cortex, using more than 53,000 joint single-nucleus profiles of chromatin conformation and DNA methylation generated by single-nucleus methyl-3C sequencing (snm3C-seq3)3. The remodelling of DNA methylation is temporally separated from chromatin conformation dynamics. Using single-cell profiling and multimodal single-molecule imaging approaches, we have found that short-range chromatin interactions are enriched in neurons, whereas long-range interactions are enriched in glial cells and non-brain tissues. We reconstructed the regulatory programs of cell-type development and differentiation, finding putatively causal common variants for schizophrenia strongly overlapping with chromatin loop-connected, cell-type-specific regulatory regions. Our data provide multimodal resources for studying gene regulatory dynamics in brain development and demonstrate that single-cell three-dimensional multi-omics is a powerful approach for dissecting neuropsychiatric risk loci.


Conflict of interest statement

Competing interests J.R.E. serves on the scientific advisory board of Zymo Research. A.D.S. is an employee of Arima Genomics.

Figures

Fig. 1
Fig. 1. Profiling of epigenomic and chromatin conformation dynamics during human brain development using snm3C-seq3.
a, Schematics of the study. Illustrations of developing human brain by Byron Ashley. be, Dimensionality reduction using uniform manifold approximation and projection (UMAP) distinguishes cell types (b), major cell lineages (c), brain regions (d) and developmental stages (e). Astro, astrocyte; CGE, caudal ganglionic eminence; DG, dentate gyrus; DL, deep layer; ENT; entorhinal cortex; Exc, excitatory neurons; Inh, inhibitory neurons; MGC, microglia; MGE, medial ganglionic eminence; ODC, oligodendrocyte; OPC, oligodendrocyte progenitor cell; UL, upper layer. f, Reconstructed developmental hierarchy of excitatory neurons and glial cells. 2T, second trimester or mid-gestation; 3T, third trimester or late gestation; NP, near-projecting; Sub, subiculum. g,h, Dynamics of genome-wide non-CG methylation (g) and CG methylation (h) during human brain development.
Fig. 2
Fig. 2. Temporal order of DNA methylation and chromatin conformation reconfiguration during the differentiation of astrocytes.
ac, UMAP dimensionality reduction of cortical RG-derived neuronal and glial cells. The UMAP is labelled by joint pseudotime scores computed using the fusion of DNA methylation and chromatin confirmation information (a), cell types (b) and sample ages (c). d, Distribution of Pearson’s coefficients for CG methylation–RNA and 3CGS–CG methylation correlations. e,f, Normalized gene body CG methylation (e) and 3CGS (f) for cell-type-specific marker genes. g, Absence of non-CG methylation accumulation at cell-type marker genes. h,i, Dimensionality reduction and pseudotime scores computed from CG methylation in neural progenitor RG-1, astrocyte progenitor RG-2 and astrocyte populations. j,k, Dimensionality reduction and pseudotime scores computed from chromatin conformation in RG-1, RG-2 and astrocyte populations. l, Distinct distributions of pseudotime scores computed from CG methylation or chromatin conformation during astrocyte differentiation. m, Direct comparison of pseudotime scores computed from CG methylation or chromatin conformation in individual cells across astrocyte differentiation, labelled by cell types. n,o, Examples of genes showing CG methylation (n) and 3CGS (o) dynamics during the differentiation of astrocytes.
Fig. 3
Fig. 3. Remodelling of global chromatin conformation during human brain development.
a, k-means clustering analysis groups single-cell 3C profiles by the distance distribution between interacting loci. b, Merged chromatin interaction profiles of the odd-numbered clusters identified in a. c, Cell-type-specific enrichments of clusters identified in a. EC, endothelial cell; PC, pericyte; VLMC, vascular leptomeningeal cell. df, Comparison of SE, LE and INT chromatin conformation found in single brain cells (d), bulk Hi-C profiles of diverse human tissues (e) and isolated neuronal and glial nuclei from primary adult human brain specimens (f). The vertical dashed lines indicate the threshold that separates short-range (coloured in orange) from long-range interactions (coloured in grey). a.u., arbitrary units. g,h, Remodelling of global chromatin conformation during the differentiation of upper-layer excitatory neurons (Exc-L1-3-CUX2) (g) and astrocytes (h) from the common RG-1 progenitor. i, Merged chromatin interaction profiles of developing cell populations across the differentiation of upper-layer excitatory neurons and astrocytes.
Fig. 4
Fig. 4. Multimodal imaging reveals SE chromatin conformation in newly differentiated hippocampal neurons.
a, Sequential imaging of 354 genomic regions on the median-sized chromosome 14 using 119 rounds of hybridization with three-colour imaging. b, 3D localization of each genomic region in a single nucleus. c, Reconstruction of single-molecule chromatin conformation for two chromosome 14 homologues in a single nucleus. d, Overview of the tissue section containing HPC and choroid plexus structures. FIM, fimbria; CP, choroid plexus. e, Example of multiplexed RNA imaging using MERFISH. f, UMAP dimensionality reduction of the RNA MERFISH profile and cell-type annotation. g, Spatial localization of annotated cell types. h, Spatial expression patterns of marker genes for cell types shown in g. in, Reconstruction of chromatin conformation for CA1 (i), dentate gyrus (j), excitatory neuron, choroid plexus cell types (k), ependymal cells (l), RG-1 (m) and RG-2 (n). o,p, Quantification of spatial distance in micrometres as a function of genomic distance in megabases for differentiated brain cell types (o) and RG progenitor cells (p). q, Imaging of nuclear architectural proteins and histone modifications. r, Correlation of active and repression protein markers across genomic loci on chromosome 14. s,t, Quantification of nuclear volume (s) and mean H3 K9 trimethylation intensity (t) on chromosome 14 in distinct cell types. n = 24,099 imaged cells. The centre of the box plot marks the median, with each box above or below the median representing 10 percentiles of the data distribution. u, Correlation of the spatial distance for loci with near-range and long-range genomic distance with nuclear volume or mean intensities for protein markers on chromosome 14. Abs., absolute. Scale bars, 5 μm (a,b,q), 250 μm (d,g), 20 μm (e).
Fig. 5
Fig. 5. Localizing the heritability signals of neuropsychiatric disorders using DMRs and chromatin loops.
a, k-means clustering of DMRs reveals specificities for cell lineages and developmental stages. b, Schematic of the maturation of MGE-derived ERBB4-expressing inhibitory neurons (Inh-MGE-ERBB4). c, Numbers of trajectory-DMRs identified for Inh-MGE-ERBB4 maturation between adjacent developmental stages. d, Enriched TF-binding motifs in trajectory-DMRs for the maturation of Inh-MGE-ERBB4 neurons. The enrichment of TF-binding motif is determined using hypergeometric tests with a q value threshold of 0.01 for display. e, Schematic of the specification of RG-1-derived cell types. f, Numbers of branch-DMRs found during RG-1 differentiation. g, TF-binding motif enrichments in branch-DMRs associated with RG-1 differentiation. h, The enrichment of schizophrenia polygenic heritability in DMRs and loop-connected DMRs. The P value was computed using a two-sided paired t-test. i, Numbers of schizophrenia-associated loci containing at least one fine-mapped variant that overlaps with DMRs or loop-connected DMRs. j, Spearman’s correlation and two-sided P value between the enrichment of polygenic heritability and fine-mapped schizophrenia variants. k, Enrichment of polygenic heritability for schizophrenia and bipolar disorder in PDZRN4-expressing layer 5–6 excitatory neurons across developmental stages. Error bars indicate standard errors estimated by the linkage disequilibrium score regression block jackknife method (n = 200 blocks). l, Statistical significance of differential heritability enrichment between development stages. P values were computed using two-sided t-tests. Red and blue colours show developmentally increased or decreased heritability enrichment, respectively. NS, not significant. m, Meta-analysis of heritability enrichment for schizophrenia and bipolar disorder in excitatory neuron populations. Error bars indicate standard deviations across cell types included in the meta-analysis. n = 5 cell types for the second trimester, n = 9 for the third trimester, n = 16 for infant, n = 17 for adult.
Extended Data Fig. 1
Extended Data Fig. 1. Multi-modal classification of brain cell types in developmental specimens.
(a) Brain regional specificity of identified cell types. (b-c) Inversed correlations between gene expression and gene body CG methylation (b) and between chromatin accessibility (gene activity score) and gene body CG methylation (c). (d-g) UMAP dimensionality reduction of the integration of snm3C-seq3 and snRNA-seq datasets with the visualization of snRNA-seq clusters (d), snm3C-seq3 clusters (e), joint clusters (f), and assay type (g). (h) Comparison of cell type classification using snm3C-seq3 and snRNA-seq using a confusion matrix. (i) Comparison of cell type composition in snm3C-seq3 and snRNA-seq datasets. (j-m) UMAP of the Integration of snm3C-seq3 and snATAC-seq datasets with the visualization of snATAC-seq clusters (j), snm3C-seq3 clusters (k), joint clusters (l), and assay type (m). (n) Comparison of cell type classification using snm3C-seq3 and snATAC-seq using a confusion matrix. (o) Comparison of cell type composition in snm3C-seq3 and snATAC-seq datasets. (p-q) Genome-wide Euclidian distance of gene body CG methylation (p) and chromatin interaction (q) between developmental stages for each major cell type group. (r) Reconstructed developmental hierarchy of inhibitory neurons and non-neuronal cells.
Extended Data Fig. 2
Extended Data Fig. 2. Comparison of brain cell type classification using DNA methylation and chromatin confirmation signatures.
(a) Methylation dimensionality reduction using UMAP distinguishes, from left to right, cell types, major cell lineages, brain regions, and sample age groups. (b) Chromatin conformation dimensionality reduction using UMAP distinguishes, from left to right, cell types, major cell lineages, brain regions, and sample age groups. (c) Riverplot to show extensive consistency in adult major cell lineage annotation between DNA methylation and chromatin conformation modalities. (d) Dimensionality reduction using UMAP shows resolution difference in cell-type classification using DNA methylation and chromatin conformation modalities in adult inhibitory neurons; CGE-derived (top), MGE-derived (bottom). (e) Showing distinction of RG-1 and RG-2 populations in methylation space (left), chromatin conformation space (middle), and joint dimensionality reduction space (right). (f) Dimensionality reduction of z-scored CG methylation feature matrix for cells from mid-gestational brains (left). Chromatin conformation dimensionality reduction of cells from mid-gestational brains (right).
Extended Data Fig. 3
Extended Data Fig. 3. In situ validation of cell-type marker genes predicted by CG methylation patterns.
(a) UMAP of brain cells derived from late-gestational HPC samples. (b) UMAP showing TLL1 CG hypomethylation for more matured granule neurons. (c) UMAP showing TRPS1 CG hypomethylation in Mossy Cells and partially in CA3 neurons. (d) UMAP showing LRIG1 hypomethylation in astrocytes. (e) single molecular RNA in situ detection of TLL1, PROX1, and RBFOX3 transcripts in the hippocampus in the third trimester (GW 30 GW). (f) single molecular RNA in situ detection of TPRS1, GAD1, and RBFOX3 transcripts in the hippocampus in the third trimester. (g) single molecular RNA in situ detection of LRIG1 and ALDH1L1 transcripts in the hippocampus in the third trimester. (h) Quantification of LRIG1/ALDH1L1 co-expression (N = 4 imaging fields of view).
Extended Data Fig. 4
Extended Data Fig. 4. Remodeling of global chromatin conformation during human brain development.
(a) Merged chromatin interaction profiles of even clusters identified in Fig. 3a. (b) Distribution of the distance between interaction loci of clusters identified in Fig. 3a. (c) Empirical p-values for the difference in distances of chromatin contact between pairs of clusters in Fig. 3a and Extended Data Fig. 4a. (d) Percentage of each brain cell type assigned to clusters identified in Fig. 3a. (e) Cell-type specific enrichments of SE (Short-range interaction Enriched), LE (Long-range interaction Enriched), and INT (Intermediate) chromatin conformation. (f) Percentage of each brain cell type classified as SE, LE, or INT conformation. (g-k) Remodeling of global chromatin conformation during the differentiation of Exc-CA-1 (g), Exc-DG (h), Inh-MGE-ERBB4 (i), Inh-CGE-CHRNA2 (j), and MGC-1 & MGE-2 (k).
Extended Data Fig. 5
Extended Data Fig. 5. Chromatin- and RNA-MERFISH analysis of mid-gestational human brain development.
(a-b) Comparison of contact matrices derived from imaging (lower left) and snm3C-seq3 (upper right) for HPC-Exc-CA (a) and HPC-RG-2 (b). (c-d) Correlation of snm3C-seq3 contact frequency to spatial distances quantified with imaging for HPC-Exc-CA (c) and HPC-RG-2 (d). (e) Quantification of spatial distance in µm as a function of genomic distance in Mb for brain cell types. (f-g) Comparison of the spatial distances of short-range interactions (f) and long-range interactions (g) between RG-1 and RG-2. (h) Quantification of protein marker density across the length of chromosome 14. (i-m) Median log (density) of NUP98 (i), LAMA1 (j), Pol2ser2 (k), SRSF2 (l), and H3K27ac (l) on chromosome 14.
Extended Data Fig. 6
Extended Data Fig. 6. Chromatin compartment dynamics across cell types and developmental stages.
(a) Relationship between compartmentalization and the dominance of median vs. long-range interactions across cell types. (b-c) Differing dominance of chromatin interactions in the active A compartment or the inactive B compartment between neuronal (Exc+Inh) and microglia (MGC) populations. (d) Comparison of chromatin compartment strength between neuronal and non-neuronal cells using Hi-C data (Hu et al., 2021) generated from isolated nuclei 30. (e-f) Decrease in compartment strength from 2T to 3T. Saddle plots are shown in (f) to quantify the interaction inside or between the active A compartment and the inactive B compartment. (g) A/B compartment saddle-plots for 4 cell trajectories, showing a general decrease in compartmentalization from mid-gestation to late-gestation, as well as the dominance of interactions in the inactive B compartment in HPC-MGC-1 (bottom row). (h) Number of genomic regions switching from A to B compartment or from B to A compartment in each cell-type development trajectory. (i) Compartmental and CG methylation dynamics at SOX2 and GLI3 loci during the differentiation of cortical upper layer excitatory neurons. (j-l) Correlation between developmental changes of CG methylation and compartmental dynamics. Changes in CG methylation compared to the earliest developmental stage were shown for (j) excitatory neurons, (k) astrocytes, and (l) inhibitory neurons.
Extended Data Fig. 7
Extended Data Fig. 7. Chromatin loop dynamic across cell types and developmental stages.
(a) Correlation between the number of cells in each cell population and the number of chromatin loops identified. (b-f) Aggregated chromatin contact signals at differential loops identified across cell types in the adult brain (b), cell types in the mid-gestational brain (c), developmental stages for the Exc-UL trajectory (d), developmental stages for the astrocyte trajectory (e), and subtypes of MGE derived inhibitory neurons in the infant brain (f). The value above each aggregated profile indicates the APA score to evaluate the enrichment of identified loops with respect to the lower left background. (g) Numbers of gain or lost loops across the trajectories of cell type differentiation. (h) Identification of SIPs in PFC-2T-RG-1. (i) Gene expression patterns of the top 250 genes whose promoter is associated with the highest cumulative loop scores in PFC-2T-RG-1. (j) Identification of SIPs in PFC-adult-Exc-UL. (k) Gene expression pattern of top 250 genes whose promoter associated with the highest cumulative loop scores in PFC-adult-Exc-UL. (l) Chromatin loops dynamics at POU3F3 (BRN1) and KHDRBS3 (SLM2) loci across developmental stages. (m) Identification of dev-SIPs associated with the differentiation of Exc-UL. Gene expression patterns of dev-SIPs showing either developmental increase or decrease of loop scores were shown on the left.
Extended Data Fig. 8
Extended Data Fig. 8. Correlation between chromatin loop dynamics and CG methylation level of the loop anchor regions.
(a) Distribution of the Pearson’s correlation coefficients between loop strength and CG methylation of loop anchor regions for developmentally differential loops. (b-e) Correlation between loop strength and CG methylation of loop anchor regions across astrocyte differentiation. (b) Normalized loop contact frequencies (cyan) and CG methylation levels of anchor regions (magenta) across meta-cells ranked by developmental pseudotime scores. (c-d) Normalized values of loop interaction frequency (c) and CG methylation of loop anchor regions (d). (e) Quantification of the lag of CG methylation remodeling by the amount of pseudotime shife (in counts of meta-cells) required to maximize the inverse correlation between loop strength and CG methylation levels of loop anchor regions. (f-i) Correlation between loop strength and CG methylation of loop anchor regions across the differentiation of cortical upper layer excitatory neurons.
Extended Data Fig. 9
Extended Data Fig. 9. Cell-type and developmental dynamics of chromatin domain boundaries.
(a) Aggregated chromatin contact signals at differential chromatin domain boundaries identified in the differentiation of Exc-UL and Astro. The value above each aggregated plot indicates 1/(insulation score), so a greater score indicates stronger insulation. (b) Numbers of gain or lost domain boundaries across the trajectories of cell type differentiation. (c) non-CG methylation level at domain boundaries identified for each cell type trajectory. Analysis of true boundaries (solid lines) shuffled (dashed lines). (d-e) Differential chromatin domain boundaries were identified during the differentiation of astrocytes at SLC1A2 (d) and SOX11 (e) loci.
Extended Data Fig. 10
Extended Data Fig. 10. Heritability enrichment analysis of neuropsychiatric disorders.
(a-b) The enrichment of polygenic heritability for bipolar disorder (a), major depression (b), ADHD (c), ASD (d), Alzheimer’s disease (e), and height (f) in DMRs and loop-connected DMRs. (g) The genomic region overlapping with a putative causal variant for schizophrenia rs500102 is connected to the RORB promoter through a cell-type-specific loop domain. (h-m) Enrichment of polygenic heritability for neuropsychiatric disorders across developmental stages in PFC-Exc-L5-6-PDZRN4 (h), PFC-Exc-L1-3-CUX2 (i), PFC-Exc-L4-5-FOXP2 (j), HPC-Exc-CA1 (k), PFC-Inh-MGE-ERBB4 (l), PFC-Inh-CGE-CHRNA2 (m). (n-o) Meta-analysis of heritability enrichment for neuropsychiatric disorders in excitatory (n) and inhibitory (o) neuron populations.

References

    1. Kolb, B. et al. Experience and the developing prefrontal cortex. Proc. Natl Acad. Sci. USA109, 17186–17193 (2012). - PMC - PubMed
    1. Rubin, R. D., Watson, P. D., Duff, M. C. & Cohen, N. J. The role of the hippocampus in flexible cognition and social behavior. Front. Hum. Neurosci.8, 742 (2014). - PMC - PubMed
    1. Lee, D.-S. et al. Simultaneous profiling of 3D genome structure and DNA methylation in single human cells. Nat. Methods16, 999–1006 (2019). - PMC - PubMed
    1. Molyneaux, B. J., Arlotta, P., Menezes, J. R. L. & Macklis, J. D. Neuronal subtype specification in the cerebral cortex. Nat. Rev. Neurosci.8, 427–437 (2007). - PubMed
    1. Hodge, R. D. et al. Conserved cell types with divergent features in human versus mouse cortex. Nature573, 61–68 (2019). - PMC - PubMed

MeSH terms