. 2024 Oct 9;21(1):254.
doi: 10.1186/s12974-024-03243-z.

CX3CR1+/UCHL1+ microglial extracellular vesicles in blood: a potential biomarker for multiple sclerosis

Affiliations

CX3CR1+/UCHL1+ microglial extracellular vesicles in blood: a potential biomarker for multiple sclerosis

Jing Duan et al. J Neuroinflammation. .

Abstract

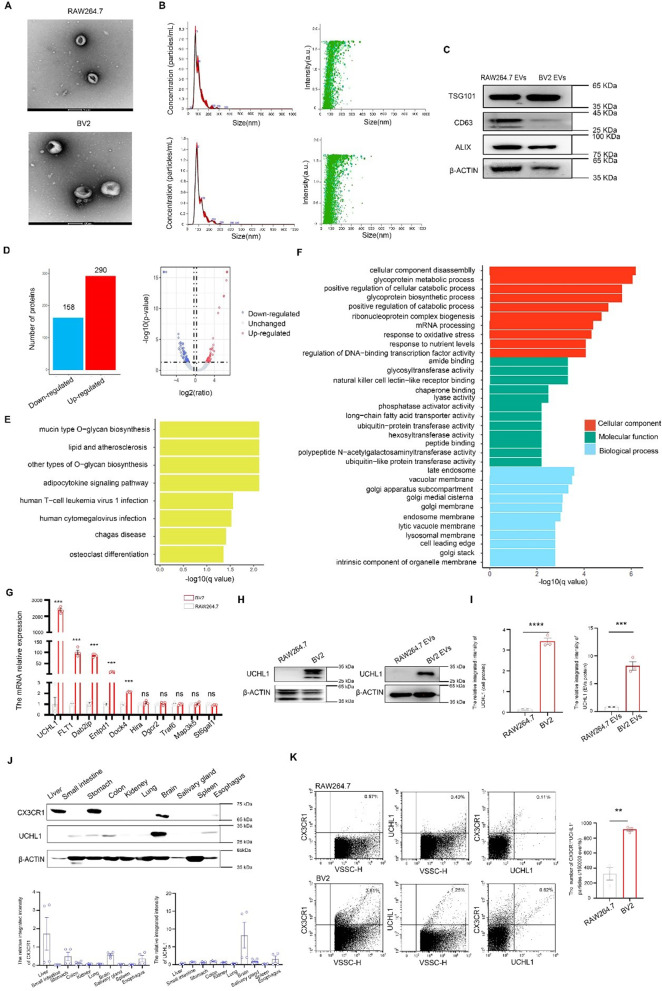
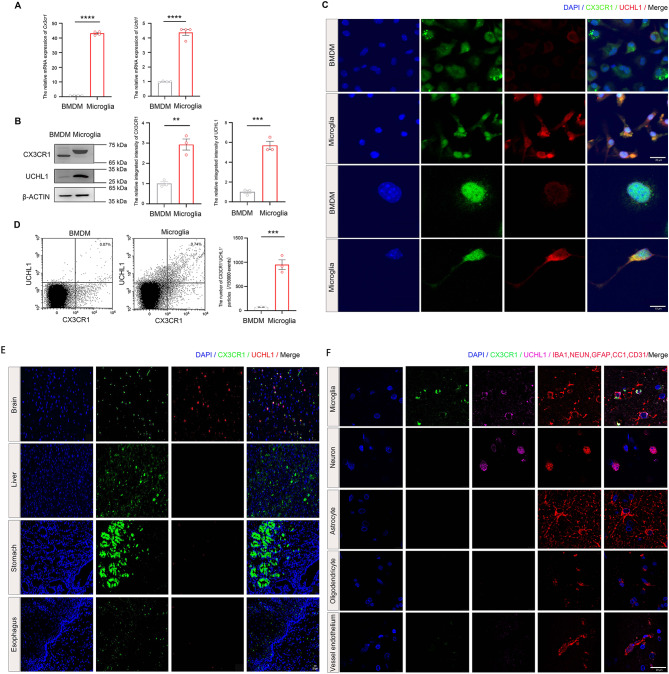
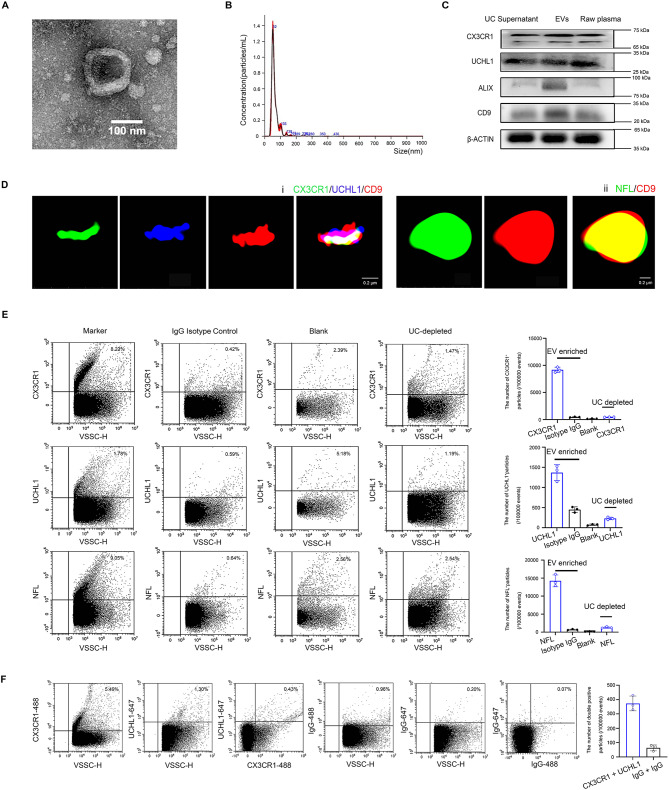
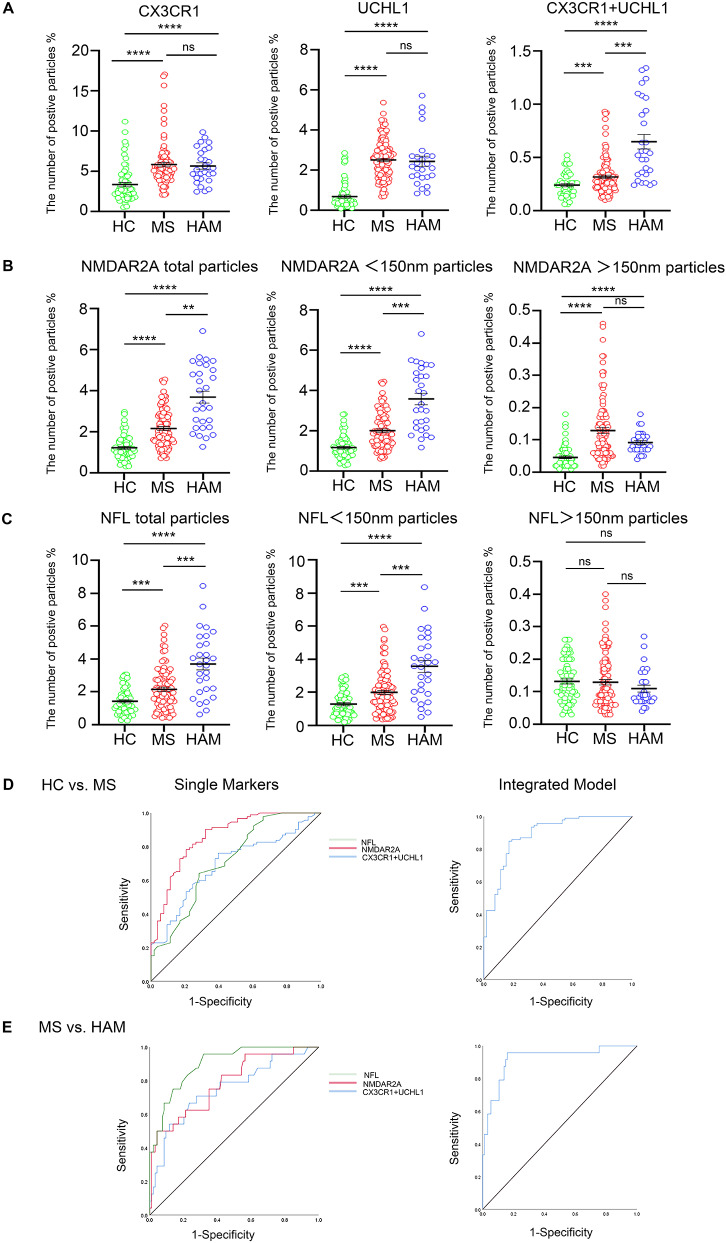
In neuroinflammation, distinguishing microglia from macrophages and identifying microglial-specific biomarkers in peripheral blood pose significant challenges. This study comprehensively profiled the extracellular vesicles (EVs) of microglia and macrophages, respectively, revealing co-expressed EVs with UCHL1 and CX3CR1 as EVs derived specifically from microglia in human blood. After extensive validation, using optimized nano flow cytometry, we evaluated plasma CX3CR1+/UCHL1+ EVs across clinical cohorts [multiple sclerosis (MS), HTLV-1 associated myelopathy (HAM), Alzheimer's disease (AD), and Parkinson's disease (PD)], along with established neurodegenerative markers (NMDAR2A and NFL). The findings discovered a notable rise in CX3CR1+/UCHL1+ EVs in MS, particularly heightened in HAM, in contrast to controls. Conversely, AD and PD exhibited unaltered or diminished levels of microglial EVs. An integrated model of CX3CR1+/UCHL1+, NMDAR2A+, and NFL+ EVs demonstrated promising diagnostic potential for distinguishing MS from controls and HAM. As to the disease duration, CX3CR1+/UCHL1+ EVs increased in the initial five years of MS, stabilizing thereafter, whereas NMDAR2A+ and NFL+ EVs remained stable initially but increased significantly in the subsequent five years, suggesting their correlation with disease duration. This study uncovers unique blood microglial EVs with potential as biomarkers for MS diagnosis, differentiation from HAM, and correlation with disease duration.

Keywords: Biomarker; CX3CR1; Extracellular vesicles; Microglia; Multiple sclerosis; UCHL1.


Conflict of interest statement

The authors declare no competing interests.

Figures

Fig. 1
Fig. 1
UCHL1 was a highly specific protein in BV2 EVs confirmed by mass spectrum screening. (A) Characteristic electron microscopy images of the EVs derived from BV2 and RAW264.7. (B) Representative NTA images showed the population of EVs derived from BV2 and RAW264.7. (C) WB images showed the exosome markers (TSG101, CD63, and ALIX) expressed in the EVs of BV2 and RAW264.7. (D) The bar plot and Volcano plot showed the different proteins between BV2 and RAW264.7 EVs. (E) KEGG analysis of different proteins between BV2 and RAW264.7 EVs. (F) GO analysis of different proteins between BV2 and RAW264.7 EVs. (G) qPCR verified the top 10 of different proteins between BV2 and RAW264.7. (H) WB images showed the UCHL1 expression in BV2 and RAW264.7 and the EVs secreted from those cells. (I) Quantification of the relative integrated intensity of cell protein and EVs protein in BV2 and RAW264.7 by WB. (J) Typical WB images for CX3CR1 and UCHL1 and their quantification of relative integrated intensity in different mouse organs. ***p < 0.001 versus other groups. (K) Representative images for double labeling CX3CR1 and UCHL1, along with the quantification of double-positive particles in BV2 and RAW264.7 EVs. All values are mean ± SEM. n = 3–4 in each group. **p < 0.01, ***p < 0.001, ****p < 0.0001, ns, no significance
Fig. 2
Fig. 2
Specific co-expression of CX3CR1 and UCHL1 in microglia. (A) Quantification of the relative mRNA expressions of Cx3cr1 and Uchl1 in primary cultured Bone marrow-derived macrophage (BMDM) and microglia by qPCR. (B) Representative images of WB showed the expression of CX3CR1 and UCHL1 in primary cultured BMDM and microglia. (C) Representative immunostaining images for CX3CR1 and UCHL1 in primary cultured BMDM and microglia. (D) Images for double labeling CX3CR1 and UCHL1 in the EVs from BMDM and microglia and quantification of the double positive particles by Cytoflex LX. (E) Representative immunostaining images for CX3CR1 and UCHL1 in human brain, liver, stomach, and esophagus sections. (F) Representative immunostaining images for CX3CR1 and UCHL1 colocalization in different cell types (IBA1 for microglia, NEUN for neuron, GFAP for astrocyte, CC1 for oligodendrocyte, CD31 for brain microvascular endothelial cells) in human brain sections. All values are mean ± SEM. n = 3–4 in each group. **p < 0.01, ***p < 0.001, ****p < 0.0001
Fig. 3
Fig. 3
Characterization of microglia-derived EVs in human plasma. (A) A representative. TEM image of EVs isolated from human plasma showed double-layered membrane-bound vesicles. (B) NTA showed a population of EVs with a peak around 70 nm. (C) Representative images of WB showed the expression of microglia-specific markers (CX3CR1 and UCHL1) and EV markers (ALIX and CD9) in the isolated EVs from plasma, raw human plasma and the supernatant of plasma ultracentrifugation. (D) Typical STORM images showed CX3CR1 and UCHL1 colocalized on the CD9 marked EV membranes. Moreover, NFL was localized on the CD9-marked EV membranes. Notably, the size of EV signals in STORM exceeds 200 nm, which may be attributed to PFA fixation and the algorithm-based approach, both of which introduce certain biases when characterizing the size of EVs. (E) Representative histograms showed the populations of EVs positive for each marker (CX3CR1, UCHL1, and NFL), fluorophore-conjugated IgG isotype control, a blank (fluorophore only, no antibody) control experiment, and UC-depleted (plasma with depletion of EVs by ultracentrifugation). Quantification data of positive EVs detected by the flow cytometry-based assay demonstrating the specificity of EV assays. (F) Representative images for double labeling of microglial EV markers (CX3CR1 and UCHL1) and isotype IgG in a pooled human plasma sample (combined plasma from 40 individuals). All values are mean ± SEM. n = 3 in each group
Fig. 4
Fig. 4
Performance of CX3CR1+/UCHL1+, NMDAR2A+, and NFL+ EVs in MS cohort. The percentage of biomarker-positive particles in the total of 150,000 particles counted by nano flow cytometry is shown in the graphs. (A) The percentage of CX3CR1+/UCHL1+ EVs was significantly higher in MS than in HC, and remarkably lower in MS than in HAM. (B) The percentage of NMDAR2A+ EVs was significantly higher in MS than in HC, and markedly lower in MS than in HAM. (C) The percentage of NFL+ EVs was significantly higher in MS than in HC, and markedly lower in MS than in HAM. (D) ROC curves showed the separation of MS from HC using EVs carrying CX3CR1 + UCHL1, NMDAR2A and NFL. An integrative model including all EV markers distinguishes MS from HC. (E) ROC curves showed the separation of MS from HAM using EVs carrying CX3CR1 + UCHL1, NMDAR2A and NFL. An integrative model including all EV markers distinguishes MS from HAM. All values are mean ± SEM. n = 67 for HC, 113 for MS, and 29 for HAM. **p < 0.01, ***p < 0.001, ****p < 0.0001, ns, no significance
Fig. 5
Fig. 5
Analysis of the disease duration of microglia- and synapse-derived EVs in MS and HAM. (A) The relationship between the number of CX3CR1+/UCHL1+ particles and disease duration in MS and HAM. (B) The relationship between the number of NMDAR2A+ particles and disease duration in MS and HAM. (C) The relationship between the number of NFL+ particles and disease duration in MS and HAM. n = 54 for MS and 28 for HAM. *P < 0.05 and **P < 0.01

References

    1. 1. Gullotta GS, Costantino G, Sortino MA, Spampinato SF. Microglia and the Blood-Brain Barrier: An External Player in Acute and Chronic Neuroinflammatory Conditions. Int J Mol Sci. 2023; 24. - PMC - PubMed
    1. 2. Walsh J, Tozer DJ, Sari H, Hong YT, Drazyk A, Williams G, et al. Microglial activation and blood-brain barrier permeability in cerebral small vessel disease. Brain. 2021; 144:1361–1371. - PMC - PubMed
    1. 3. Candelario-Jalil E, Dijkhuizen RM, Magnus T. Neuroinflammation, Stroke, Blood-Brain Barrier Dysfunction, and Imaging Modalities. Stroke. 2022; 53:1473–1486. - PMC - PubMed
    1. 4. Chang H, Ma J, Feng K, Feng N, Wang X, Sun J, et al. Elevated blood and cerebrospinal fluid biomarkers of microglial activation and blood‒brain barrier disruption in anti-NMDA receptor encephalitis. J Neuroinflammation. 2023; 20:172. - PMC - PubMed
    1. 5. Nishihara H, Perriot S, Gastfriend BD, Steinfort M, Cibien C, Soldati S, et al. Intrinsic blood-brain barrier dysfunction contributes to multiple sclerosis pathogenesis. Brain. 2022; 145:4334–4348. - PMC - PubMed