Multi-analyte proteomic analysis identifies blood-based neuroinflammation, cerebrovascular and synaptic biomarkers in preclinical Alzheimer's disease
- PMID: 39385222
- PMCID: PMC11465638
- DOI: 10.1186/s13024-024-00753-5
Multi-analyte proteomic analysis identifies blood-based neuroinflammation, cerebrovascular and synaptic biomarkers in preclinical Alzheimer's disease
Abstract
Background: Blood-based biomarkers are gaining grounds for the detection of Alzheimer's disease (AD) and related disorders (ADRDs). However, two key obstacles remain: the lack of methods for multi-analyte assessments and the need for biomarkers for related pathophysiological processes like neuroinflammation, vascular, and synaptic dysfunction. A novel proteomic method for pre-selected analytes, based on proximity extension technology, was recently introduced. Referred to as the NULISAseq CNS disease panel, the assay simultaneously measures ~ 120 analytes related to neurodegenerative diseases, including those linked to both core (i.e., tau and amyloid-beta (Aβ)) and non-core AD processes. This study aimed to evaluate the technical and clinical performance of this novel targeted proteomic panel.
Methods: The NULISAseq CNS disease panel was applied to 176 plasma samples from 113 individuals in the MYHAT-NI cohort of predominantly cognitively normal participants from an economically underserved region in southwestern Pennsylvania, USA. Classical AD biomarkers, including p-tau181, p-tau217, p-tau231, GFAP, NEFL, Aβ40, and Aβ42, were independently measured using Single Molecule Array (Simoa) and correlations and diagnostic performances compared. Aβ pathology, tau pathology, and neurodegeneration (AT(N) statuses) were evaluated with [11C] PiB PET, [18F]AV-1451 PET, and an MRI-based AD-signature composite cortical thickness index, respectively. Linear mixed models were used to examine cross-sectional and Wilcoxon rank sum tests for longitudinal associations between NULISA and neuroimaging-determined AT(N) biomarkers.
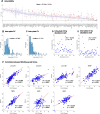
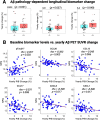
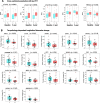
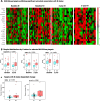
Results: NULISA concurrently measured 116 plasma biomarkers with good technical performance (97.2 ± 13.9% targets gave signals above assay limits of detection), and significant correlation with Simoa assays for the classical biomarkers. Cross-sectionally, p-tau217 was the top hit to identify Aβ pathology, with age, sex, and APOE genotype-adjusted AUC of 0.930 (95%CI: 0.878-0.983). Fourteen markers were significantly decreased in Aβ-PET + participants, including TIMP3, BDNF, MDH1, and several cytokines. Longitudinally, FGF2, IL4, and IL9 exhibited Aβ PET-dependent yearly increases in Aβ-PET + participants. Novel plasma biomarkers with tau PET-dependent longitudinal changes included proteins associated with neuroinflammation, synaptic function, and cerebrovascular integrity, such as CHIT1, CHI3L1, NPTX1, PGF, PDGFRB, and VEGFA; all previously linked to AD but only reliable when measured in cerebrospinal fluid. The autophagosome cargo protein SQSTM1 exhibited significant association with neurodegeneration after adjusting age, sex, and APOE ε4 genotype.
Conclusions: Together, our results demonstrate the feasibility and potential of immunoassay-based multiplexing to provide a comprehensive view of AD-associated proteomic changes, consistent with the recently revised biological and diagnostic framework. Further validation of the identified inflammation, synaptic, and vascular markers will be important for establishing disease state markers in asymptomatic AD.
Keywords: Amyloid pathology; NULISA with next-generation sequencing readout (NULISAseq); NUcleic acid-Linked Immuno-Sandwich Assay (NULISA); Neurodegeneration; Plasma biomarkers; Preclinical Alzheimer’s disease; Proteomics; Tau pathology.
© 2024. The Author(s).
Conflict of interest statement
Dr. Karikari has served as a consultant to Quanterix Corp., unrelated to the submitted work. The other authors declare that they have no competing interests.
Figures


Update of
-
Multi-analyte proteomic analysis identifies blood-based neuroinflammation, cerebrovascular and synaptic biomarkers in preclinical Alzheimer's disease.medRxiv [Preprint]. 2024 Jun 16:2024.06.15.24308975. doi: 10.1101/2024.06.15.24308975. medRxiv. 2024. Update in: Mol Neurodegener. 2024 Oct 10;19(1):68. doi: 10.1186/s13024-024-00753-5. PMID: 38947065 Free PMC article. Updated. Preprint.
References
-
- Masliah E. Mechanisms of synaptic dysfunction in Alzheimer’s disease. Histol Histopathol. 1995;10:509–19. - PubMed
-
- Lleó A, Núñez-Llaves R, Alcolea D, Chiva C, Balateu-Paños D, Colom-Cadena M, Gomez-Giro G, Muñoz L, Querol-Vilaseca M, Pegueroles J, et al. Changes in synaptic proteins precede neurodegeneration markers in preclinical Alzheimer’s disease cerebrospinal fluid. Mol Cell Proteomics. 2019;18:546–60. - DOI - PMC - PubMed
MeSH terms
Substances
Grants and funding
LinkOut - more resources
Full Text Sources
Medical
Research Materials
Miscellaneous

