. 2024 Oct 9;15(1):19.
doi: 10.1186/s13100-024-00333-w.

A T cell receptor specific for an HLA-A*03:01-restricted epitope in the endogenous retrovirus ERV-K-Env exhibits limited recognition of its cognate epitope

Affiliations

A T cell receptor specific for an HLA-A*03:01-restricted epitope in the endogenous retrovirus ERV-K-Env exhibits limited recognition of its cognate epitope

Erin E Grundy et al. Mob DNA. .

Abstract

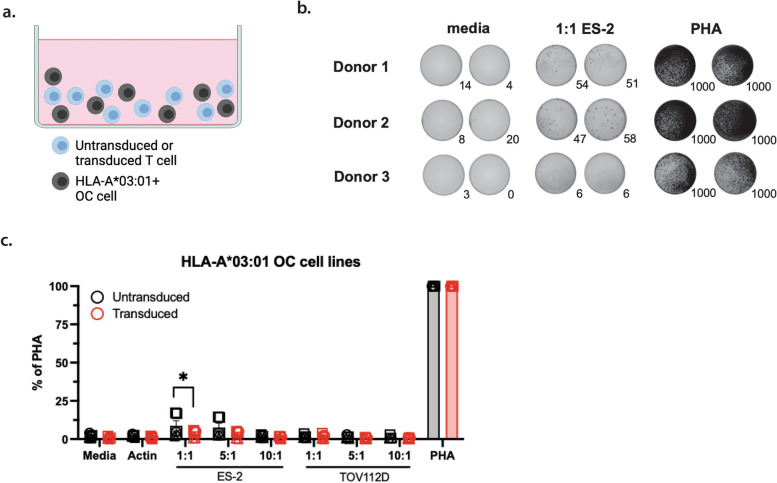
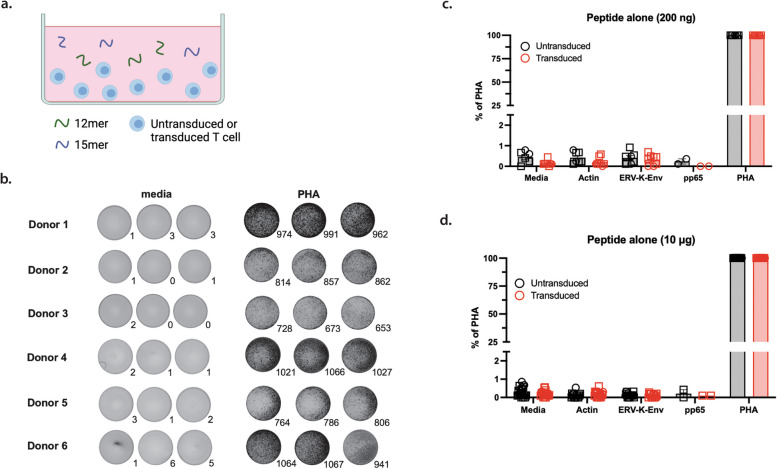
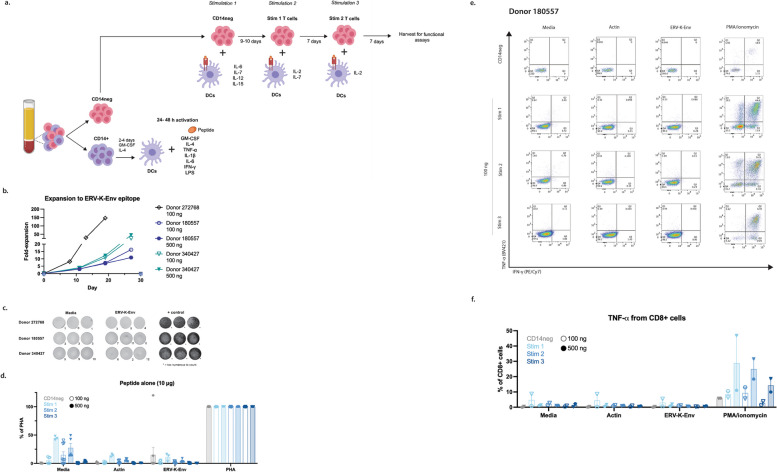
Transposable elements (TEs) are often expressed at higher levels in tumor cells than normal cells, implicating these genomic regions as an untapped pool of tumor-associated antigens. In ovarian cancer (OC), protein from the TE ERV-K is frequently expressed by tumor cells. Here we determined whether the targeting of previously identified epitope in the envelope gene (env) of ERV-K resulted in target antigen specificity against cancer cells. We found that transducing healthy donor T cells with an ERV-K-Env-specific T cell receptor construct resulted in antigen specificity only when co-cultured with HLA-A*03:01 B lymphoblastoid cells. Furthermore, in vitro priming of several healthy donors with this epitope of ERV-K-Env did not result in target antigen specificity. These data suggest that the T cell receptor is a poor candidate for targeting this specific ERV-K-Env epitope and has limited potential as a T cell therapy for OC.

Keywords: Endogenous retroviruses; Immunotherapy; T cell receptor; Transposable elements; Tumor immunology.


Conflict of interest statement

KBC is a consultant for Rome Therapeutics.

Figures

Fig. 1
Fig. 1
Lack of specificity of the ERV-K-Env-specific TCR against OC cell lines. a. Diagram of the ELISpot assay design used in b-c. b. Representative images of developed wells for the level of background IFN-γ secretion (media), IFN-γ secretion in the presence of ES-2 cells (1:1 ES-2), and positive control of IFN-γ (PHA) for the ELISpot assay quantified in c. Number of spots in each well are indicated to the bottom right of each image. Images shown are for OM9.2 T cells. c. Number of IFN-γ spots per well normalized to the positive control (expressed as % of PHA) of untransduced T cells (black) and OM9.2 T cells (red) for the indicated conditions: media = background level of IFN-γ secretion from T cells, actin = negative control, various effector:target ratios of T cells (effectors) with HLA-A*03:01 OC cell lines (targets), PHA = positive control. Each donor is indicated by a different symbol. ELISpot conditions were plated in duplicate or triplicate as cell numbers allowed for n = 3 donors. Error bars represent SEM of all data points for all donors. The Wilcoxon rank sum test was used to compare the number of IFN-γ spots between untransduced and transduced T cells (indicated by *). The Kruskal Wallis test was used to compare the number of IFN-γ spots between each antigen condition for a given T cell type. Any Kruskal Wallis test that had p < 0.05 was followed by post-hoc pairwise Wilcoxon rank sum tests and adjusted for multiple comparisons (indicated by #). All statistical comparisons for TCR experiments are in Tables S1 and S2. *p < 0.05, **p < 0.005, ***p < 0.0005. ELISpot = Enzyme-linked immunosorbent spot; PHA = phytohemagglutinin; OC = ovarian cancer; SEM = standard error of the mean
Fig. 2
Fig. 2
OM9.2 T cells were not activated by free ERV-K-Env peptide. a. Diagram of the ELISpot assay design used in b-d. b. Representative images of developed wells for the level of background IFN-γ secretion (media) and positive control of IFN-γ (PHA) for the ELISpot assays quantified in c-d. Number of spots in each well are indicated to the bottom right of each image. Images shown are for OM9.2 T cells. c-d. Number of IFN-γ spots per well normalized to the positive control (expressed as % of PHA) of untransduced T cells (black) and OM9.2 T cells (red) for the indicated conditions: media = background level of IFN-γ secretion from T cells, actin = negative control, ERV-K-Env = ERV-K-Env epitope, pp65 = HLA-B*35 off-target control, PHA = positive control. Each donor is indicated by a different symbol. ELISpot conditions were plated with the indicated peptide concentrations in duplicate or triplicate as cell numbers allowed at 200 ng for n = 2 donors (c) or at 10 µg for n = 6 donors (d). Error bars represent SEM of all data points for all donors. The Wilcoxon rank sum test was used to compare the number of IFN-γ spots between untransduced and transduced T cells (indicated by *). The Kruskal Wallis test was used to compare the number of IFN-γ spots between each antigen condition for a given T cell type. Any Kruskal Wallis test that had p < 0.05 was followed by post-hoc pairwise Wilcoxon rank sum tests and adjusted for multiple comparisons (indicated by #). All statistical comparisons for TCR experiments are in Tables S1 and S2. *p < 0.05, **p < 0.005, ***p < 0.0005. ELISpot = Enzyme-linked immunosorbent spot; PHA = phytohemagglutinin; SEM = standard error of the mean
Fig. 3
Fig. 3
OM9.2 T cells were activated by the ERV-K-Env peptide when presented by HLA-A*03:01 + B LCLs. a., d. Diagram of the ELISpot assay designs used in b.-c. and e.-f., respectively, Representative images of developed wells for OM9.2 T cell levels of background IFN-γ secretion (media) and IFN-γ secretion co-cultured with unpulsed and peptide-pulsed OM9-derived or non OM9-derived B LCLs for the ELISpot assays quantified in c. and f. Spot numbers are indicated to the bottom right of each image. Images shown for OM9.2 T cells. c., f. Number of IFN-γ spots per well normalized to the positive control (expressed as % of PHA) of untransduced T cells (black) and OM9.2 T cells (red) for the indicated conditions: Media = background level of IFN-γ secretion from T cells, B LCLs = background level of IFN-γ secretion from T cells co-cultured with unpulsed B LCLs, actin-pulsed B LCLs = negative control-pulsed B LCLs, ERV-K-Env-pulsed B LCLs = ERV-K-Env epitope-pulsed B LCLs, pp65-pulsed B LCLs = HLA-B*35 off-target control pulsed B LCLs, PHA = positive control. Each donor is indicated by a different symbol. ELISpot conditions were plated with the indicated peptide concentrations in duplicate or triplicate as cell numbers allowed for n = 2 donors (c) or n = 3 donors (f). g. Representative flow plots of intracellular IFN-γ and TNF-α staining from transduced T cells (gated on GFP + or GFP- cells) from Donor 272768 for the indicated conditions: T cells alone = background level of cytokine production from T cells, T cells + peptide = level of cytokine production from T cells in the presence of 50 µg peptide; various E:T ratios = level of cytokine production from T cells in the presence of decreasing numbers of unpulsed or peptide-pulsed non-OM9 B LCLs. B LCLs were pulsed with 10 µg peptide per million cells for 1 – 2 hours prior to plating with T cells. B LCLs and T cells were co-cultured for 6 hours in the presence of 1X protein transport inhibitors (cells alone, cells + peptide, or E:T conditions) or 1X stimulation cocktail (PMA/ionomycin). Flow gating strategy is in Figure S6c. h. Quantification of transduced T cells (GFP- = open red symbols/bars, GFP +  = closed red symbols/bars) that stained positively for TNF-α alone for the indicated conditions. Each donor is indicated by a different symbol. Error bars represent SEM of all data points for all donors. The Wilcoxon rank sum test was used to compare values between untransduced and transduced T cells (indicated by *). The Kruskal Wallis test was used to compare the number of IFN-γ spots between each antigen condition for untransduced or transduced cells. Any Kruskal Wallis test that had p < 0.05 was followed by post-hoc pairwise Wilcoxon rank sum tests and adjusted for multiple comparisons (indicated by #). All statistical comparisons for ELISpot data are in Tables S1 and S2 and for intracellular cytokine staining in Table S4. *p < 0.05, **p < 0.005, ***p < 0.0005. ELISpot = Enzyme-linked immunosorbent spot; B LCL = B lymphoblastoid cell line; PMA = phorbol 12-myristate 13-acetate; SEM = standard error of the mean
Fig. 4
Fig. 4
In vitro priming of cells with the ERV-K-Env epitope did not result in antigen-specificity. a. Magnetic selection is used to separate PBMCs from healthy donors into CD14 + and CD14- fractions. The CD14 + cells were cultured in the presence of GM-CSF and IL-4 to promote development into DCs. Then DCs were loaded with various amounts of peptide and matured with a cocktail of activation cytokines. The peptide-loaded DCs were then used to stimulate the cryopreserved CD14- fraction along with T cell activation cytokines. Additional CD14 isolations were performed to stimulate the ongoing T cell cultures for a total of 2—3 stimulations. Cells were harvested a week after the final stimulation for functional assays. b. Fold-expansion of T cell lines from each donor over the course of the expansion towards the indicated amounts of the ERV-K-Env epitope. c. Representative images of developed wells of T cells from each donor expanded against the ERV-K-Env peptide. Images shown are for T cells from stimulation 3, 100 ng of peptide for background IFN-γ secretion (media), IFN-γ secretion in the presence of 50 µg of ERV-K-Env peptide, and IFN-γ secretion in the presence of the positive control. Number of spots in each well are indicated to the bottom right of each image. Number of IFN-γ spots per well normalized to the positive control (expressed as % of PHA) of T cells from each round of stimulation (increasing shades of blue) for the indicated conditions: Media = background level of IFN-γ secretion from T cells, actin = negative control, ERV-K-Env = ERV-K-Env 12mer/15mer, + PHA = positive control. Each donor is indicated by a different symbol. Open symbols indicate T cells expanded against 100 ng of peptide. Closed symbols indicate CD14- cells or T cells expanded against 500 ng of peptide. Error bars represent SEM of all data points for all donors. ELISpot conditions were plated in duplicate or triplicate as cell numbers allowed. The Kruskal Wallis test was used to compare the number of IFN-γ spots between T cells in the presence of each antigen. Any Kruskal Wallis test that had p < 0.05 was followed by post-hoc pairwise Wilcoxon rank sum tests and adjusted for multiple comparisons using the Bonferroni correction. *p < 0.05, **p < 0.005, ***p < 0.0005. e. Representative flow plots for intracellular IFN-γ and TNF-α of cells from each round of stimulation from Donor 180557 in the presence of media (background), actin (negative control), ERV-K-Env epitiope, or PMA/ionomycin (positive control). Cells were cultured for 6 hours in the presence of 1X protein transport inhibitors (media, actin, ERV-K-Env epitope) or 1X stimulation cocktail (PMA/ionomycin). Flow gating strategy is in Figure S10. N = 1 technical replicate for each donor. f. Quantification of CD8 + T cells from 3 healthy donors that stained positively for TNF-α. Increasing shades of blue indicate T cells from each round of peptide stimulation. Each donor is indicated by a different symbol. Open symbols indicate T cells expanded against 100 ng of peptide. Closed symbols indicate CD14- cells or T cells expanded against 500 ng of peptide. Error bars represent SEM of all data points for all donors. DC: dendritic cell; GM-CSF: granulocyte–macrophage colony stimulating factor; LPS: lipopolysaccharide; ELISpot = Enzyme-linked immunosorbent spot; PHA = phytohemagglutinin; SEM = standard error of the mean

Update of

References

    1. Zhang R, Siu MKY, Ngan HYS, Chan KKL. Molecular Biomarkers for the Early Detection of Ovarian Cancer. Int J Mol Sci. 2022;23:12041. 10.3390/ijms231912041. - DOI - PMC - PubMed
    1. Narod S. Can Advanced-Stage Ovarian Cancer Be Cured? Nat Rev Clin Oncol. 2016;13:255–61. 10.1038/nrclinonc.2015.224. - DOI - PubMed
    1. Rizvi, N.A.; Hellmann, M.D.; Snyder, A.; Kvistborg, P.; Makarov, V.; Havel, J.J.; Lee, W.; Yuan, J.; Wong, P.; Ho, T.S.; et al. Cancer Immunology. Mutational Landscape Determines Sensitivity to PD-1 Blockade in Non-Small Cell Lung Cancer. Science 2015;348:124–128. 10.1126/science.aaa1348. - PMC - PubMed
    1. Desrichard A, Snyder A, Chan TA. Cancer Neoantigens and Applications for Immunotherapy. Clin Cancer Res. 2016;22:807–12. 10.1158/1078-0432.CCR-14-3175. - DOI - PubMed
    1. Schumacher TN, Schreiber RD. Neoantigens in Cancer Immunotherapy. Science. 2015;348:69–74. 10.1126/science.aaa4971. - DOI - PubMed

LinkOut - more resources