. 2024 Oct 9;16(1):118.
doi: 10.1186/s13073-024-01386-5.

DNA demethylation triggers cell free DNA release in colorectal cancer cells

Affiliations

DNA demethylation triggers cell free DNA release in colorectal cancer cells

Valeria Pessei et al. Genome Med. .

Abstract

Background: Liquid biopsy based on cell-free DNA (cfDNA) analysis holds significant promise as a minimally invasive approach for the diagnosis, genotyping, and monitoring of solid malignancies. Human tumors release cfDNA in the bloodstream through a combination of events, including cell death, active and passive release. However, the precise mechanisms leading to cfDNA shedding remain to be characterized. Addressing this question in patients is confounded by several factors, such as tumor burden extent, anatomical and vasculature barriers, and release of nucleic acids from normal cells. In this work, we exploited cancer models to dissect basic mechanisms of DNA release.

Methods: We measured cell loss ratio, doubling time, and cfDNA release in the supernatant of a colorectal cancer (CRC) cell line collection (N = 76) representative of the molecular subtypes previously identified in cancer patients. Association analyses between quantitative parameters of cfDNA release, cell proliferation, and molecular features were evaluated. Functional experiments were performed to test the impact of modulating DNA methylation on cfDNA release.

Results: Higher levels of supernatant cfDNA were significantly associated with slower cell cycling and increased cell death. In addition, a higher cfDNA shedding was found in non-CpG Island Methylator Phenotype (CIMP) models. These results indicate a positive correlation between lower methylation and increased cfDNA levels. To explore this further, we exploited methylation microarrays to identify a subset of probes significantly associated with cfDNA shedding and derive a methylation signature capable of discriminating high from low cfDNA releasers. We applied this signature to an independent set of 176 CRC cell lines and patient derived organoids to select 14 models predicted to be low or high releasers. The methylation profile successfully predicted the amount of cfDNA released in the supernatant. At the functional level, genetic ablation of DNA methyl-transferases increased chromatin accessibility and DNA fragmentation, leading to increased cfDNA release in isogenic CRC cell lines. Furthermore, in vitro treatment of five low releaser CRC cells with a demethylating agent was able to induce a significant increase in cfDNA shedding.

Conclusions: Methylation status of cancer cell lines contributes to the variability of cfDNA shedding in vitro. Changes in methylation pattern are associated with cfDNA release levels and might be exploited to increase sensitivity of liquid biopsy assays.

Keywords: Cell cycle; Cell death; Colorectal cancer; DNA methylation; Liquid biopsy; MSI; cfDNA.


Conflict of interest statement

F.D.N. has received speaker’s fees from Illumina and Pierre Fabre outside of the submitted work. A.Bard. reports receiving grants/research support from Neophore, AstraZeneca, Boehringer Ingelheim, and honoraria/consultation fees from Guardant Health. A.B. is a stock shareholder of Neophore and Kither Biotech. A.B. is an advisory board member for Neophore. L.B. is currently an employee of Biocartis NV. D.O. is currently an employee of AstraZeneca. The remaining authors declare that they have no competing interests.

Figures

Fig. 1
Fig. 1
Workflow of cfDNA release detection protocol. The release of cfDNA was measured in a collection of 76 CRC cell lines including patient-derived primary models. Two million live cells were seeded in duplicate, and the supernatant was collected for cfDNA quantification after 4 days in culture without changing the medium. In parallel, the cell pellet was analyzed for cell cycle and cell death parameters
Fig. 2
Fig. 2
Association of cfDNA release with biological parameters and molecular features in CRC cell lines. A Histograms indicate the amount of cfDNA (ng/µl) detected in the supernatant of 76 CRC cell lines after 4 days in culture. cfDNA values detected by Qubit were normalized on the number of cells at the final day of each experiment. Data points and error bars indicate mean + SD. The column color code groups the cell lines according to the quartiles of cfDNA release. The cell doubling time was measured by fluorescent analysis of cell trace violet incorporation. Cell cycle phases (2N, S, 4N, M) were determined by flow cytometric analysis of Phospho-Histone 3 (PH3). The cell loss index (apoptotic and necrotic cells) was calculated by annexin V/ propidium iodide staining. Annotated molecular features depicted in color boxes indicate Microsatellite Instable or Stable status (MSI or MSS); aneuploidy score based on NGS data as defined by Taylor et al. [36]; CIMP classification based on four methylation classes (CIMP-1, CIMP-2, CIMP-L, CIMP-H) according to Hinoue et al. [42]. B Comparative analyses of cfDNA values in CRC cell line groups based on MSI and MSS status was performed using the non-parametric Mann Whitney test (* p < 0.05). C Comparative analyses of cfDNA values in CRC cell lines with grouped methylation classes labeled as CIMP negative (CIMP classes 1 and 2) or CIMP positive (low and high CIMP classes) was performed using the non-parametric Mann Whitney test (*p < 0.05)
Fig. 3
Fig. 3
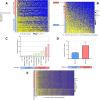
Derivation and validation of a methylation signature to predict cfDNA release in CRC cell lines, patient-derived organoids and patient-derived xenografts. A Heatmap depicting β-values of individual CpG Islands differentially methylated between cell lines experimentally classified in two groups (high vs low cfDNA) based on the amount of cfDNA shed in the supernatant. High cfDNA and low cfDNA screening classes include cell lines distributed in the top two or bottom two quartiles, respectively. Rows in the heatmap indicate samples sorted by cfDNA release values, while columns represent probes sorted by mean methylation level across samples. B Differentially methylated probes between high and low cfDNA releasing cells were applied to a validation dataset of 164 CRC cell lines and 12 PDOs to predict cfDNA release classes. Heatmap rows rank all samples from expected high to expected low cfDNA based on silhouette width values. Columns indicate probes sorted by mean methylation level across all samples. C Evaluation of cfDNA release in the supernatant of the indicated CRC cell lines, including patient-derived models (HROC257_T0M1, HROC131_T0M3, IRCC1_XL, HROC383_T0M2, HROC278_MET, CRC0078_XL, HROC277_T0M1, CRC0104_XL), chosen among those predicted to be high or low releasers based on the heatmap shown in panel B. The color code of each bar is based on cfDNA screening quartiles highlighted in Figure 2A. Columns and error bars indicate mean + SD. D Evaluation of cfDNA release in the supernatant of the indicated CRC patient-derived organoids, chosen among those predicted to be high or low releasers based on the heatmap shown in right panel A. Columns and error bars indicate mean + SEM. E Heatmap depicting β-values of individual CpG Islands (125/145, due to the filtering of probes that could hybridize to the mouse genome, see Methods) of the signature in 490 CRC PDXs, divided in the two groups identified by the methylation classifier. Molecular annotations and the clusters identified by NMF with k=2 are shown on the left. MSI or CIMP positive samples are enriched in the low cfDNA release group (Fisher’s test, all *** P < 0.005)
Fig. 4
Fig. 4
Genetic and pharmacological depletion of DNA methylation stimulates cfDNA release. A cfDNA release was increased in the supernatant of CRC cells with inactivation of DNA Methyltransferases 1 and 3B (HCT116DKO) compared to their parental counterpart (HCT116). Circles indicate individual replicates. Unpaired test with Welch’s correction (* p < 0.05). B cfDNA shedding was increased in the supernatant of low releasing CRC cells exposed to non-toxic concentrations (1 nM) of the demethylating agent decitabine. Statistical significance: * p < 0.05, ** p < 0.01
Fig. 5
Fig. 5
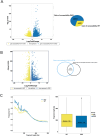
Association between cfDNA release and chromatin accessibility. A Differential chromatin accessibility analysis between HCT116 DKO and their parental WT counterpart. B Differential gene expression analysis between HCT116 DKO and their parental WT counterpart. Out of the 2779 genes upregulated in DKO in comparison to WT cells, 373 showed increased chromatin accessibility in their promoter. C Fragment length distribution of intracellular DNA from HCT116 WT and DKO cells analyzed by ATAC-seq. Statistical significance: **** p <0.0001

References

    1. Di Nicolantonio F, Vitiello PP, Marsoni S, Siena S, Tabernero J, Trusolino L, et al. Precision oncology in metastatic colorectal cancer — from biology to medicine. Vol. 18, Nature Reviews Clinical Oncology. Nature Research; 2021. p. 506–25. - PubMed
    1. Keller L, Belloum Y, Wikman H, Pantel K. Clinical relevance of blood-based ctDNA analysis: mutation detection and beyond. Vol. 124, British Journal of Cancer. Springer Nature; 2021. p. 345–58. - PMC - PubMed
    1. Stejskal P, Goodarzi H, Srovnal J, Hajdúch M, van ’t Veer LJ, Magbanua MJM. Circulating tumor nucleic acids: biology, release mechanisms, and clinical relevance. Vol. 22, Molecular Cancer. BioMed Central Ltd; 2023. - PMC - PubMed
    1. Thierry AR, El Messaoudi S, Gahan PB, Anker P, Stroun M. Origins, structures, and functions of circulating DNA in oncology. Cancer Metastasis Rev. 2016Sep 1;35(3):347–76. - PMC - PubMed
    1. P. Mandel PM. Nuclear Acids In Human Blood Plasma. C R Seances Soc Biol Fil. 1948; - PubMed