. 2024 Oct 9;43(1):281.
doi: 10.1186/s13046-024-03204-7.

Exosomal miR-106a-5p from highly metastatic colorectal cancer cells drives liver metastasis by inducing macrophage M2 polarization in the tumor microenvironment

Affiliations

Exosomal miR-106a-5p from highly metastatic colorectal cancer cells drives liver metastasis by inducing macrophage M2 polarization in the tumor microenvironment

Yahang Liang et al. J Exp Clin Cancer Res. .

Abstract

Background: The tumor microenvironment (TME) is a dynamic system orchestrated by intricate cell-to-cell crosstalk. Specifically, macrophages within the TME play a crucial role in driving tumor progression. Exosomes are key mediators of communication between tumor cells and the TME. However, the mechanisms underlying exosome-driven crosstalk between tumor cells and macrophages during colorectal cancer (CRC) progression remain incompletely elucidated.

Methods: Single-cell RNA sequencing were analyzed using the Seurat package. Exosomes were isolated using ultracentrifugation and characterized by transmission electron microscopy, nanoparticle tracking analysis, and western blot. miRNAs differentially expressed in exosomes were analyzed using the limma package. CD206 expression in CRC tissues, exosomes tracing, and exosomal miR-106a-5p transport were observed through immunofluorescence. Macrophage polarization was assessed via qRT-PCR, ELISA, and flow cytometry. The interactions between miR-106a-5p, hnRNPA1, and SOCS6 were evaluated using miRNA pull-down, RIP, and dual-luciferase reporter assays. Transwell assays and liver metastasis model explored the role of exosomal miR-106a-5p-induced M2 macrophages in promoting CRC liver metastasis.

Result: The proportion of M2 macrophages is increased in CRC with liver metastasis compared to those without. Highly metastatic CRC cells release exosomes enriched with miR-106a-5p, which promote macrophages M2 polarization by suppressing SOCS6 and activating JAK2/STAT3 pathway. These M2 macrophages reciprocally enhance CRC liver metastasis. hnRNPA1 regulate the transport of miR-106a-5p into exosomes. Clinically, elevated miR-106a-5p in plasma exosomes correlated with liver metastasis and poor prognosis.

Conclusion: CRC-derived exosomal miR-106a-5p plays a critical role in promoting liver metastasis and is a potential biomarker for the prevention and treatment of CRC liver metastasis.

Keywords: Colorectal cancer; Exosomes; Liver metastasis; Macrophage; miRNAs.


Conflict of interest statement

The authors declare that they have no conflict of interest.

Figures
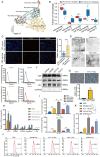
Fig. 1
Fig. 1
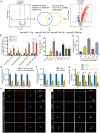
Exosomes released by highly metastatic CRC cells drive macrophages M2 polarization. (A) Uniform manifold approximation and projection (UMAP) plot of macrophage clusters. (B) Boxplot showed the proportions of macrophage types in CRC tissues with or without liver metastasis. (C) Immunofluorescence assay was used to detected the proportions of CD206+ cells in CRC tissues with (n = 20) or without (n = 20) liver metastasis. Scale bar = 50 μm. (D) TEM showed the typical structures of SW620, SW480, HCT 116 and Caco-2 exosomes. Scale bar = 100 μm. (E) The particle size of exosomes was detected by NTA. (F) The presence and absence exosomal markers were detected by western blot. (G) Representative image following 24 h treatment of THP-1 cells with 100 ng/mL phorbol 12-myristate 13-acetate (PMA) to induce their differentiation into Mφ. qRT-PCR was utilized to detect the marker gene expression of macrophage (CD68). (H) qRT-PCR was performed to detect changes in the expression of M2 (IL-10, CD206, CD163, and Arginase-1) and M1 (IL-1β) macrophages marker genes in Mφ after incubated with different exosomes. (I) ELISA was used to assess the secretion of TGF-β and IL-10 by Mφ treated with different exosomes. J-K. Flow cytometry was used to detect the proportion of CD206+ macrophages in Mφ after incubated with different exosomes. The data presented herein represent the outcomes of a minimum of three independent experiments and are depicted as the mean ± standard deviation (SD). * P < 0.05, ** P < 0.01, *** P < 0.001
Fig. 2
Fig. 2
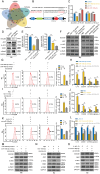
miR-106a-5p abundance in exosomes from highly metastatic CRC cells. (A) Volcano plot exhibiting the differentially expressed exosomal miRNAs in the GSE115114 and GSE123708. (B) qRT-PCR was performed to detect the expression of four miRNAs in exosomes derived from four CRC cells. (C) The expression of miR-106a-5p in NCM460 and CRC cell lines. (D) The expression of miR-106a-5p in Mφ after treated with PBS, Caco-2 exosomes, HCT 116 exosomes, SW480 exosomes or SW620 exosomes, respectively. E-F. The expression levels of miR-106a-5p in Mφ after incubated with physically (E) or pharmacologically (F) exosome-depleted supernatants compared to those treated with standard supernatant. G. The expression levels of miR-106a-5p were detected in the supernatant of CRC cells following treatment with RNase A or RNase A plus Triton X-100. H. The presence of green fluorescent signals in Mφ after treated with PKH67-labeled exosomes for 24 h. Scale bar = 10 μm. I. Mφ were incubated with exosomes derived from SW620/SW480/HCT 116/Caco-2 transfected with Cy3-labeled miR-106a-5p (red). Scale bar = 10 μm. The data presented herein represent the outcomes of a minimum of three independent experiments and are depicted as the mean ± standard deviation (SD). ns = No significant difference, * P < 0.05, ** P < 0.01, *** P < 0.001
Fig. 3
Fig. 3
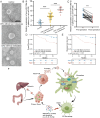
Regulation of miR-106a-5p packaging into exosomes by hnRNPA1. (A) The potential RBPs that may bind to miR-106a-5p. (B) The specific interaction between the miR-106a-5p sequence and hnRNPA1 motifs. C-D. After transfecting HCT 116 and SW620 cells with sh-hnRNPA1, the expression of hnRNPA1 was detected by qRT-PCR and western blot (C), and the expression of miR-106a-5p was detected by qRT-PCR (D). E-G. Mφ cells were co-cultured with SW620/HCT 116 pre-transfected with sh-hnRNPA1 and Cy3-miR-106a-5p (red). Immunofluorescence was performed to detect the red fluorescent signals in macrophages. Scale bar = 10 μm. H-I. Mφ cells were incubated with exosomes derived from SW620/HCT 116 transfected with sh-hnRNPA1 and Cy3-miR-106a-5p (red). Immunofluorescence was performed to detect the red fluorescent signals in macrophages. Scale bar = 10 μm. J. Western blot was employed to assess hnRNPA1 expression in samples obtained from miRNA pulldowns, utilizing nuclear, cytoplasmic, or exosomal lysates from HCT116 cells. K. RIP assay was executed using an anti-hnRNPA1 antibody (or IgG as a control) on lysates derived from HCT 116 cells or exosomes. qRT-PCR was used to quantify miR-106a-5p levels in the immunoprecipitated samples, expressed as percentages relative to the input (% input). The data presented herein represent the outcomes of a minimum of three independent experiments and are depicted as the mean ± standard deviation (SD). ns = No significant difference, ** P < 0.01, *** P < 0.001
Fig. 4
Fig. 4
Induction of M2 polarization by exosomal miR-106a-5p. (A) qRT-PCR was used to detect changes in the expression of M2 (IL-10, CD206, CD163, and Arginase-1) macrophage marker genes in Mφ after incubated with different exosomes. (B) ELISA was used to assess the secretion of TGF-β and IL-10 by Mφ treated with different exosomes. (C) Flow cytometry was used to detect the proportion of CD206+ macrophages in Mφ after incubated with different exosomes. (D) qRT-PCR was employed to detect changes in the expression of M2 (IL-10, CD206, CD163, and Arginase-1) macrophage marker genes in Mφ following transfection with miR-106a-5p mimics. (E) ELISA was used to assess the secretion of TGF-β and IL-10 by Mφ transfected with miR-106a-5p mimics. (F) Flow cytometry was used to detect the proportion of CD206+ macrophages in Mφ after transfected with miR-106a-5p mimics. The data presented herein represent the outcomes of a minimum of three independent experiments and are depicted as the mean ± standard deviation (SD). ** P < 0.01, *** P < 0.001
Fig. 5
Fig. 5
Direct targeting of SOCS6 and activation of JAK2/STAT3 signaling pathway by exosomal miR-106a-5p in macrophages. A. Venn plot showing the potential target genes predicted to bind with miR-106a-5p by five bioinformatics tools. B. The predicted binding sites of miR-106a-5p on the 3’UTR of SOCS6. C. In HEK 293T cells, dual-luciferase reporter gene assays were conducted using transfection with either wild or mutant SOCS6 3’-UTR plasma, along with miR-106a-5p mimics or inhibitor. The luciferase activity was detected 48 h post-transfection and normalized based on the ratio of firefly to renilla luciferase signals. D. 48 h following the transfection of miR-106a-5p mimics in Mφ, western blot was conducted to detect the expression of SOCS6 and the activation of the JAK2/STAT3 pathway. E. qRT-PCR was employed to detect the expression of SOCS6 in Mφ after treatment with different exosomes. F. 48 h following the co-culture of different exosomes in Mφ, western blot was conducted to detect the expression of SOCS6 and the activation of the JAK2/STAT3 pathway. G-H. Mφ were transfected with miR-106a-5p mimics alone or combined with SOCS6-OE. Flow cytometry was employed to assess the proportion of CD206+ macrophages (G). qRT-PCR was used to measure the expression of IL-10, CD206, CD163, and Arginase-1 (H). I-J. Mφ were treated with HCT 116 exosomes alone or concurrently transfected with SOCS6-OE. Flow cytometry was employed to determine the proportion of CD206+ macrophages (I). qRT-PCR was used to evaluate the expression of IL-10, CD206, CD163, and Arginase-1 (J). K-L. Mφ were differentiated into M2 macrophage using IL-4 (50 ng/mL) and IL-13 (50 ng/mL), followed by transfection with either miR-106a-5p inhibitor alone or combined with sh-SOCS6. Flow cytometry was utilized to assess the proportion of CD206+ macrophages (K). qRT-PCR was conducted to measure the expression of IL-10, CD206, CD163, and Arginase-1 (L). M. Mφ were transfected with miR-106a-5p mimics alone or combined with SOCS6-OE, followed by western blotting to detect SOCS6 expression and JAK2/STAT3 pathway activation. N. Mφ were treated with HCT 116 exosomes alone or concurrently transfected with SOCS6-OE, followed by western blotting to detect SOCS6 expression and JAK2/STAT3 pathway activation. O. Mφ were differentiated into M2 macrophages using IL-4 and IL-13, then transfected with miR-106a-5p inhibitor alone or combined with sh-SOCS6, followed by western blotting to detect SOCS6 expression and JAK2/STAT3 pathway activation. The data presented herein represent the outcomes of a minimum of three independent experiments and are depicted as the mean ± standard deviation (SD). ns = No significant difference, * P < 0.05, ** P < 0.01, *** P < 0.001
Fig. 6
Fig. 6
Reciprocal promotion of CRC liver metastasis by exosomal miR-106a-5p-induced M2 macrophages. A-B. Mφ cells were transfected with miR-106a-5p mimics or the corresponding control, and then the CM was added to the HCT-8 and LoVo cell lines. Transwell assays were performed to assess the migration and invasion capabilities of HCT-8 (A) and LoVo (B) cells treated with various CM. C. Mφ cells were co-cultured with exosomes derived from SW480-miR-106a-5p mimics, HCT 116-anti-miR-106a-5p, and their respective control groups. The co-cultured CM were then added to HCT-8 and LoVo cells. Transwell assays were performed to assess their migration and invasion capabilities. D-G. Representative bioluminescence images of liver metastasis in various treatment groups of nude mice (D-E). Representative photographs of liver metastasis (F) and HE staining (G) in various treatment groups of nude mice. The data presented herein represent the outcomes of a minimum of three independent experiments and are depicted as the mean ± standard deviation (SD). *P < 0.05, ** P < 0.01, *** P < 0.001
Fig. 7
Fig. 7
Elevated plasma exosomal miR-106a-5p as an independent prognostic marker in CRC. (A) TEM showed the typical structures of healthy individuals and CRC patients’ plasma exosomes. Scale bar = 100 μm. (B) qRT-PCR was used to detect the expression of miR-106a-5p in exosomes from healthy individuals, CRC patients without liver metastasis, and CRC patients with liver metastasis. (C) qRT-PCR was performed to assess the expression of miR-106a-5p in the plasma exosomes of 20 CRC patients both before and after undergoing surgery. D-E. High expression of exosomal miR-106a-5p correlated with shorter OS (D) and DFS (E). F. Schematic diagram depicting the positive feedback loop between highly metastatic CRC cells and M2 macrophages in CRC during liver metastasis. The data presented herein represent the outcomes of a minimum of three independent experiments and are depicted as the mean ± standard deviation (SD). *P < 0.05, ** P < 0.01, *** P < 0.001

Similar articles

Cited by

References

    1. Sung H, Ferlay J, Siegel RL, Laversanne M, Soerjomataram I, Jemal A, et al. Global Cancer statistics 2020: GLOBOCAN estimates of incidence and Mortality Worldwide for 36 cancers in 185 countries. CA Cancer J Clin. 2021;71:209–49. - PubMed
    1. Siegel RL, Wagle NS, Cercek A, Smith RA, Jemal A. Colorectal cancer statistics, 2023. CA Cancer J Clin. 2023;73:233–54. - PubMed
    1. Margonis GA, Sergentanis TN, Ntanasis-Stathopoulos I, Andreatos N, Tzanninis IG, Sasaki K, et al. Impact of Surgical Margin Width on recurrence and overall survival following R0 hepatic resection of colorectal metastases: a systematic review and Meta-analysis. Ann Surg. 2018;267:1047–55. - PubMed
    1. Deng L, Li T, Liao Y, Liu S, Xie Z, Huang Z, et al. Peritumoral activated hepatic stellate cells are associated with hepatic recurrence for resectable colorectal adenocarcinoma liver metastasis following resection. Oncol Lett. 2020;20:287. - PMC - PubMed
    1. Yang L, Li T, Shi H, Zhou Z, Huang Z, Lei X. The cellular and molecular components involved in pre-metastatic niche formation in colorectal cancer liver metastasis. Expert Rev Gastroenterol Hepatol. 2021;15:389–99. - PubMed

MeSH terms

LinkOut - more resources